-
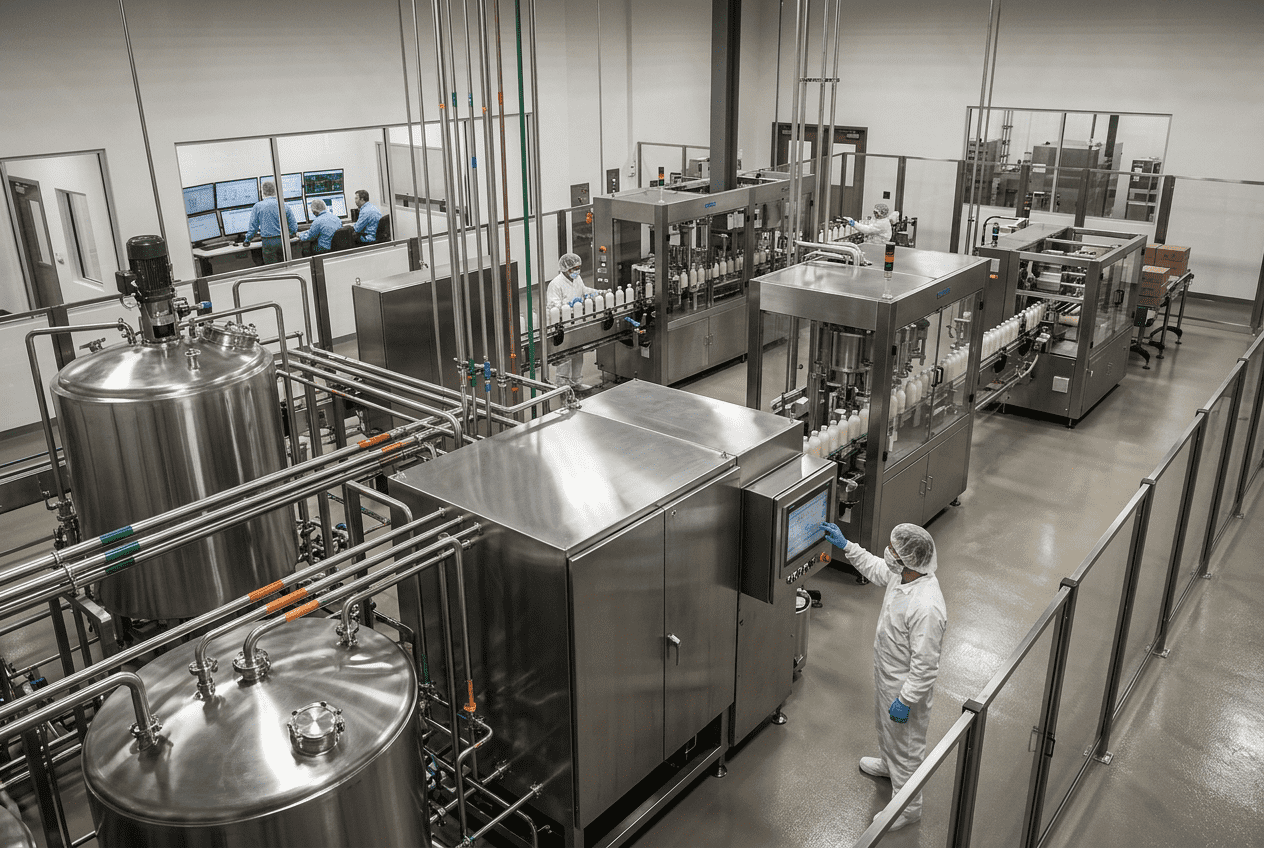
5 Pillars of Integrated Pest Management for Food Facilities
Food facilities in the United States cannot treat pest control as a side task. In meat plants, dairies, bakeries, beverage operations, frozen food sites, dry ingredient warehouses, and co-packing plants, pest activity can quickly become a food safety event, an audit nonconformance, or a production disruption. Integrated pest management works best when it is built into operations, maintenance, sanitation, and capital planning rather than handled only through reactive spraying or emergency callouts. Across major production corridors such as Chicago, Atlanta, Dallas-Fort Worth, Los Angeles, the Research Triangle, the Inland Empire, Kansas City, and the New Jersey port region, facilities face similar pressures: tighter third-party audits, more traceability expectations, more supplier scrutiny, and rising costs tied to waste, shutdowns, and customer complaints. A practical pest program in this environment depends on structured risk assessment, exclusion, monitoring, documentation, sanitation alignment, and trend-based corrective action. The fastest way to strengthen integrated pest management in a U.S. food facility is to focus on seven operating priorities: identify the exact pest species, rank risk by process area, close structural entry points, position monitoring devices based on traffic and biology, document bait activity precisely, connect findings to sanitation and harbor reduction, and review trend data monthly with both the plant team and the pest contractor. Facilities that do this consistently typically reduce repeat findings, improve audit confidence, and avoid the expensive cycle of emergency treatments and recurring contamination risk. For most processors, the best buying decision is not simply choosing the lowest-cost pest service. It is selecting a program that can stand up to FDA, USDA, SQF, and BRC expectations while matching the realities of the plant layout, ingredient profile, traffic flow, and utility design. High-moisture beverage plants, raw protein operations, and dry goods warehouses each need different monitoring density, different sanitation controls, and different structural priorities. The table above shows why strong programs are cross-functional. Pest prevention touches building envelope design, floor drainage, air balance, traffic management, dock operation, waste handling, water control, and record discipline. That matters especially for facilities moving product through ports and distribution lanes tied to Savannah, Long Beach, Houston, Newark, and Seattle, where inbound and outbound traffic raises exposure. Integrated pest management starts with knowing exactly what is present. “Rodent activity” is too broad. A roof rat issue at a warm coastal beverage plant in Southern California behaves differently from a house mouse problem in a dry bakery warehouse in Ohio, and both differ from stored product insect pressure in a grain-based ingredient facility near Kansas City. Correct identification determines where to inspect, what attractants to remove, how far pests travel, and what monitoring tools make sense. In U.S. food plants, the most common categories include commensal rodents, flies, cockroaches, ants, occasional invaders, and stored product insects such as Indian meal moths, cigarette beetles, flour beetles, and warehouse beetles. Each category has a distinct biology. Flies often indicate drainage, decaying residues, wet waste, or door-management issues. Stored product insects may point to older inventory, spills under equipment, or infested incoming raw materials. Rodents usually reveal structural gaps, dock discipline failures, vegetation contact, or poor waste container control. Risk assessment should map the site by vulnerability, not just by square footage. Raw receiving, ingredient storage, packaging storage, processing rooms, utility spaces, employee welfare areas, roof penetrations, and exterior waste zones all deserve different ratings. The highest concern areas are normally high-care rooms, exposed product zones, allergen-sensitive storage, and packaging areas immediately upstream of filling or sealing. The practical lesson from this table is that not all captures mean the same thing. One warehouse beetle in a pheromone trap may justify a receiving review. One mouse in a high-care corridor may demand immediate escalation, line inspection, structural repair, and temporary segregation steps. Plants should define response thresholds in writing by species and zone. Risk assessment is also influenced by product type. A ready-to-drink beverage facility with syrup rooms and sweet residues is vulnerable to flies and ants. A protein plant with wet cleaning, warm byproduct streams, and dock traffic may face fly pressure and rodent attraction. A dry powder operation can see stored product insects from raw material movement. This is where plant design and engineering matter: zoning, drainage slope, wall penetrations, ceiling access, utility routing, and hygienic equipment support all affect pest risk over the long term. Exclusion is often the highest-return investment in integrated pest management because it addresses the entry pathway instead of only treating the symptom. In the United States, many food plants occupy converted industrial buildings, older warehouses, or expanded campuses where multiple construction phases created envelope weaknesses. Loading docks, personnel doors, roof penetrations, pipe chases, expansion joints, roll-up doors, and wall-floor interfaces are common failure points. A useful exclusion review should include daytime inspection, after-dark light leak inspection, roof review, dock review, and utility entry verification. Inspectors should evaluate door sweeps, door closure speed, dock leveler gaps, bird access at canopies, air curtain performance, screen condition, and drainage. Exterior grounds matter too. Standing water, dense vegetation, unmanaged pallets, scrap storage, and overflowing compactors can defeat even a strong interior program. Facilities near Gulf Coast humidity, Midwest grain lanes, or major port traffic often need stronger dock discipline because frequent trailer movement increases exposure. The same is true around rail-fed ingredient sites and cross-dock distribution centers. If a receiving bay remains open for operational convenience, monitoring may detect the issue, but exclusion solves it. This table shows that exclusion failures are rarely mysterious. They are physical, observable, and correctable. The challenge is ownership. The most effective plants assign each gap to maintenance or facilities with due dates and verification photos, then review closure during food safety meetings. For companies planning expansions, line additions, or utility upgrades, building integrity should be considered before equipment arrives. Firms that combine engineering with field execution can help reduce future risk by designing cleaner utility routing, stronger hygienic zoning, better drain layout, and easier-to-clean support structures. That type of up-front thinking is often more valuable than repeated downstream pest treatments. Monitoring is the data backbone of pest management. Device placement should follow pest biology, traffic flow, product sensitivity, and structural risk. Too many facilities still use a static map that has not been updated after line changes, warehouse re-racking, or expansion work. When packaging storage moved, did traps move? When a syrup room was added, were fly monitoring devices reassessed? When a utility trench was opened, did rodent risk change? Interior and exterior devices should not be placed simply by equal spacing. They should be positioned around doors, perimeters, utility corridors, ingredient receiving, waste routes, vulnerable corners, and historically active zones. Glue boards, mechanical traps, pheromone devices, insect light traps, and exterior rodent stations each have specific roles. In exposed product spaces, insect light traps should be chosen and oriented carefully to avoid drawing insects toward production. U.S. processors that ship nationally often face seasonal variation. The Southeast may see longer fly pressure windows, while northern states can see autumn rodent migration into warm buildings. Good monitoring maps reflect these shifts. The same is true for urban sites near dense food corridors versus rural sites near fields or livestock activity. The explanation here is straightforward: each device answers a different question. Monitoring only works when plants define what they want to learn from the device and what action is triggered by the result. A trap that creates no decision is only paperwork. Technology adoption is accelerating. Remote sensors, digital map platforms, photo-logged service reports, and dashboard alerts are becoming more common in 2026 planning cycles. For large networks of facilities, especially those spread across multiple states, digital standardization can make trend review faster and more consistent. Bait stations are one of the most misunderstood parts of a food plant program. Exterior baiting may be appropriate where risk justifies it, but it should never substitute for exclusion and interior sanitation. Every station should have a unique identifier, a current map location, secure anchoring where required, a service history, and clear notation of consumption, damage, or tampering. Missing or undocumented stations create audit exposure and can obscure real rodent pressure. Documentation should show not only that a station was checked, but what changed. Was there fresh feeding? Was a station relocated because of construction? Did landscaping increase harborage nearby? Were non-target conditions observed? Good records allow a plant to connect bait pressure with receiving patterns, weather, nearby construction, and housekeeping performance. In sensitive operations, especially those with USDA oversight, bait choices, station placement, and service language should align tightly with site policy. Interior toxic bait use may be highly restricted or prohibited in many food contact environments, so programs often rely more on mechanical devices indoors and baiting strategies outdoors. The message from this table is that documentation is not busywork. It is how a plant proves control, identifies change, and supports timely intervention. In many customer audits, weak records can damage confidence even when actual pest pressure is low. Sanitation and pest management are inseparable. Pests need food, water, and shelter. Most recurring issues survive because one or more of those conditions remain available after each service visit. In food and beverage plants, hidden residues under conveyors, syrup drips near tank farms, powder buildup under mezzanines, condensate near utility lines, and neglected employee areas are common enablers. Harborage elimination means more than general cleaning. It includes removing unused parts, limiting cardboard storage, managing idle equipment, cleaning beneath low-clearance assets, correcting leaks, and keeping wall perimeters inspectable. In older plants, dead spaces behind added panels, abandoned conduit openings, and inaccessible hollow frames can become chronic trouble spots. Sanitation integration works best when pest findings translate into specific cleaning tasks. If fly activity rises in a filler room, teams should inspect drains, gaskets, rinse cabinets, and nearby waste routes. If stored product insects appear in a spice warehouse, inspect aged inventory, torn bags, and structural ledges above storage racks. The corrective action should be location-specific and evidence-based. Buying advice for sanitation-linked pest control is simple: choose contractors and internal protocols that can diagnose root causes, not just count captures. Facilities with high-moisture processing, washdown systems, or sweet product handling should prioritize drain care, leak control, and residue mapping. Dry plants should prioritize dust, spillage, stock rotation, and inaccessible ledges. Harbor elimination also overlaps with capital project execution. Better equipment spacing, hygienic framework, drainage design, and utility coordination can reduce future residue traps. This is where engineering-minded project partners can bring value beyond a conventional contractor approach. By aligning process layout, utilities, and maintainability, facilities can lower chronic sanitation burden and therefore lower pest pressure. A pest control contractor should be managed as a technical service provider, not just a vendor that swaps traps. Food manufacturers need clear scopes, escalation paths, documentation expectations, service intervals, emergency response rules, and trend reporting standards. Plants should know who approves pesticide use, who signs off on corrective actions, and how unresolved structural issues are escalated. Service records should include inspection notes, devices checked, captures, species identified, sanitation observations, structural deficiencies, chemicals or non-chemical interventions used, and recommended actions with deadlines. The strongest plants review these records in cross-functional meetings that include QA, sanitation, operations, and maintenance. For multi-site operations in the United States, standardization matters. A plant in North Carolina should not use materially different documentation logic than a sister facility in Texas or California unless risk truly requires it. Consistent service records make enterprise review easier and support customer confidence. When facilities are expanding or adding process systems, contractor oversight should also connect to construction management. During shutdowns, line relocations, or wall penetrations, temporary pest exposure increases. Coordinating contractors with engineering teams reduces the chance that project work introduces long-term vulnerabilities. This is one reason many processors prefer partners that understand both plant operations and field execution. More on integrated project support can be found through food and beverage engineering services that bridge design, build, and operational oversight. Data without action does not improve food safety. Trend analysis should occur at least monthly and include device captures, species shifts, station consumption, high-risk zones, recurring sanitation observations, unresolved structural findings, and seasonality. A single spike may reflect a weather event or a receiving issue. A three-month upward pattern usually signals a process or building problem that remains open. Plants should chart findings by area and pest type, then match each trend to corrective action. If rodent exterior bait pressure rises at the west dock, review door timing, dock seals, waste handling, and adjacent vegetation. If fly captures increase near packaging, review drains, condensate, floor cleaning, and door practices. If stored product insects appear near a specific ingredient, inspect supplier history, lot age, and rack cleanliness. The table makes trend review practical by linking data to ownership and timeframes. This is what auditors, customers, and internal leadership want to see: not just findings, but a controlled management response. Looking toward 2026, three trends are shaping U.S. programs. First, digital monitoring and remote reporting will expand, especially in larger networks. Second, policy and customer requirements will continue pushing toward lower-risk, targeted interventions with stronger documentation. Third, sustainability goals will encourage facilities to emphasize exclusion, sanitation, material management, and precision treatment rather than broad chemical dependence. For food and beverage manufacturers that want pest prevention supported by stronger plant design and execution discipline, Disruptive Process Solutions brings a broader operational perspective than a typical specialty contractor alone. The company works across the United States and Canada, supporting processors with project-based engineering, installation, and integration that can materially affect long-term sanitation performance, equipment access, and building integrity. On the technological side, DPS supports structural, mechanical, plumbing, electrical, process, and controls engineering, including automation, PLC programming, and SCADA integration. Those capabilities matter in pest-risk reduction because utility routing, drainage, condensate control, process zoning, and line logic all influence housekeeping and exposure. Manufacturers evaluating expansions, utility upgrades, or sanitation-sensitive process changes can review service capabilities for engineered project support when planning preventive improvements rather than waiting for repeated operational symptoms. On the manufacturing side, DPS also develops and supplies selected process equipment such as tanks, CIP systems, marination tumblers, and cooking vessels. For processors seeking easier cleaning access and better operational flow, equipment selection and custom fabrication can support cleaner layouts and fewer harborage points. Additional information on process equipment solutions is useful for facilities modernizing high-moisture, protein, beverage, or aseptic systems. On the service side, DPS operates through a design-build-manage model that combines planning, construction coordination, project management, owner representation, and installation oversight. This is especially relevant when a plant is relocating lines, adding utilities, redesigning receiving zones, or scaling a co-packing operation where pest risk can change quickly during construction. Manufacturers can explore company background through the team and operating approach, or review project case examples to see how disciplined execution supports operational outcomes. In practical terms, DPS is not a pest control contractor. Its value in this conversation is helping food and beverage plants build cleaner, more maintainable, more operationally sound environments where integrated pest management becomes easier to execute and sustain. What is the most important part of integrated pest management in a food facility?Accurate identification and root-cause correction are the foundation. Without species-level understanding and area-specific response, facilities often spend money on repeated treatment without solving the entry or harborage issue. How often should a food plant review pest trends?At minimum, monthly. High-risk plants or sites under active pressure may need weekly review of key metrics such as rodent captures, fly trends, drain findings, and open structural actions. Are bait stations enough to control rodents?No. Bait stations can help manage exterior pressure, but exclusion, sanitation, waste control, and dock discipline are what prevent recurring problems. Interior control in sensitive spaces usually relies more on monitoring and mechanical devices. What pests are most common in U.S. food and beverage plants?House mice, roof rats, flies, ants, cockroaches, and stored product insects are common, but the mix changes by product type, geography, age of facility, and season. How should facilities near ports or major logistics hubs adjust their program?Sites near Savannah, Long Beach, Newark, Houston, or major inland freight corridors should give extra attention to receiving inspection, dock management, trailer gaps, pallet condition, and raw material quarantine procedures because traffic volume raises exposure. What records should always be available during an audit?Current maps, device logs, service reports, species identification records, pesticide usage records where applicable, corrective action logs, trend summaries, and verification that structural and sanitation issues were closed. How do capital projects affect pest risk?Construction can open walls, create dust, move traffic patterns, and expose utility gaps. Any expansion, line move, or shutdown should include temporary pest controls, post-project inspection, and map updates. What is changing in 2026?Expect greater use of digital monitoring, stronger documentation expectations, more sustainability focus, and tighter alignment between pest prevention, sanitary design, and cross-functional plant management. A mature integrated pest management program is not just a compliance necessity. It is a business system that protects product, uptime, customer trust, and long-term plant performance. For U.S. food manufacturers, the best results come when pest prevention is treated as part of facility design, operational discipline, and continuous improvement. -
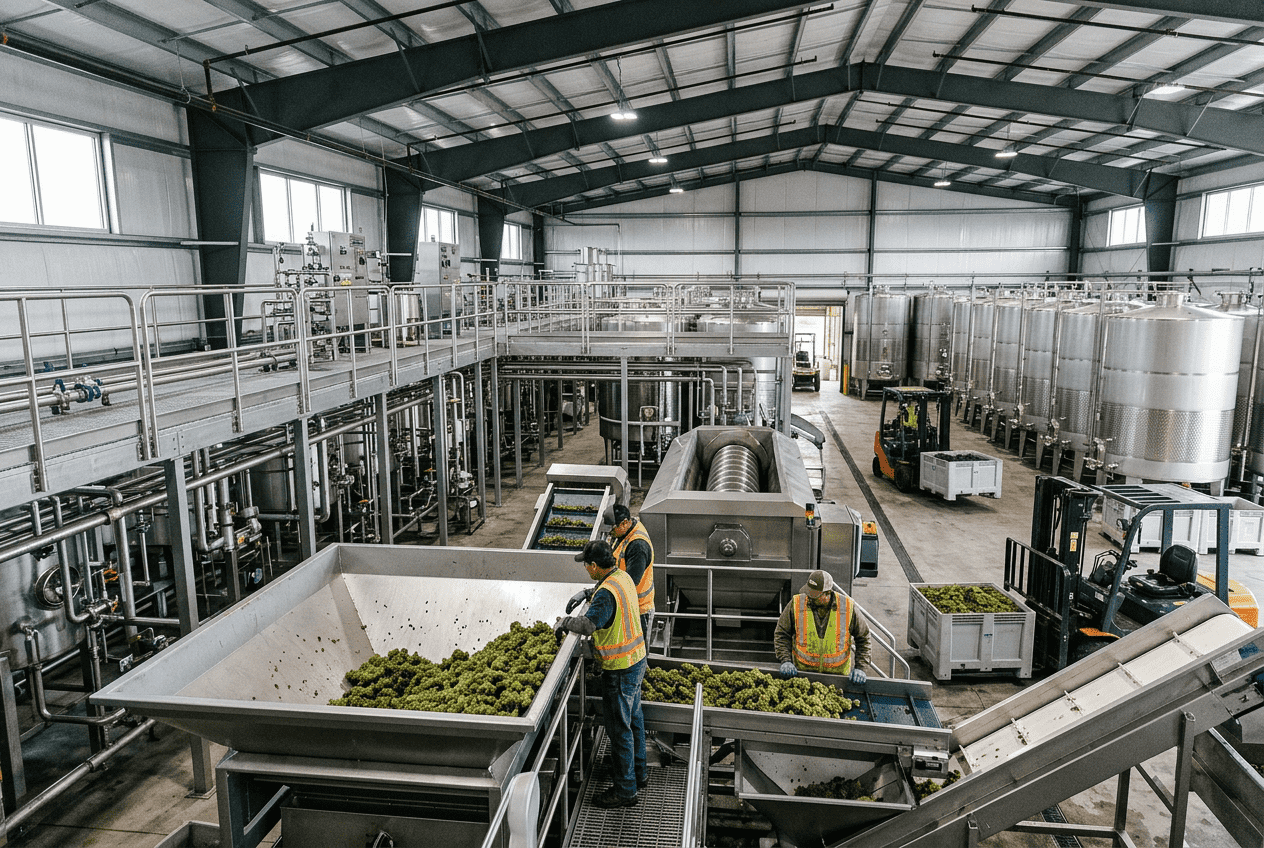
Food Plant Foreign Material Control: 7 Prevention Strategies
Foreign material control in food manufacturing is a plantwide discipline that combines equipment design, inspection technology, supplier management, maintenance control, and employee behavior. In the United States, processors are expected to prevent, detect, and respond to risks such as metal, glass, stones, hard plastic, rubber, wood, and packaging fragments before product reaches consumers. The strongest programs do not rely on a single checkpoint. They build multiple barriers across receiving, processing, packaging, warehousing, and sanitation. For operators in major U.S. production corridors such as Chicago, Dallas, Fresno, the Carolinas, Central California, and the Gulf Coast, foreign material prevention is also tied to uptime, recall exposure, insurance pressure, customer scorecards, and retailer expectations. Plants shipping through Los Angeles/Long Beach, Savannah, Houston, or Port Newark often handle complex supply chains where ingredient variability raises contamination risk. That is why prevention strategies must fit the product, line speed, packaging format, and hazard profile of each facility. The fastest answer is this: food plants reduce foreign material incidents by using seven layered strategies. First, install and validate X-ray systems where density-based contaminants can be detected. Second, use metal detectors with routine challenge testing and disciplined calibration. Third, strengthen visual inspection with clear human error controls. Fourth, tighten supplier approval and incoming material verification. Fifth, manage glass and brittle plastic through a documented register and breakage response plan. Sixth, control tools, parts, and maintenance activity so equipment work does not create contamination. Seventh, train employees to report near misses immediately without fear. In the United States market, best results come when these controls are linked to HACCP, preventive controls, sanitation standard operating procedures, and food safety culture metrics. Facilities producing ready-to-eat proteins, dairy, beverages, sauces, frozen meals, bakery items, aseptic products, and contract-packed consumer goods usually need different combinations of detection and prevention points. A high-speed bottled beverage line in California may prioritize closure integrity and glass control, while a Midwest protein processor may focus more heavily on metal wear, knife management, and maintenance part accountability. Below is a practical summary of the most common foreign material sources seen across U.S. plants. This table shows why no single device can solve the issue. Foreign material prevention works when plants treat it as an integrated operational system rather than a standalone inspection step. X-ray inspection is one of the most valuable tools for identifying dense foreign material in finished product and, in some applications, in-process product. It is commonly used to detect metal, glass, mineral stone, calcified bone, and certain dense plastics, depending on product thickness, orientation, and package composition. X-ray also offers side benefits such as fill level checks, mass verification, and missing component detection. In the United States, high-risk categories such as ready meals, cheese blocks, nut products, confectionery, tray-packed meats, and bottled foods increasingly use X-ray as a critical verification step. Still, X-ray should never be oversold. It does not detect everything equally well. Low-density films, soft rubber, wood, paper, or very thin plastic may escape detection. Detection sensitivity also changes with product effect, package depth, temperature, and line speed. A frozen entrée in a black CPET tray presents different challenges than a pouch sauce, a glass jar, or a bulk protein chub. Plants should validate systems using realistic test pieces and worst-case product conditions rather than generic vendor assumptions. From a technology standpoint, the most effective systems are integrated into the line layout instead of being added as an afterthought. This is where a strong engineering partner matters. Disruptive Process Solutions supports processors with process engineering, controls integration, and capital planning that help align inspection technology with actual throughput, utilities, and operating constraints. For manufacturers expanding lines in states such as North Carolina, Texas, Wisconsin, or California, proper placement of X-ray units can reduce false rejects, improve access for sanitation, and protect downstream packaging efficiency. Plants should also distinguish between foreign body identification and simple rejection. If a line experiences repeat contaminants, the system should feed root-cause investigation. Image logging, reject confirmation, event coding, and trend analysis can reveal whether the source is upstream ingredient contamination, wear in a depositor, a damaged screen, or packaging line breakage. That information is what turns a detector from a reactive device into a preventive management tool. This comparison matters because equipment selection should match product physics. A plant that buys an X-ray machine without considering aperture, software, reject design, sanitation access, and package geometry often ends up with poor sensitivity or excessive false rejects. Metal detection remains a foundational control because it is versatile, widely understood, and often less costly than X-ray. It is especially useful for detecting ferrous, non-ferrous, and stainless steel contaminants in dry goods, bakery, snacks, meats, dairy, and packaged foods. However, good performance depends on aperture size, product effect, environmental conditions, and disciplined testing. The strongest U.S. plants challenge their systems at start-up, at regular intervals during production, at changeover, and at shift end using certified test pieces in realistic product carriers. Calibration is not just a technical formality. It is a management discipline that proves the detector is working under actual operating conditions. Wet products, salty products, hot products, and metallized packaging all complicate sensitivity. A detector that performs well on one SKU may fail on another. That is why leading plants maintain product-specific settings, documented challenge protocols, reject verification checks, and escalation rules whenever a test fails. The engineering side also matters. Poor conveyor stability, vibration, electrical noise, bad grounding, or cramped line layout can degrade detector performance. Processors planning new installations or line retrofits often benefit from working with firms that understand both process and controls. DPS provides structural, mechanical, electrical, process, and automation support, including PLC and SCADA integration, which helps inspection equipment communicate clearly with upstream and downstream devices. For plants adding metal detection to high-speed conveyance or washdown environments, this type of systems thinking helps prevent nuisance rejects and control downtime. In categories like seasonings, flour, snack inclusions, frozen vegetables, and ground meat, metal detection may be used in several places: after grinding, after screening, before packaging, or on final packaged product. Multi-point detection improves control but only if plants understand what each point is expected to catch. This table shows why a detector is only as strong as the program surrounding it. Calibration, challenge standards, reject confirmation, and documentation are what make the control defensible during audits and effective during real production. Visual inspection still plays a major role in foreign material control, especially for hazards that are difficult for machines to detect, such as low-density plastic, paper, wood, color changes, container defects, and setup errors. Human observation is important at receiving, pre-op, changeovers, packaging material staging, and rework handling. Yet visual programs fail when expectations are vague or when people are overloaded. Plants should define what operators are looking for, where they should look, and what they should do when they find something. A workstation where employees inspect open product for fragments should have lighting standards, line speed limits, contrast backgrounds, reject containers, and documented hold procedures. In U.S. labor markets with high turnover, relying on tribal knowledge is risky. Standard work instructions, image boards, and bilingual training often improve consistency more than adding another sign-off sheet. Human error controls also include practical design choices. Clear bins prevent accidental mixing. Shadow boards reduce missing tools. One-piece pens, detectable utensils, and controlled blade programs lower contamination risk. Packaging line checks should confirm that no loose labels, cut film tails, broken guides, or fragmented cap parts are entering product zones. For plants near logistics hubs like Memphis, Indianapolis, and Atlanta, where high-volume e-commerce and retail replenishment put pressure on speed, these simple controls can be the difference between a near miss and a market withdrawal. A good visual inspection system is measurable. Plants can track findings per shift, repeat causes, reaction time, and effectiveness by area. If one line repeatedly finds blue plastic, that should trigger deeper investigation into scraper wear, scoop condition, or packaging material handling rather than repetitive operator reminders. Many foreign material events start before ingredients ever reach the plant. Spices may contain stones, produce may carry field debris, meat trim may include bone, and dry ingredients may arrive with bag fragments, pallet splinters, or transport contamination. That is why incoming material controls are one of the most effective prevention strategies in the United States market. A plant with strong supplier management can reduce downstream inspection burden and lower customer complaint risk. Supplier controls should include approval criteria, hazard history review, specification alignment, audit or questionnaire review, and verification testing where justified. For imported ingredients entering through ports such as Los Angeles/Long Beach, Savannah, or Newark, extra attention may be needed around transit damage, repacking, and lot traceability. For domestic suppliers in produce-heavy states like California, Arizona, Washington, and Florida, seasonal shifts may change the risk profile of stems, pits, stones, or other field-related contamination. Incoming inspections should be intelligent rather than merely routine. High-risk ingredients may need sieves, magnets, destoners, or X-ray verification before use. Packaging materials should be checked for brittle plastic damage, loose staples, splintered pallets, and liner integrity. Plants should also define action thresholds: when to reject, when to hold for quality review, and when to increase monitoring frequency. Companies planning line expansions or new ingredient systems often need more than a purchasing checklist. They need material handling systems designed for cleaner transfer, screening, and storage. Through its process and manufacturing capabilities, DPS designs and integrates receiving, batching, mixing, pumping, filtration, and utility systems for food and beverage facilities across North America. This matters because well-designed ingredient handling reduces opportunities for contamination during unloading, dumping, conveyance, and rework. This table is useful because it ties each material type to a practical receiving strategy. Plants should focus resources where the contamination history and business impact are highest. Glass and brittle plastic management is one of the clearest foreign material disciplines because the rules can be documented and verified. Every plant should maintain a register of glass and brittle plastic items, identify where they are located, evaluate their proximity to exposed product, and inspect them on a defined schedule. Common examples include light covers, sight glasses, gauge faces, touch screens, windows, and instrument housings. High-performing sites use engineering controls first. They replace unnecessary glass, shield exposed fixtures, and redesign traffic or forklift patterns where breakage is likely. If the plant handles hot-fill, carbonated beverages, dairy, or acids, material selection matters because some plastics become brittle more quickly in harsh washdown or thermal environments. Facilities running older assets should pay close attention to yellowed guards, cracked indicator covers, and legacy instrument housings that can fracture under routine use. A documented breakage procedure is essential. It should define immediate stop actions, product hold zones, cleanup tools, inspection and release authority, sanitation verification, and disposal of exposed product. The goal is not only to clean up visible fragments, but to prevent questionable product from moving downstream because of production pressure. For processors undertaking plant upgrades, material choices can dramatically reduce future risk. DPS supports capital projects that include sanitary design, utility integration, equipment selection, and facility modifications; those decisions often influence whether inspection points remain accessible and whether brittle components are kept out of critical zones. Manufacturers looking at new vessels, custom CIP systems, or other process hardware can review equipment capabilities here to better align design decisions with food safety and maintainability. Maintenance activity is a frequent but underappreciated source of foreign material. Loose fasteners, weld slag, insulation fragments, gasket pieces, broken drill bits, temporary repairs, and forgotten tools can all enter product streams during line work. The risk rises during emergency repairs, contractor projects, and overnight maintenance windows where speed is prioritized over line clearance discipline. The best maintenance procedures separate food-safe execution from general mechanical work. That means pre-job review, parts accountability, protected product zones, controlled lubrication, tool shadowing, magnet sweeps where appropriate, and line clearance sign-off before restart. Temporary fixes such as tape, wire, cardboard shims, or loose wraps should be prohibited in product-contact and product-exposure zones. If a screen breaks, a blade chips, or a fastener goes missing, product disposition rules must be immediate and clear. Tool control deserves special emphasis. Shadow boards and serialized kits reduce the chance of lost tools. Breakaway knife policies, controlled blade issuance, and count reconciliation at shift end prevent a very common contamination pathway. Contractors should be held to the same standards as plant employees. This is especially important in U.S. plants executing expansions, utility upgrades, or equipment relocations while production continues in adjacent areas. DPS often supports processors in complex project environments where installation, integration, and production readiness must coexist. Its design-build-manage approach helps coordinate engineering, construction, local trades, and startup oversight so line changes do not create avoidable food safety exposure. For manufacturers planning equipment moves, utility reroutes, or capacity upgrades, disciplined project execution can be just as important as the hardware itself. This table helps plants convert general maintenance expectations into point-of-use controls. The practical detail is what prevents “we thought someone checked it” failures. Even the best detection technology will not compensate for a weak reporting culture. Employees are often the first to notice a cracked scraper, a missing bolt, a broken pallet board, unusual detector rejects, or a supplier issue. If they hesitate to report because they fear blame or production delay, the foreign material program is fragile. Training should explain not only the rules but the reasons behind them. Employees need to know what counts as foreign material, which items are especially dangerous, how to hold suspect product, when to stop the line, and who must be notified. Short, repeated training tied to real plant examples tends to work better than annual classroom sessions alone. Visual aids, multilingual instruction, and area-specific drills are especially useful in large U.S. facilities with diverse workforces. Reporting culture also depends on leadership behavior. When supervisors thank employees for raising concerns and act quickly on near misses, reporting increases. When the response is dismissive or punitive, issues stay hidden. Many successful plants track near misses, not just confirmed contamination. That gives them more data for prevention and helps shift the culture from “avoid blame” to “protect the brand and the customer.” By 2026, this area will likely become even more data-driven. Plants are adopting digital maintenance logs, smart inspections, image capture at CCPs, and mobile incident workflows that speed escalation and trend analysis. Sustainability goals are also influencing the conversation: preventing contamination reduces waste, rework, packaging loss, and recall-related disposal. Regulatory and customer scrutiny around preventive controls, traceability, and documented verification is expected to tighten, especially for high-risk and ready-to-eat categories. Disruptive Process Solutions serves food and beverage manufacturers across the United States and Canada with a practical, profit-focused engineering model. Rather than operating as a conventional contractor, the company works at the intersection of capital planning, process design, installation, integration, and execution management. That matters for foreign material control because prevention is rarely solved by one machine purchase. It often requires better line layout, more sanitary utility routing, stronger automation logic, improved receiving design, or a cleaner equipment changeover strategy. On the technology side, DPS brings process, controls, electrical, mechanical, plumbing, and structural engineering together with PLC programming and SCADA integration. That makes it well suited for projects where inspection systems must communicate with conveyors, fillers, reject devices, batching controls, or plantwide monitoring. On the manufacturing side, the company supports processing environments ranging from beverage systems and aseptic applications to protein, dairy, prepared foods, and ingredient operations, while also offering proprietary equipment such as tanks, CIP systems, tumblers, and cooking vessels. On the service side, DPS supports capital planning, feasibility work, owner’s representation, project and program management, general contracting where licensed, equipment supply, and turnkey installation and integration. For manufacturers evaluating line upgrades, new builds, or contamination-risk reduction projects, that breadth is useful because food safety controls work best when the process, equipment, building systems, and business case are aligned from the start. You can learn more about the company’s background and operating approach, explore its broader service capabilities, and review selected project examples and case stories relevant to complex manufacturing environments. A practical buying lesson for U.S. plants is this: choose partners who can challenge assumptions. If a facility needs to reduce foreign material risk, the right answer may be a detector, but it may also be an upstream screen, a redesigned transfer point, a better maintenance access platform, or revised automation sequencing. The most valuable partner is one that protects long-term operating performance, not just project spend. What foreign materials are most common in U.S. food plants?Metal, hard plastic, glass, stones, wood, rubber, bone, and packaging fragments are among the most common. The mix depends on the product category and the age and design of the facility. Is X-ray better than metal detection?Neither is universally better. X-ray detects a broader range of dense contaminants, while metal detection is highly effective for metal and often more cost-efficient. Many plants use both at different control points. How often should metal detectors be checked?Frequency should be risk-based, but many U.S. plants test at startup, during the run at defined intervals, at product changeover, and at the end of production. The key is consistent challenge testing with documented response to failures. Can visual inspection replace automated detection?No. Visual inspection is valuable, but it should support, not replace, validated machine detection where the hazard profile justifies technology. Human inspection is strongest when tasks are limited, clear, and measurable. What is the first step in improving supplier control?Start by ranking ingredients and packaging by contamination risk, complaint history, and business impact. Then tighten specifications, receiving checks, and verification for the highest-risk materials first. Why are glass and brittle plastic registers important?They create visibility. Without a register, plants often miss hidden risk points such as gauge covers, sight glasses, and indicator housings. A register supports routine inspections and a more effective breakage response. How do maintenance teams reduce contamination risk?Use controlled parts trays, shadow boards, line-clearance checks, approved materials, and documented restart inspections. Emergency repairs should follow the same discipline as scheduled work. What industries need the strictest foreign material controls?Ready-to-eat foods, dairy, beverages, infant-related products, aseptic foods, protein processing, and contract manufacturing usually require especially strong controls because of consumer exposure and customer expectations. What U.S. market trends should plants watch through 2026?Expect more investment in data-linked inspection systems, stronger traceability expectations, wider use of automation and image capture, more emphasis on sustainability through waste reduction, and tighter customer requirements around preventive control verification. When should a plant bring in an engineering partner?Bring one in when contamination risk is linked to layout, line speed, utility routing, sanitation access, equipment wear, or expansion planning. A technical partner can often solve the root cause upstream instead of adding reactive inspection only at the end. -
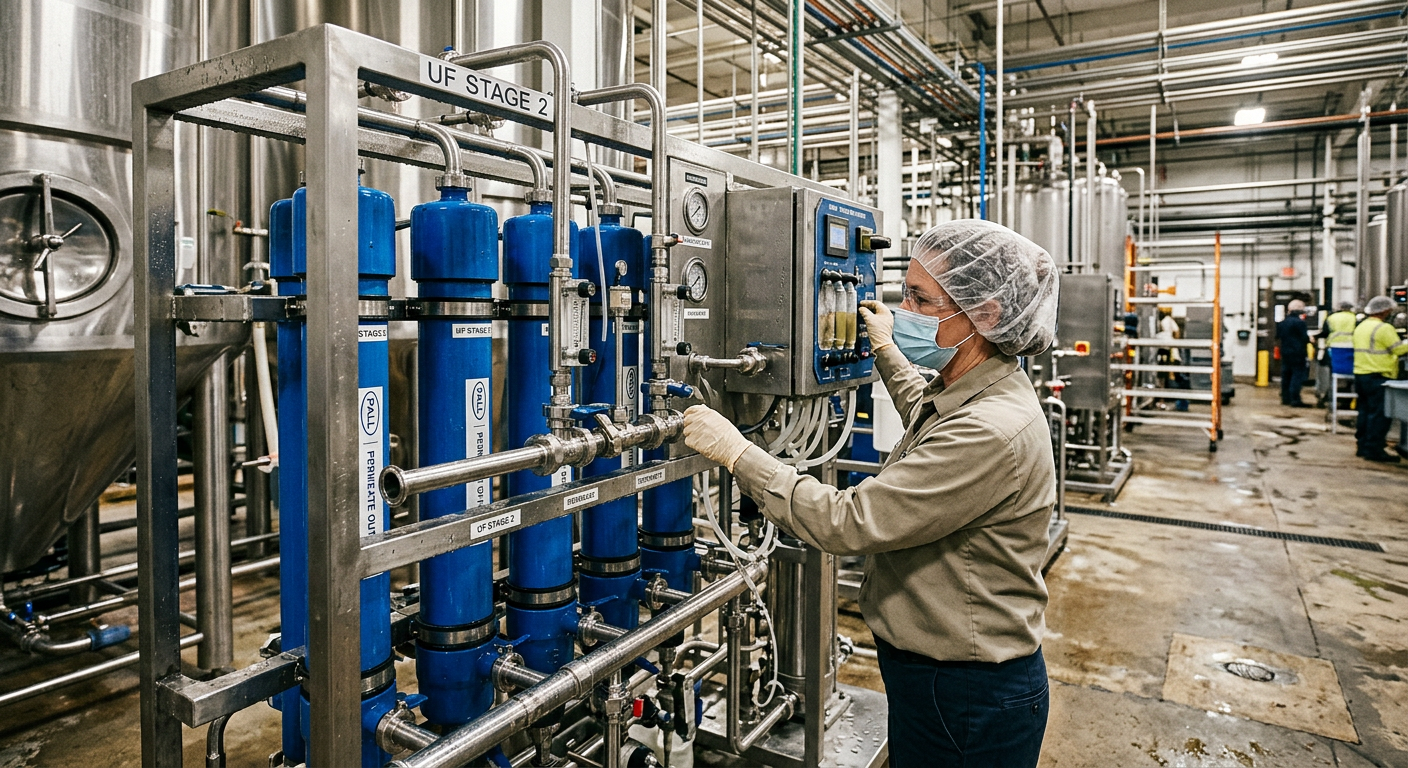
2026 Food Facility Chemical Control Program Essentials
Food and beverage plants in the United States cannot treat chemical control as a secondary sanitation issue. In 2026, regulators, customers, insurers, and audit schemes increasingly expect a documented chemical control program that covers safety data sheets, hazard classification, storage, labeling, personal protective equipment, spill response, and worker competency. A strong program protects employees, prevents cross-contamination, reduces downtime, and supports compliance with OSHA Hazard Communication requirements, EPA expectations, FDA preventive controls, USDA inspection environments, and major third-party food safety schemes. For facilities producing dairy, ready-to-drink beverages, sauces, meat and poultry, aseptic products, brewery outputs, plant-based foods, or shelf-stable packaged goods, the same principle applies: every chemical entering the site must be identified, approved, stored, handled, and documented according to risk. Whether the plant is operating near the Port of Los Angeles, serving distribution lanes around Chicago, running a protein facility in Texas, or managing export production from Georgia or New Jersey, chemical control has become both an operational and commercial requirement. The fastest answer is this: a food facility chemical control program in the United States should maintain current SDS files for every chemical, classify each product by hazard and food-contact risk, store incompatible materials separately, define PPE and handling rules by task, label every container clearly, prepare written spill and emergency steps, and keep training records proving employees are competent. The best programs also control chemical purchasing, limit unauthorized substitutions, and connect sanitation, maintenance, quality, EHS, and operations in one review process. In practice, the most effective facilities build their program around ten operational checkpoints: The United States market is moving toward more digital SDS systems, smarter dosing controls, tighter sustainability reporting, and stronger segregation standards for high-risk sanitation and utility chemicals. Food plants that still rely on paper binders alone or informal storage practices are falling behind. Larger customers now ask not only whether chemicals are controlled, but whether the controls are auditable, sitewide, and integrated into capital planning. That is especially important for facilities scaling production. A small co-packer in North Carolina can often manage chemical risks with manual checks, but a multi-line beverage or protein operation near Houston, Dallas, Fresno, Milwaukee, or Philadelphia usually needs engineered storage, controlled transfer points, and better utility integration to avoid recurring safety and contamination problems. That is where process engineering and plant design decisions directly influence compliance performance. The line chart above illustrates a realistic market trend: U.S. food and beverage plants are steadily increasing formal chemical control adoption as insurance pressure, labor safety expectations, audit scrutiny, and automation investments rise. SDS management is the backbone of chemical control. If employees cannot quickly locate the right safety information, a written chemical program is only partial compliance. In U.S. facilities, SDS access must be practical, immediate, and understandable for the people who use or may be exposed to the product. That includes sanitation crews, operators, mechanics, warehouse staff, quality personnel, and emergency responders inside the plant. At minimum, each chemical should have one current SDS from the manufacturer or distributor, reviewed when the product is first approved and again when the supplier revises the document. Plants commonly fail here when they purchase from multiple distributors, allow emergency substitutions, or keep old binders that no one updates. A good standard is to maintain: For multi-building operations, one central SDS system is better than separate departmental files. A sanitation leader in Kansas City, a maintenance supervisor in Charlotte, and a quality manager in Sacramento should all be working from the same controlled source. This matters even more in facilities that use acids, caustics, lubricants, water treatment chemicals, boiler treatments, glycol additives, CO2 cleaning products, and specialty aseptic sanitizers across different departments. Buying advice for U.S. plants: select chemical vendors that provide machine-readable SDS updates, technical support, and clear use limitations for food environments. Avoid vendors that cannot quickly document formulation changes, concentration bands, or compatibility limits. When evaluating suppliers around major industrial hubs such as Chicago, Houston, Atlanta, Southern California, or the Northeast corridor, ask whether they support digital integration, emergency response guidance, and bilingual training materials where needed. This table shows that SDS management is not just filing paperwork. It is a living control system that supports emergency response, training, purchasing discipline, and audit readiness. A food facility should classify chemicals according to more than the label’s signal word. Real risk assessment combines several factors: physical hazards such as flammability or reactivity, health hazards such as skin burns or respiratory irritation, environmental concerns, and food exposure potential. A floor cleaner stored in the wrong place may create lower worker risk than a mislabeled allergen-sensitive sanitizer bucket near open product, yet the latter may create greater business risk. Effective U.S. programs typically divide chemicals into operational groups such as: Each product then needs a site-specific classification. For example, an acid may be routine in a CIP circuit but high risk when manually diluted in a cramped satellite room. A food-grade lubricant may be lower contamination risk than a non-food-grade grease, but both still require storage and labeling controls. A warehouse bleach tote at a dairy plant in Wisconsin has different exposure implications than a small sanitizer drum in a dry snack plant in Arizona. Facilities should also rank chemicals by application. High-priority oversight is generally needed for products used near open food, in aseptic or high-care zones, around compressed air or water systems that could affect product contact, or in operations with seasonal labor turnover. This is where engineering layout, traffic flow, utility routing, and containment design materially affect risk. This classification table helps teams prioritize where engineering controls, restricted access, and training effort should be concentrated first. The bar chart reflects realistic U.S. demand intensity by industry. Aseptic, protein, and dairy environments usually require tighter chemical discipline because sanitation sensitivity, regulatory scrutiny, and contamination consequences are more severe. Storage is where many food plants unintentionally create their biggest chemical risk. A compliant purchase can become a noncompliant condition the moment incompatible materials are stacked together, unlidded, placed above ingredients, or stored in an uncontrolled corridor. Secure storage means more than locking a room. It means designing a physical and administrative system that prevents reaction, spill spread, unauthorized access, and accidental food contact. At a minimum, U.S. food facilities should segregate acids from caustics, oxidizers from organics or combustibles, maintenance chemicals from sanitation products where confusion is possible, and non-food-grade materials from food-contact support materials. Secondary containment should match the chemical family and storage volume. Floors should resist corrosion, drains should be evaluated carefully, and ventilation should suit the products present. Plants near ports or major freight routes such as Long Beach, Savannah, Houston, Newark, or Memphis often experience variable chemical lead times. That can tempt facilities to overstock. Overstocking increases expiration, leakage, and space misuse. A better approach is controlled par levels with supplier coordination, especially for sites with temperature-sensitive products or limited dedicated storage. Local suppliers are valuable when they can provide reliable replenishment, emergency deliveries, compatible transfer equipment, and technical support—not just low unit price. Case experience across U.S. food operations shows that poorly planned expansions often place sanitation drums, lubrication cabinets, and utility chemicals into whatever space is available. That is why storage should be reviewed during line additions, utility upgrades, and plant retrofits, not only after an incident. This table provides a practical segregation reference. The goal is not only regulatory compliance, but prevention of confusion and process interruptions. PPE requirements should be written by task, not by department alone. A mechanic changing a lubricant, a sanitation employee diluting acid, and an operator swapping a sanitizer container are all handling chemicals differently. U.S. plants should align PPE with the SDS, the exposure route, concentration, transfer method, and work environment. Generic statements such as “wear gloves and goggles” are usually too weak for training and enforcement. Safe handling procedures should answer the specific questions employees face on shift: Product types in U.S. food plants vary widely, so one PPE matrix rarely fits all. Breweries and beverage sites may focus on caustic CIP, peracetic acid, and CO2-adjacent cleaning. Protein plants often deal with heavy sanitation chemistry, foam systems, and compressed washdown practices. Dairy plants face descaling chemicals, allergen-sensitive cleaning validation, and frequent CIP turnover. Aseptic plants need especially disciplined controls because small handling errors can create disproportionate production risk. This table works well as the basis for posted work instructions and refresher training. Every container must tell the truth about what is inside. That includes original packages, transfer bottles, spray containers, line-side buckets, totes, and temporary vessels. In U.S. food facilities, labeling failures are among the easiest audit findings to prevent and among the most common. The reasons are simple: containers get refilled, labels get wet, shift teams improvise, and color coding is used without written backup. A reliable labeling protocol should require the product name, major hazard warning, dilution status if applicable, and traceability to the approved chemical list. Secondary containers should never rely on employee memory or cap color alone. If a facility uses multilingual teams, labels and training aids should support actual workforce comprehension. That is especially important in high-turnover regions and large manufacturing corridors such as California’s Central Valley, South Texas, Florida, and the Carolinas. Technology is improving this area quickly. In 2026, many sites are moving to durable printed labels, QR-linked SDS access, and controlled issue systems that only allow approved products to be dispensed into site-coded containers. Sustainability trends are also influencing packaging choices, with more facilities trying to reduce disposable secondary containers while keeping labeling integrity intact. The explanation behind this table is straightforward: good labels prevent misuse, support quick response, and help separate food-safe intent from unsafe improvisation. Spill response procedures should be written according to chemical type, likely volume, location, and escalation threshold. A small sanitizer drip at a packaging line does not require the same response as a damaged acid drum in a CIP room or a leaking water treatment tote in an exterior utility yard. Facilities need simple instructions for first response and clear triggers for when to isolate the area and call specialized help. A good spill plan typically identifies: Applications matter. In beverage facilities, line-side spills may affect packaging materials and floor safety. In protein operations, sanitation chemical release can quickly spread across wet environments. In dry food plants, misuse of oxidizers or cleaners can create airborne or residue concerns that differ from wet processing sites. Near freezing operations or refrigerated spaces, response materials and visibility may be compromised. These details should be built into drills. Future U.S. trends point toward connected sensors in chemical rooms, leak detection under bulk storage, closed-loop dispensing, and tighter stormwater protections for exterior storage. As sustainability expectations rise, companies will be judged not only on worker response but also on environmental containment and waste minimization after an incident. The area chart shows the ongoing shift from manual, paper-heavy systems to digital and semi-automated chemical control in U.S. food manufacturing. This trend is accelerating as labor remains tight and audit pressure increases. Training records are often the difference between a program that looks good on paper and one that can be defended after an incident. U.S. facilities should document who was trained, on what content, when, by whom, and how competency was verified. Attendance alone is not enough. Plants should confirm that workers can identify hazards, find the SDS, select the right PPE, label containers correctly, and respond appropriately to a spill or exposure event. Competency verification can include observation, verbal questioning, practical demonstrations, short quizzes, or signoff during supervised tasks. Refresher training should be triggered not only by annual schedule but also by chemical changes, procedure changes, incidents, near misses, staffing changes, or equipment additions. In fast-growing plants, especially those adding new syrup rooms, utility systems, retort lines, fermentation assets, or CIP skids, this becomes critical. Case studies across the U.S. repeatedly show the same pattern: facilities invest in sanitation chemistry but underinvest in operator understanding. One site may have excellent products but poor transfer discipline. Another may have a good spill kit but no one who knows when to escalate. The best plants make chemical control part of onboarding, shift leadership, and capital commissioning. This table clarifies that training documentation should demonstrate capability, not just attendance. This comparison chart supports buying decisions. In the United States, the best chemical suppliers for food facilities are rarely the ones competing on price alone. Technical depth, documentation quality, and compatibility with automated dispensing often create more value. Disruptive Process Solutions supports food and beverage manufacturers across the United States and Canada with engineering-led project execution that connects compliance needs to profitable plant performance. Rather than treating chemical control as a standalone safety topic, DPS approaches it as part of a broader manufacturing system that includes process design, utilities, sanitation strategy, storage layout, automation, and practical project delivery. From a technological capability standpoint, DPS works across structural, mechanical, plumbing, electrical, process, and controls disciplines. That includes PLC programming, automation, SCADA integration, utility system design, process water systems, CIP infrastructure, thermal processing environments, fermentation systems, aseptic applications, and complete processing support architecture. For facilities that need stronger chemical control, those technical capabilities matter because SDS access, dosing reliability, storage conditions, alarm visibility, and operator workflows all depend on how the plant is engineered. More about these integrated solutions can be found through food and beverage engineering services in the United States. From a manufacturing capability standpoint, DPS also designs and supplies selected branded equipment including tanks, custom CIP systems, marination tumblers, and cooking vessels. That practical equipment background is useful when clients need chemical-safe materials of construction, dedicated wash systems, proper transfer points, containment-minded layouts, or process upgrades that reduce manual handling. Manufacturers planning expansions, retrofits, or new utility rooms often benefit from combining equipment decisions with hazard segregation planning instead of addressing chemical control after installation. Additional details are available through process equipment solutions for food plants. From a service capability standpoint, DPS operates through a design-build-manage approach that supports capital planning, feasibility, owner’s representation, project and program management, general contracting functions, installation, and full integration. For clients in dairy, beverage, protein, prepared foods, co-packing, or aseptic processing, that means chemical rooms, sanitation systems, water treatment assets, and utility upgrades can be planned as part of the business case, not as late-stage corrections. For companies evaluating fit, background, and project philosophy, visit the DPS company overview. Real project context and execution examples are also available through recent food and beverage project case studies. A useful example of this philosophy in chemical control is when a plant expansion appears to need expensive added capacity, but a closer engineering review shows the root problem is control logic, transfer workflow, or utility bottlenecks. In those cases, the smartest investment may be reprogramming, redesigning, or reconfiguring rather than overspending on unnecessary hardware. That business-minded approach is especially valuable for U.S. manufacturers trying to scale quickly without carrying preventable safety and sanitation risk into the next phase of operations. What chemicals should be included in a food facility chemical control program?All chemicals on site should be included: cleaners, sanitizers, lubricants, maintenance products, boiler and cooling chemicals, water treatment products, lab reagents, pest control materials, and any temporary or trial products. Is a paper SDS binder enough in the United States?A paper binder may help, but on its own it is usually not the strongest solution. Most facilities benefit from a digital SDS system with current versions, searchability, and backup access during outages. How often should chemical training be refreshed?At least annually in many facilities, but also whenever a new product, new task, incident, process change, or new equipment affects chemical handling. Can food-grade lubricants be stored with other maintenance chemicals?They should be controlled separately enough to avoid confusion, misuse, or cross-selection. Dedicated cabinets, clear codes, and limited access are preferred. What is the most common labeling mistake?Unlabeled or partially labeled secondary containers. Spray bottles and temporary transfer containers are frequent problem areas. Do exterior chemical storage areas need the same attention as interior rooms?Yes. Exterior totes and utility chemicals may create additional weather, stormwater, and containment risks, especially in Gulf Coast and coastal port regions. How should a plant choose local suppliers?Evaluate response time, technical support, SDS update quality, emergency guidance, packaging options, food industry experience, and ability to support the facility’s specific processes and locations. What are the main 2026 trends in chemical control?Digital SDS management, automated dispensing, leak detection, stronger segregation design, sustainability pressure around chemical usage and packaging, and tighter integration between EHS, food safety, and capital engineering. Does chemical control affect audit outcomes even if no incident occurred?Absolutely. Auditors often review SDS access, labels, storage, training, and spill readiness as indicators of overall plant control and preventive culture. When should engineering support be involved?Whenever the facility is adding lines, modifying utilities, changing sanitation systems, increasing bulk storage, installing new CIP assets, or struggling with recurring storage and handling problems. In summary, a modern chemical control program for a U.S. food facility should be practical, site-specific, documented, and engineered into everyday operations. The plants that perform best are the ones that connect compliance, worker safety, sanitation effectiveness, and capital planning into one system. That is the standard increasingly expected across the United States in 2026. -
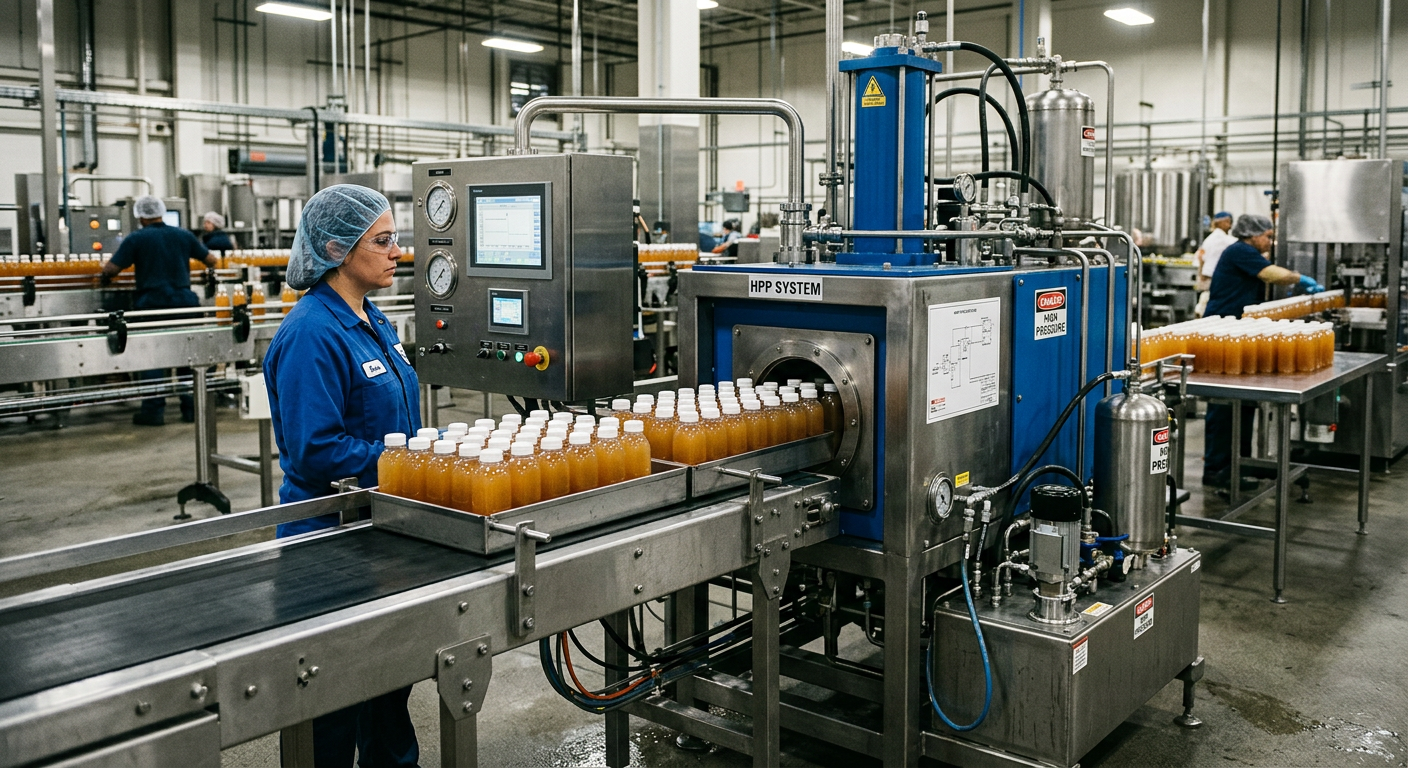
Food Processing Equipment Relocation
Relocating food processing equipment is not just a moving job. It is an engineering, compliance, sanitation, controls, utilities, and startup project that directly affects product safety, plant uptime, labor efficiency, and capital return. In the United States, successful food equipment relocation requires disciplined planning from the first equipment assessment through final commissioning, quality verification, and production ramp-up. For manufacturers moving lines between cities such as Chicago, Dallas, Los Angeles, Atlanta, Charlotte, Houston, or Toronto-linked North American networks, the biggest risk is rarely transportation alone. The real risk is losing hygienic integrity, process capability, throughput, or regulatory readiness after the equipment arrives. Disruptive Process Solutions, or DPS, supports food and beverage manufacturers across North America with a design-build-manage approach that connects engineering, installation, utility integration, controls, and startup under one accountable team. That matters when a relocation includes pasteurizers, retorts, fillers, conveyors, blending skids, cooking systems, CIP loops, compressed air, steam, refrigeration, and SCADA integration. Whether the project involves a plant consolidation in the Midwest, a line transfer from California to Texas, or a capacity expansion near the Port of Savannah or the Inland Empire logistics corridor, the relocation strategy must protect production continuity and future profitability. Food processing equipment relocation in the United States should be handled as a turnkey capital project rather than a simple rigging task. The best outcomes come from combining pre-move condition assessment, utility mapping, controlled electrical and controls disconnection, sanitary packaging for transport, qualified reinstallation, precision alignment, calibration, HACCP and preventive controls review, and final startup documentation. This approach reduces contamination risk, startup delays, hidden repair costs, and compliance gaps. If you are moving a single machine or an entire processing line, the practical sequence is straightforward: For plants operating under FDA, USDA, SQF, BRC, or customer-specific audit requirements, relocation should also include documented startup protocols, maintenance baseline checks, spare parts planning, and training for operations and sanitation teams. The table above shows why relocation is a staged process. Every phase has a different owner, a different failure mode, and a direct effect on production readiness. Food manufacturers in the United States relocate a wide range of assets, from stand-alone vessels to complete integrated process systems. Some moves are part of mergers or plant consolidation programs. Others happen when a producer outgrows an older facility, adds co-packing capacity, or repurposes idle equipment from one region to another. In high-cost markets such as Southern California, New Jersey, and the Pacific Northwest, it is common to relocate selected equipment to lower-cost production hubs in Texas, the Carolinas, Tennessee, or the Midwest. DPS supports moves involving both food and beverage assets, with technological capabilities that extend across thermal processing, aseptic systems, dairy, protein, sauce, ingredient, beverage, and packaging operations. This includes utility-heavy systems such as steam, chilled water, glycol, compressed air, water treatment, and CIP, along with automation layers like PLCs, SCADA, recipe management, and batch controls. This table matters because not all assets carry the same relocation risk. A conveyor move is usually simpler than a retort move, and a pasteurizer or aseptic filler requires far more documentation, validation, and utility coordination than a stand-alone tank. In many projects, equipment is only part of the scope. The move also involves structural modifications, drains, trenching, utility rack rerouting, controls cabinet relocation, chilled water balancing, compressed air quality checks, and plant layout redesign. That is where a partner with broad food engineering and installation services becomes more valuable than a basic hauling contractor. From a market perspective, the U.S. relocation environment remains active because manufacturers are rebalancing supply chains near major interstate corridors, rail hubs, and ports such as Houston, Long Beach, Newark, Savannah, and Charleston. Plants serving grocery, club, foodservice, and private label channels often choose relocation when lead times for new equipment are too long or when redeploying existing assets produces a faster payback. The growth trend above reflects the practical reality of the market: more manufacturers are treating relocation as a strategic capacity tool rather than a last-resort decision. Before any disconnect begins, each asset should be evaluated for structural condition, sanitary design suitability, spare parts availability, code fit, and startup risk. A common mistake is assuming that because equipment runs today, it is worth relocating tomorrow. In reality, older frames may be corroded, obsolete PLC platforms may be unsupported, and worn valves, seals, or drives may trigger a costly restart failure. A strong assessment includes mechanical inspection, utility demand review, controls backup, process suitability review, and total cost comparison between move and replacement. For food plants, product-contact surfaces, weld quality, dead legs, drainability, gaskets, and cleanability deserve special attention. The purpose of this assessment is not only technical. It is financial. A line that costs $600,000 to relocate but only has three to five reliable years left may be a poor capital decision. DPS is known for approaching these projects like an operations-minded advisor rather than a yes-only contractor. That means recommending process changes, controls optimization, or selective replacement when those choices improve long-term profitability. In some cases, a line move also becomes an opportunity to redesign the process flow. For example, a sauce line moving from a cramped Northeast facility to a larger Tennessee or North Carolina site may gain better ingredient handling, fewer forklift crossings, improved allergen segregation, and cleaner personnel traffic patterns. Those gains often deliver more value than the move itself. Although hygienic design language is often discussed globally, U.S. manufacturers should apply FDA, USDA, SQF, BRC, and customer sanitation expectations at the destination facility. The main objective after relocation is to verify that the reinstalled equipment still meets hygienic design intent and that the CIP system can clean all product-contact surfaces effectively after piping routes, tank elevations, and loop lengths have changed. Reinstallation verification should examine slope, drainability, dead legs, gasket compression, access for inspection, weld condition, passivation status when needed, and separation from non-sanitary utilities. Even a well-moved system can fail hygiene expectations if the destination floor has poor drainage or if maintenance creates inaccessible valve clusters. CIP re-integration is especially critical when moving blending systems, tanks, heat exchangers, fillers, and transfer circuits. New routing can change flow velocity, return temperature, chemical contact time, and pump performance. A loop that cleaned effectively in California may underperform after installation in Ohio if pipe runs are longer or elevation losses are higher. This verification stage is where technological capabilities matter. DPS supports sanitary process systems that include pasteurization, aseptic processing, retort, blending, fermentation, water treatment, and complete utility integration, so hygienic performance is addressed alongside mechanical installation and controls startup rather than as an afterthought. Manufacturers considering upgrades during relocation often combine the move with CIP modernization, tank addition, new instrumentation, or replacement of hard-to-clean legacy components. Information on available process equipment solutions can help teams decide whether to re-use existing skids, supplement them with new components, or redesign the sanitary loop entirely. Electrical and controls work is one of the most underestimated parts of food equipment relocation. A machine can be mechanically simple to move yet extremely difficult to restart if cable labeling is poor, VFD parameters are lost, remote I/O mappings are undocumented, or HMI recipes are not backed up. In highly automated plants, controls failures can add weeks to startup schedules. Best practice is to assign specialized teams for lockout-tagout planning, controls backup, panel isolation, instrumentation tagging, cable management, and re-energization procedures. This is especially important for integrated packaging lines, batching systems, and plants with networked SCADA layers. Transportation itself should be engineered around sanitary and mechanical protection. Stainless surfaces need proper wrapping, instruments need shock protection, and rotating equipment often requires stabilization. Cross-country moves between hubs such as Chicago and Phoenix, or Seattle and Dallas, may also require climate-aware packaging and route planning. The bar chart highlights which sectors tend to generate strong relocation activity. Beverage, protein, and dairy projects often lead because their equipment carries high capital value and can justify carefully managed redeployment. From a service standpoint, DPS executes projects through coordinated engineering, installation, and integration management. That includes process, mechanical, plumbing, electrical, structural, and controls coordination, plus management of local trades when jurisdictions require regional execution support. This model reduces handoff losses between electrical contractors, riggers, programmers, and utilities installers. Manufacturers should also think about insurance, route constraints, and loading conditions. Equipment moved through the Port of Houston, New Jersey logistics corridors, or West Coast intermodal networks may face different lead times, permitting needs, and rigging sequences than short-haul interstate moves. Once equipment is physically set, it must be restored to operating precision. This stage is often where relocation projects either recover full performance or suffer chronic problems. Misalignment can lead to premature bearing failure, leaks, poor fill accuracy, inconsistent cook times, packaging jams, inaccurate temperature control, and weak OEE. Precision restoration includes laser alignment, leveling, anchor verification, chain and belt tensioning, valve stroke checks, flowmeter verification, pressure transmitter calibration, load cell testing, recipe confirmation, and motion synchronization across line segments. For thermal equipment, temperature sensors and control loops should be checked before any process challenge test begins. The explanation here is simple: even if equipment survives transport perfectly, small geometric or instrument errors can reduce capacity and quality. In food manufacturing, those issues quickly become waste, customer complaints, or sanitation downtime. Relocation also creates a prime opportunity for modernization. Many U.S. plants use the move to update sensors, replace old HMIs, install more reliable drives, improve data capture, and refine automation logic. That approach aligns with 2026 trends: smarter diagnostics, digital maintenance dashboards, energy monitoring, and easier integration with enterprise systems. After reinstallation, food safety controls must be revalidated in the context of the new facility. The equipment may be the same, but the hazards can change because of new traffic patterns, utility conditions, zoning, water quality, environmental loads, or line speeds. For plants operating with HACCP, HARPC, preventive controls, USDA plans, or customer standards, relocation should trigger a documented review of critical control points and prerequisite programs. Examples include rechecking pasteurization hold times, retort parameters, allergen segregation procedures, metal detection or X-ray performance, sanitation verification, compressed air quality, and environmental monitoring plans. A destination facility in humid Gulf Coast conditions may need different condensation control strategies than a dry Mountain West plant. A protein line moved into a mixed-product facility may require stronger zoning and sanitation barriers than before. The area chart illustrates a major trend: manufacturers increasingly prefer validated relocations that include startup proof, sanitation review, and documentation rather than simple mechanical set-and-leave work. Case experience across North America shows that revalidation is one of the strongest predictors of a smooth commercial restart. A project may appear complete when the line runs water, but production success depends on proving that the process still delivers safe product at target speed, quality, and yield. DPS has built a reputation for integrating process engineering with startup execution, especially in regulated environments where FDA, USDA, SQF, and BRC expectations must be addressed together. Real-world examples of project execution philosophy and outcomes can be seen through selected food and beverage case studies, where business value and technical performance are both part of the result. In the United States, re-approval after relocation generally involves facility permits, utility reviews, inspection readiness, pressure vessel considerations, electrical compliance, process documentation updates, and food safety record revisions rather than a single “Factory Act” process. The principle remains the same: relocated equipment must be documented well enough for internal approval, authority review, insurer expectations, and third-party audits. Documentation should cover as-built layouts, P&IDs, electrical one-lines, I/O lists, panel schedules, controls backups, calibration records, commissioning reports, sanitation verification, SOP updates, and training records. If the move involves boilers, pressure systems, ammonia or refrigerant connections, or structural changes, additional local and state documentation may apply. Plants in jurisdictions such as California, Texas, Illinois, North Carolina, Georgia, and New York may encounter different combinations of electrical, building, fire, wastewater, and environmental review requirements. That is why local coordination matters, especially when relocating equipment into older facilities with legacy infrastructure. The explanation is practical: the more complete the documentation package, the faster the destination facility can move from installation to dependable routine production. Food equipment relocation often fails at the handoffs. The rigger says the electrician will tag it. The electrician says the controls team has the backups. The mechanical installer says sanitation verification is outside scope. The plant then loses days or weeks sorting out gaps. A single-point turnkey model avoids that fragmentation. With one accountable lead, equipment assessment, engineering, scheduling, utility design, controls backup, transport coordination, reinstallation, startup, and documentation are managed as one system. That reduces scope disputes and makes schedule recovery easier when field conditions change. DPS is structured for this kind of execution. Its service capabilities include engineering, project and program management, owner’s representation, general contracting or GC-equivalent coordination, physical installation, utility integration, controls work, and commissioning. Its manufacturing capabilities add value because the company can supply selected proprietary assets such as tanks, CIP systems, tumblers, and cooking vessels when a relocation reveals gaps or when replacement is smarter than repair. More about the team and its operating philosophy is available on the company overview page. For buyers comparing options, the smartest evaluation criteria are not just move price. Look at total downtime, startup guarantee approach, utility integration experience, food safety understanding, controls depth, documentation standards, and willingness to challenge weak assumptions. The lowest bid can become the highest-cost outcome if the line misses launch dates or operates below planned throughput. In the U.S. market, this advantage is especially visible in multi-line relocations, brownfield expansions, and projects where the destination site needs new utilities, sanitary zoning updates, or process redesign. It is also important for co-packers and fast-growth brands that cannot afford extended downtime. The comparison chart reinforces what many plant leaders already know from experience: coordination quality often determines whether a relocation protects revenue or disrupts it. Looking toward 2026, three trends will shape future relocation projects in the United States. First, automation modernization will increasingly be bundled into line moves, especially where legacy PLC platforms limit capacity. Second, sustainability goals will push more companies to reuse selected equipment rather than scrap it, while upgrading motors, heat recovery, water systems, and CIP efficiency. Third, policy and customer expectations will continue to raise the bar on traceability, documentation, energy performance, hygienic design, and auditable startup records. How long does food processing equipment relocation usually take?It depends on scope. A single skid may move in days, while a full line or plant transfer can take several weeks to several months when engineering, permits, utilities, and validation are included. Is relocating used food equipment always cheaper than buying new?No. The right answer depends on asset condition, controls obsolescence, utility compatibility, sanitation upgrades, and the cost of downtime. A pre-move assessment is essential. What industries most often relocate equipment in the United States?Dairy, beverage, protein, prepared foods, sauces, ingredient manufacturing, aseptic operations, and co-packing are among the most active sectors. Can packaging lines be relocated without losing line speed?Yes, if synchronization, controls backup, mechanical alignment, sensor calibration, and trial runs are managed correctly. Line speed losses usually come from weak recommissioning, not from the move itself. What documentation should plant managers ask for?Ask for condition reports, equipment tagging, utility maps, controls backups, as-built drawings, calibration records, commissioning reports, sanitation verification, and operator training documentation. Do CIP systems need to be revalidated after a move?Yes. Any change in piping length, elevation, valve arrangement, pump performance, or utility supply can affect cleaning effectiveness. Should we upgrade controls during relocation?Often yes. A move is one of the best times to replace obsolete PLCs, HMIs, drives, and networks because the equipment is already offline and being re-integrated. What local factors matter when relocating to a new U.S. region?Labor availability, utility costs, water quality, wastewater rules, climate conditions, access to interstate routes, port proximity, and local permitting timelines all affect the success of the move. Why choose DPS for a relocation project?DPS brings together technological capabilities in process and controls engineering, manufacturing capabilities in selected sanitary equipment supply, and service capabilities spanning design, installation, integration, and startup. That combination helps food and beverage manufacturers protect schedule, compliance, and ROI under one coordinated execution model. What is the first step if we are considering a move?Start with a structured assessment of the equipment, the destination facility, utility gaps, sanitation implications, and the financial case for move versus replace. That early discipline usually creates the biggest savings. -
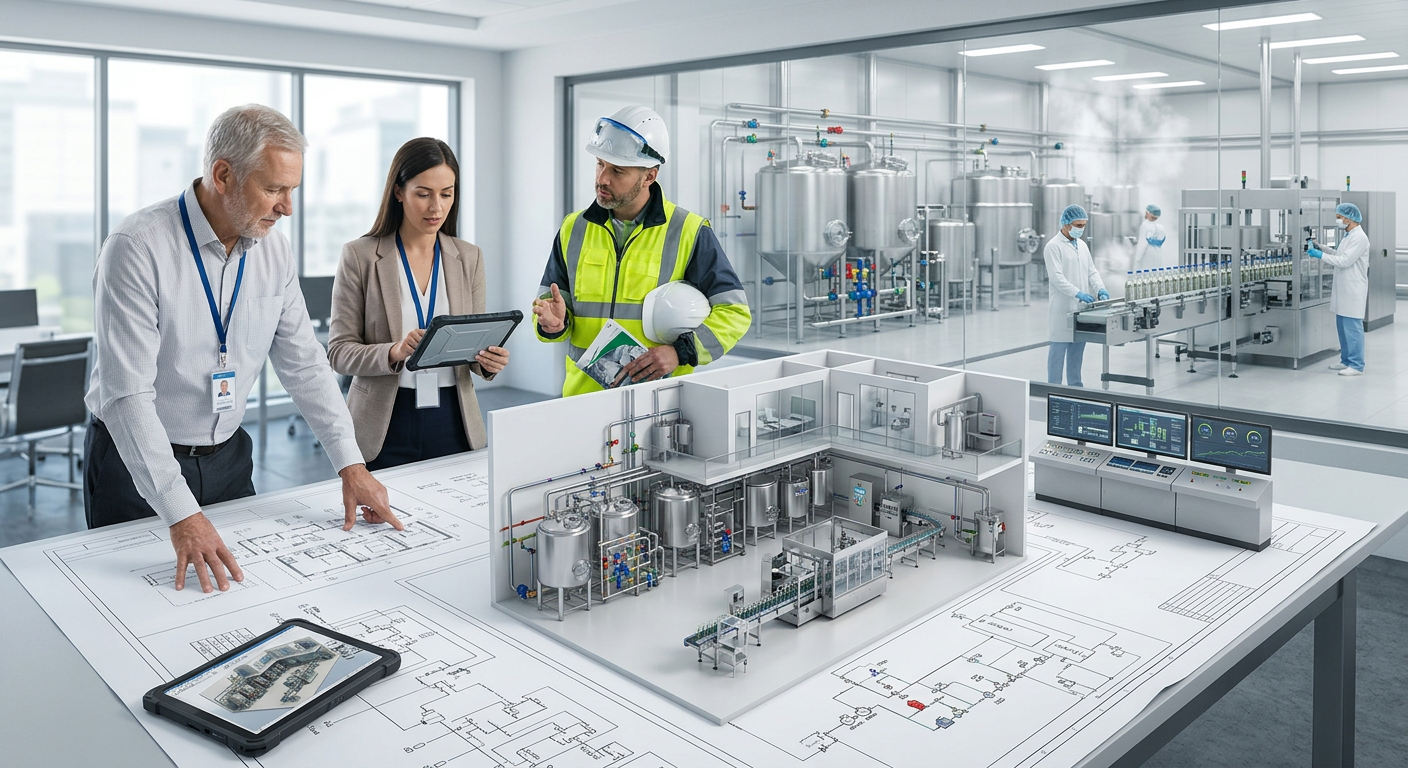
Beverage Equipment Relocation
Beverage equipment relocation is a highly technical process that goes far beyond moving stainless steel from one building to another. In the United States, beverage manufacturers must protect sanitary design, preserve utility tie-ins, document equipment condition, manage rigging risk, and restart production without compromising FDA, state, or third-party food safety expectations. For breweries, distilleries, RTD beverage plants, juice processors, dairy beverage sites, and co-packers, the best relocation projects are planned as integrated engineering and execution programs rather than simple mechanical moves. That is especially true when the equipment includes bright tanks, blend tanks, jacketed kettles, heat exchangers, carbonators, fillers, cappers, depalletizers, conveyors, labeling systems, and complete packaging lines. A successful move requires detailed preplanning, sanitary controls, utility mapping, transport engineering, reinstallation sequencing, and production validation. Companies operating in major U.S. manufacturing corridors such as Chicago, Dallas-Fort Worth, Atlanta, Charlotte, Los Angeles, the Inland Empire, Houston, Milwaukee, Denver, and New Jersey also need to account for freight routes, crane access, union jurisdiction, municipal permits, and inspection schedules. For manufacturers that need a partner with both engineering depth and field execution capability, Disruptive Process Solutions supports food and beverage capital projects across the United States and Canada with a business-first approach that aligns relocation work with long-term profitability, throughput, and compliance goals. In the United States, beverage equipment relocation usually includes shutdown planning, lockout and utility isolation, sanitary disconnection, rigging, transport, staged delivery, reassembly, controls reconnection, utility integration, startup, and production validation. The most critical success factors are protecting CIP integrity, preventing damage to filler and capper alignment, minimizing contamination risk, and restoring line speed quickly after restart. When tanks, kettles, fillers, and packaging systems are being moved, the project should be led by a team that understands beverage process engineering, sanitary piping, mechanical installation, electrical and controls integration, and regulatory expectations. A relocation partner should also know how to sequence work around production windows, especially for plants that can only shut down on weekends, during holidays, or overnight. For many U.S. beverage operations, the biggest mistake is treating a relocation like a rigging-only event. In reality, line efficiency after the move depends on pre-move laser measurement, utility verification, punch listing, startup protocols, and operator training. That is where an integrated design-build-manage mindset creates value: it reduces restart surprises, shortens downtime, and prevents hidden costs that appear after the equipment has already been set in place. The scope of beverage equipment relocation varies widely depending on whether the work involves a single vessel, a process area, or a full plant transfer. A small brewery may move only fermenters and a canning line from one leased building to another. A large co-packer may relocate blend rooms, syrup systems, UHT skids, aseptic fillers, blow molders, palletizers, and utility systems across states. Typical projects in the United States involve some combination of the following equipment categories: In practice, each equipment type has a different relocation profile. Tanks may seem simple, but oversized vessels often create route constraints, require specialized hauling, and demand careful handling of legs, jackets, insulation, and instruments. Fillers and cappers can be physically smaller than tanks but are far more sensitive in terms of throughput recovery, as very small deviations in alignment can affect seaming, torque, fill accuracy, container handling, and reject rates. Packaging systems add another layer of complexity because they often include multiple OEMs, older controls architectures, custom guarding, field modifications, and patchwork utility connections. That is why many beverage manufacturers choose relocation teams with both process and packaging expertise rather than separate vendors who work in isolation. DPS supports this type of integrated execution through process engineering, installation, and project management services that connect upstream process areas to downstream packaging performance. The U.S. market also sees frequent relocation work linked to plant consolidations, lease expirations, contract manufacturing transitions, disaster recovery, and expansion into lower-cost logistics hubs near interstates, rail terminals, or ports such as Houston, Savannah, Newark, Long Beach, and Oakland. Sanitation is one of the most important differences between beverage equipment relocation and general industrial machinery moving. A beverage plant cannot simply disconnect equipment, haul it, reconnect it, and resume production. CIP systems, sanitary process piping, valves, spray devices, instruments, pumps, and product-contact surfaces must be protected throughout the move to preserve hygienic design and avoid contamination risks. During pre-move planning, each CIP circuit should be documented to identify tank coverage, return paths, chemical dosing points, heat source connections, conductivity instrumentation, and valve logic. If a relocation project involves multiple skids or phases, every pipe spool, clamp, seat, gasket, and sanitary fitting should be labeled in a way that supports clean reassembly. In U.S. beverage facilities, preserving CIP performance is especially important when handling dairy-based beverages, kombucha, juice with pulp, functional beverages, and products with allergen or sugar loading concerns. Plants audited to SQF, BRCGS, or retailer standards often need stronger documentation than basic local code compliance. That means the relocation team must think like both installers and food safety professionals. One of DPS’s strengths in this area is its process utility and sanitary systems knowledge. The company designs and integrates complete CIP systems, sanitary process layouts, utility infrastructure, and automation logic for food and beverage plants. That technological capability matters during relocation because preserving wash coverage, return velocity, heating performance, and automation sequencing is just as important as reconnecting physical piping. Manufacturers evaluating sanitary system and vessel expertise can review equipment capabilities here. From a 2026 trend standpoint, CIP preservation is becoming more data-driven. Plants are increasingly tying relocation validation to digital maintenance records, electronic CIP batch reports, conductivity trend logs, and environmental monitoring programs. Sustainability goals are also shaping relocation planning, with more facilities looking to reduce post-move water usage, chemical waste, and cleaning cycle duration through better line design and automation upgrades performed during the move. Oversized beverage vessels often create the most visible and logistically complex part of a relocation project. Unitanks, bright tanks, horizontal storage vessels, mash tuns, lauter tuns, cook tanks, and large blend tanks may exceed normal transport dimensions or create center-of-gravity challenges that require custom lift engineering. In dense metros such as Los Angeles, Seattle, Boston, and New York, route restrictions, bridge clearances, power line proximity, and local permit timing can influence the entire project schedule. Heavy rigging for beverage vessels should begin with a documented lift plan that identifies weight, dimensions, insulation status, internal hardware, center of gravity, pick points, sling protection, crane radius, floor loading, and transport method. Many vessels also require temporary bracing or custom cradles, especially if their legs are not designed for highway vibration or if their shell geometry makes direct securement risky. For U.S. projects crossing long distances, vessel relocation may involve port-adjacent staging yards, police escorts, pilot cars, and multi-day permit sequencing. Freight planning is not only a transportation issue; it also affects insurance, schedule certainty, and restart readiness. If one critical tank is delayed en route to a Dallas, Phoenix, or Atlanta startup, the whole commissioning sequence can shift. This is why experienced relocation partners pre-stage cranes, forklifts, trailers, spreader bars, rigging gear, and trade labor in line with the project critical path. They also maintain tight communication with local municipalities, carriers, and site safety leaders. In many cases, moving one oversized vessel successfully depends on ten or more smaller decisions made weeks earlier. The growth trend above reflects realistic market drivers in the United States: capacity shifts toward co-packing, plant modernization, regional distribution optimization, secondary market equipment purchases, and a growing preference for relocating existing assets instead of buying all-new systems when speed to market matters more than greenfield purity. Among all beverage equipment categories, fillers and cappers are the most unforgiving after a move. A tank can be set and piped with some schedule flexibility, but a filling line that loses precision can drag down output, increase waste, and frustrate operators immediately. Reassembly must account for container infeed geometry, starwheel timing, turret position, cap delivery, seam or torque settings, conveyor elevation, lubrication systems, sensors, and PLC handshaking. Best practice is to treat the filling line as a measured system before disassembly. Teams should capture centerlines, baseplate elevations, shim packs, anchor locations, motor alignments, gap settings, and product path geometry. OEM manuals matter, but field conditions matter too. Many U.S. lines have years of fine-tuning that never made it into official documentation. Precision reassembly often benefits from a relocation team with controls and automation depth, not just mechanical capability. DPS brings technological capabilities in PLC programming, automation integration, SCADA, and utility-to-process coordination, which can be especially valuable when a move is combined with line upgrades, recipe changes, or expansion of production reporting. Instead of reinstalling a line exactly as it was, some clients use the move to remove bottlenecks, improve diagnostics, or reconfigure changeover logic. This is also where local conditions matter. A line moved from a legacy facility in Milwaukee or St. Louis to a new site in North Carolina or Texas may encounter different floor flatness, utility pressure stability, compressed air quality, and room temperature conditions. Precision alignment is therefore not just a reassembly task; it is a performance engineering task. The demand pattern above reflects strong relocation activity in co-packing and RTD markets, where speed, asset reuse, and flexible packaging capacity are major priorities. Beer remains active as breweries consolidate or right-size footprints, while dairy and juice require especially careful sanitary controls. A relocation is not complete when the equipment is physically in place. It is complete when the line reliably achieves expected throughput, quality, sanitation performance, and operator confidence. Post-relocation testing should follow a structured progression: utility verification, dry mechanical checks, controls checkout, water runs, CIP validation, product trials, speed ramp-up, quality sampling, and handoff documentation. Restoring nominal production speed often requires more than one trial. The first run may prove mechanical readiness, while later runs refine reject rates, changeovers, fill consistency, carbonation control, or package integrity. Plants that produce carbonated soft drinks, beer, kombucha, or nitrogen-dosed beverages often need extra attention because pressure, dissolved gas behavior, and temperature control can amplify small mechanical or utility issues. A practical commissioning matrix may include line rate by SKU, startup scrap percentage, cap torque or seam quality, dissolved oxygen, CIP cycle acceptance, alarm frequency, and labor utilization. The objective is not merely to “make product,” but to return to a stable commercial condition at or near pre-move performance levels. DPS frequently works where engineering and execution overlap. Its service capabilities include capital planning, owner’s representation, program management, installation oversight, and turnkey system integration. That combination is useful when a relocation must move quickly from mechanical completion into operational acceptance, especially for high-volume beverage sites where every lost shift matters. Companies looking for examples of integrated project execution can review project case studies for context on complex manufacturing work. The area trend reflects a broader U.S. market shift: beverage manufacturers increasingly want relocations bundled with process optimization, controls work, utility redesign, and startup support rather than disconnected vendor scopes. By 2026, this trend is likely to strengthen as labor remains tight, sustainability reporting becomes more visible, and capital projects face greater scrutiny around ROI. Compliance during beverage equipment relocation depends on product type, plant location, audit framework, and whether the move changes process classification or utility conditions. In the United States, a project may require coordination with local building authorities, state departments of agriculture, health departments, fire marshals, environmental agencies, wastewater authorities, and in some cases FDA-focused internal quality teams or customer audit stakeholders. For beverage plants, compliance planning typically addresses sanitary design, potable water connections, backflow prevention, floor drainage, chemical storage, steam or boiler systems, compressed air quality, labeling controls, allergen segregation where applicable, and documented startup sanitation. Facilities producing alcoholic beverages also need to consider TTB-related operational implications, while dairy beverage or aseptic sites may face more stringent validation expectations. Early coordination with inspectors prevents the common problem of being mechanically ready but not legally ready to start. This is especially important when relocating into industrial growth areas like central Texas, the Carolinas, Tennessee, Nevada, or Arizona, where permitting volume can be high and inspection windows may be limited. Plants near ports or intermodal hubs may also face different local utility review processes than older manufacturing corridors in the Midwest or Northeast. By 2026, compliance expectations are likely to expand further in three areas: digital documentation, traceable change control, and sustainability reporting. Even when not legally required, many beverage brands now ask manufacturers and co-packers to show responsible water use, energy efficiency improvements, and preventive maintenance controls following major equipment moves. Downtime is usually the largest hidden cost in beverage equipment relocation. Lost production, missed shipments, labor inefficiency, and startup scrap can easily outweigh direct rigging or transport charges. That is why many U.S. projects are scheduled during weekends, holiday shutdowns, third shifts, or carefully staged off-hours windows. A good downtime strategy starts with identifying which assets are truly critical. Some tanks can move early and wait for utility tie-ins, while a key filler, pasteurizer, or case packer may define the restart date. Projects should be backward-planned from the first commercial run, with crane picks, carrier arrivals, electrician work, controls checkout, sanitation, and validation all tied to a minute-by-minute or hour-by-hour schedule during the shutdown window. Weekend execution is common, but it only works when prework is complete. That includes steel modifications, utility rough-ins, floor layout, spare parts staging, gasket procurement, OEM support scheduling, and pre-approved safety permits. Plants in major freight and labor markets such as Chicago, Southern California, New Jersey, and Houston often need even tighter planning because traffic, labor availability, and permit timing can make “just-in-time” relocation unrealistic. DPS is structured to support this kind of fast, coordinated execution. Its lean, senior-level team works across process engineering, project management, installation integration, and general-contractor-style coordination where required. That service capability helps clients compress shutdown windows while maintaining control over safety, documentation, and production readiness. For clients comparing partners, the biggest differentiator is often not who can disconnect equipment, but who can orchestrate the entire move without creating costly gaps between trades. The comparison highlights what many operators already know from experience: the cheapest rigging quote can become the most expensive total project if the move lacks engineering discipline, sanitary oversight, controls coordination, and structured startup support. Pricing for beverage equipment relocation in the United States depends on much more than mileage. The total cost is shaped by equipment sensitivity, sanitary requirements, labor complexity, permit needs, utility scope, startup expectations, and how much production risk the client wants the relocation team to absorb. A one-day internal tank move in Ohio or Wisconsin bears little resemblance to a multi-state packaging line transfer from California to Texas or a sanitary process relocation for an RTD plant in Georgia. In budgeting terms, manufacturers should ask for a scope breakdown that separates disconnection, rigging, freight, reinstallation, utilities, controls, validation, and contingency. Without that clarity, it is easy to compare quotes that are not actually comparable. For example, one vendor may exclude sanitary consumables, OEM technician support, or production trial assistance, leaving those costs to emerge later as change orders. Another major factor is whether the relocation includes improvement work. Many beverage producers use a move to add automation, resize utilities, improve changeover ergonomics, or replace obsolete components. This can raise the project budget but lower long-term operating cost and reduce future downtime. In many cases, smart capital allocation during the move produces a better ROI than reinstalling an old problem exactly as it was. Manufacturing capability also matters in cost control. DPS designs and manufactures selected process equipment such as tanks, CIP systems, tumblers, and vessels, which can be useful when a relocation reveals damaged legacy components, capacity mismatches, or opportunities to replace problem assets with better-fit equipment instead of forcing inefficient reuse. Below are the questions beverage manufacturers in the United States ask most often when planning an equipment relocation. How early should planning begin?For most U.S. beverage projects, planning should begin at least 8 to 16 weeks in advance, and longer for interstate oversize transport, plant consolidations, or moves involving code upgrades. Do I need OEM technicians?For sensitive fillers, cappers, seamers, aseptic systems, pasteurizers, and specialized controls, OEM or OEM-qualified support is often worth the cost, especially when warranty, calibration, or high-speed performance matters. What documents should be prepared before shutdown?A solid package includes P&IDs, utility maps, electrical one-lines, controls backups, line photos, centerline measurements, valve schedules, instrument lists, spare parts lists, sanitation records, and startup protocols. Can a move improve line speed?Yes. Many relocations create a practical window to correct bottlenecks, upgrade PLC logic, rebalance conveyors, add better instrumentation, or improve CIP design. In some cases, the post-move line performs better than before. What kinds of beverage facilities benefit most from an integrated relocation partner?High-throughput co-packers, breweries, distilleries, juice plants, dairy beverage processors, carbonated soft drink sites, and aseptic operations benefit the most because their risk profile extends beyond basic lifting and transport. For companies evaluating relocation options in the United States, the best outcome usually comes from combining engineering, sanitary discipline, heavy rigging expertise, packaging precision, and startup accountability under one coordinated project strategy. That approach protects product quality, shortens downtime, and turns a disruptive move into a smarter capital decision. -
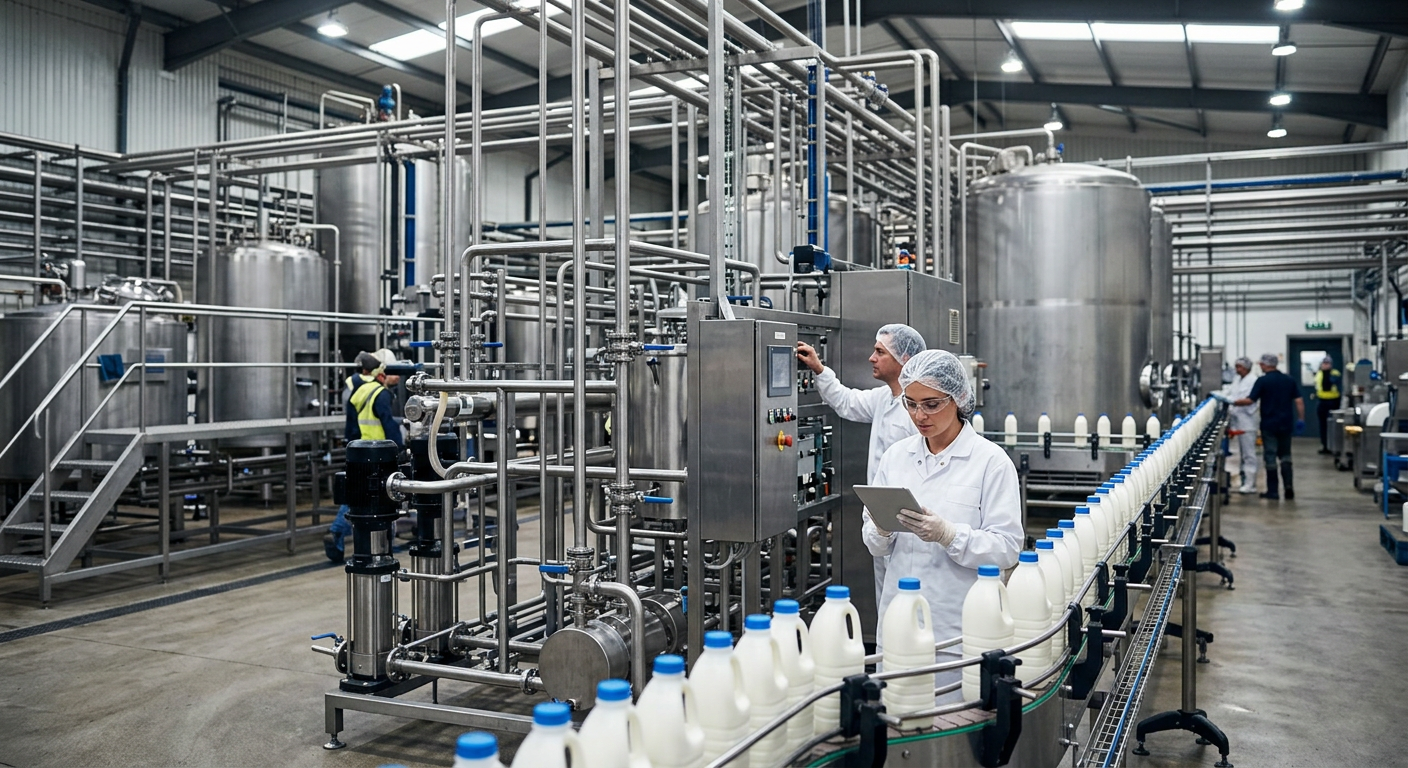
2026 Guide to Food Facility Zone Segregation and Color Coding
Food manufacturers in the United States are under constant pressure to prevent cross-contamination, protect product integrity, and satisfy FDA, USDA, SQF, and BRC expectations. A strong zone segregation and color-coded equipment program helps facilities separate risk, assign sanitation responsibility, control personnel movement, and reduce environmental pathogens before they reach finished product. In 2026, the most effective programs combine clear hygienic zoning, practical tool separation, disciplined traffic design, environmental monitoring, and engineering choices that make cleaning easier every day. The fastest way to improve hygienic control in a U.S. food plant is to divide the facility into four risk zones, assign cleaning tools by color to each zone, restrict employee and forklift movement between zones, and verify the system with environmental monitoring. Zone 1 covers direct food contact surfaces and requires the strictest controls. Zone 2 includes nearby non-contact surfaces that can still transfer contamination. Zone 3 covers remote production support areas, and Zone 4 addresses exterior and perimeter risks. When these zones are mapped correctly, supported by written SOPs, and tied to sanitation validation, manufacturers in places like Chicago, Dallas, Fresno, Charlotte, and the New Jersey logistics corridor can reduce both microbial risk and downtime. For buyers, the best program is not just a set of brushes and floor signs. It is an operational system that includes layout planning, drain strategy, utility routing, washdown design, personnel flow, traffic barriers, storage racks, ATP or microbiological verification, and training. This is why many processors now align hygienic zoning decisions with capital planning and plant engineering rather than treating sanitation segregation as a stand-alone purchase. This table shows why zone control is multidisciplinary. A sanitation team may own tools, but engineering, QA, operations, and facilities all influence whether the program works in practice. Zone 1 includes any surface that directly touches food, beverage, ingredients, or product-contact packaging. Examples include conveyors, slicers, fillers, depositors, kettles, blend tanks, tote contact points, nozzles, chutes, augers, and utensils. In ready-to-eat protein, dairy, aseptic beverage, and prepared foods plants, Zone 1 is the highest-risk environment and deserves the most conservative control strategy. In the United States, buyers often focus on sanitizer chemistry first, but that is only one part of Zone 1 control. The bigger picture is hygienic design. Product contact surfaces should be smooth, accessible, drainable, corrosion-resistant, and free from niches. Welds, seals, dead legs, hollow framework, poorly pitched piping, and hard-to-open machine guards create cleaning obstacles that can undermine even the best chemical program. For that reason, many processors now evaluate capital upgrades through a hygienic design lens before new lines are installed. During equipment planning, it helps to work with firms that understand both process performance and cleanability. DPS applies this approach through integrated process engineering and system design for food and beverage plants across North America, with experience spanning high-care food lines, beverage processing, aseptic systems, utilities, controls, and compliance-driven projects. Companies considering broader process upgrades can review engineering and project services that align sanitation performance with production needs. Zone 1 also requires the most disciplined verification. Facilities should define acceptable ATP thresholds, microbiological pass criteria, pre-operational inspection standards, and escalation rules when results fail. In a USDA-inspected protein plant in the Midwest, for example, a failed Zone 1 swab on a slicer leg may trigger expanded sampling, recleaning, root cause review, and intensified checks on adjacent conveyor transfer points. The practical buying advice for Zone 1 is simple: do not purchase equipment solely on throughput or price. Ask how long it takes to open, inspect, clean, validate, and restart. The true cost of ownership in Los Angeles, Atlanta, Minneapolis, or Houston depends as much on sanitation labor and contamination exposure as on nameplate speed. Zone 2 includes non-food-contact surfaces that sit close enough to product or Zone 1 equipment to create a realistic transfer risk. Common examples include machine frames, control panels, guards, conveyor undersides, drip shields, filler housings, catwalk rails, and support structures near open product. Zone 2 is where many contamination problems begin because the surfaces appear less critical, yet they are close enough to spread splash, condensation, dust, or harborage contamination into Zone 1. Environmental monitoring programs in U.S. ready-to-eat facilities often emphasize Zone 2 as an early warning layer. If an organism appears repeatedly on a framework cross-member beneath a conveyor or on a panel handle beside a filler, the plant has a chance to intervene before product contact surfaces become involved. That is why sanitation schedules should not treat Zone 2 as an afterthought. It needs documented access methods, cleaning chemistry compatibility, dry-vs-wet cleaning rules, and post-clean inspection standards. Zone 2 control is especially important in product categories such as sliced proteins, cultured dairy, aseptic support rooms, salad toppings, sauces, and low-acid beverages after a kill step. These products often move through open handling environments where nearby contamination can migrate through overspray, employee touchpoints, or difficult-to-clean components. Facilities expanding or retrofitting legacy plants in older industrial corridors such as Philadelphia, St. Louis, Milwaukee, or the Inland Empire should assess whether machine spacing, utility drops, and structural members make proper Zone 2 cleaning difficult. Smart engineering can reduce hidden ledges and congestion points. This table highlights the operational difference between Zone 1 and Zone 2. Zone 1 failure can be immediate product risk, while Zone 2 often acts as the leading indicator. Strong plants use Zone 2 data to prevent future events rather than waiting for a crisis. Zone 3 covers areas within the processing environment but farther from direct product exposure. Examples include floors, drains, forklifts, pallet staging zones, walls, maintenance carts, room perimeters, wheels, hose stations, wash sinks, refrigeration units, and utility corridors. These are not product-contact surfaces, but they can seed contamination into higher-risk spaces if left unmanaged. For environmental monitoring, Zone 3 often provides the richest trend data. Floors and drains, especially in wet protein or dairy operations, can serve as reservoirs for organisms that later travel through aerosols, footwear, wheels, hoses, and poor cleaning practices. In beverage processing, syrup rooms, blending spaces, and utility interfaces may show yeast, mold, or spoilage pressure long before packaged product quality is affected. A robust monitoring protocol should define sample sites by risk, season, moisture profile, and traffic pattern. Gulf Coast plants may face different moisture and pest pressures than facilities in Arizona or Colorado. Plants near major agricultural and logistics hubs like Fresno, Salinas, Omaha, Savannah, and Kansas City may also experience unique raw material and inbound vehicle contamination patterns. Trend review matters as much as single-point testing. One isolated floor drain finding may be manageable. Repeated positives across related drains, hose reels, and forklift wheels suggest a route of spread that calls for CAPA, not just recleaning. Many sophisticated processors now pair Zone 3 data with maintenance work orders, drain maps, and traffic logs to identify root causes faster. As a buying strategy, plants should choose monitoring programs that connect sanitation, maintenance, and operations data. If software is too complex for supervisors to use, results will sit in spreadsheets instead of driving action. Zone 4 covers the outer boundary of the food plant and surrounding property. This includes loading docks, roof interfaces, waste handling areas, exterior walls, employee entrances, trailer yards, utility pads, compressed air intakes, parking lots, and landscape edges. Zone 4 is where outside contamination enters the site through vehicles, weather, pests, dust, and standing water. In the United States, perimeter control varies by geography. Plants near ports such as Long Beach, Savannah, Newark, or Houston may face heavier trailer turnover and imported material exposure. Facilities in humid Southeast climates may need stronger standing-water and insect control. Dry inland plants may struggle more with wind-blown dust around dock doors and air intakes. Zone 4 is also where many facilities underinvest because contamination is not immediately visible on product. Yet exterior pressure often drives interior problems. Poor dock seals, cracked pavement, open waste handling, clogged roof drains, and unmanaged vegetation can all increase pest activity or moisture intrusion. This table explains why exterior programs belong in hygienic zoning discussions. A perimeter weakness eventually becomes an interior issue, especially when high trailer turnover, wet weather, or warm temperatures increase vector activity. A color-coded tool program is the visible backbone of zone segregation. Brushes, squeegees, shovels, buckets, hoses, scrapers, floor pads, aprons, gloves, and mobile carts should be assigned to risk zones so that tools never move casually from raw to ready-to-eat or from drains to food-contact areas. The most effective color systems are simple, durable, and tied to physical storage locations. Many U.S. plants use a four-color model that aligns to zones, but the best system is the one that your workforce can understand instantly across shifts and languages. If a site in North Carolina uses red for raw and blue for ready-to-eat, that rule should appear on tool boards, SOPs, training cards, and sanitation records. Plants with allergen segregation may add another color layer for ingredient classes or line dedication. When sourcing tools, buyers should evaluate chemical resistance, bristle retention, hygienic design, ease of inspection, heat tolerance, and replacement cost. Low-cost tools that crack, shed, or trap residue create hidden risk. Storage matters too. Tools should hang dry, off the floor, in the correct room, and near the point of use. Centralized storage can work in smaller facilities, but large plants generally perform better with distributed, zone-specific racks. For processors also planning equipment upgrades, there is value in aligning sanitation tools with process equipment selection. DPS supports this kind of systems-level planning through process integration and its own equipment capabilities, including custom tanks, CIP systems, marination tumblers, and cooking vessels designed to fit broader plant execution goals. Manufacturers evaluating line changes can also explore available process equipment solutions as part of larger hygienic improvement projects. By 2026, the trend is moving beyond simple color matching. The leading plants pair color-coded tools with QR-tagged inventories, wash verification, replacement logs, and sanitation ownership by room. Sustainability is also shaping purchases, with stronger demand for longer-life materials and reduced disposable waste. Even the best color-coded system fails when people, pallets, and maintenance activity move freely across hygienic boundaries. Traffic patterns and personnel flow controls are therefore essential. The goal is to design the plant so clean-to-dirty and post-lethality-to-raw crossover is minimized by default, not merely discouraged by policy. Practical controls include separate entry points, gowning transitions, footwear changes, foam or sanitizer barriers, handwashing stations, wheel wash points, one-way corridors, dedicated forklifts, visual floor markings, and scheduling rules for maintenance and waste removal. In high-care environments, facilities may use controlled air pressure cascades, interlocked doors, and badge-limited access. Traffic control decisions should be made during plant design and renovation, not after equipment is already squeezed into place. This is where service capability matters. DPS works as an engineering and execution partner that bridges planning, buildout, and implementation, helping processors think through process flow, utility coordination, capital feasibility, installation, controls, and project management as one system. Companies exploring project support can learn more about the team and operating approach behind that model. Industries with the strongest need for strict flow control include ready-to-eat meat, dairy, fermented beverages, aseptic filling, fresh prepared foods, and co-packing facilities with multiple SKUs and rapid changeovers. Applications range from raw receiving and thaw rooms to post-cook slicing, blending, canning, filling, and secondary packaging. Buying advice: before approving a traffic-control investment, observe the facility during sanitation, startup, changeover, and shift turnover. These are the moments when policy is most likely to break down. A beautiful flow map that ignores real forklift congestion near docks or maintenance response patterns will not hold up in production. Vectors are the routes by which contamination travels. In food plants, the most common vectors are employees, gloves, tools, hoses, wheels, drains, condensate, overspray, pallets, maintenance equipment, incoming packaging, and pests. Cross-contamination prevention depends on identifying which vectors are realistic for each zone and interrupting them with physical and procedural controls. Vector mapping is especially useful after repeated environmental positives or unexplained spoilage trends. For example, a dairy plant may discover that mobile ladders move between wet utility rooms and open filling areas. A beverage site may find that hose nozzles touch floors during sanitation and then contact external machine surfaces near open containers. A protein processor may see recurring spread from pallet jack wheels crossing raw and cooked support corridors. Strong vector control programs combine engineering, sanitation, and discipline. Condensation management, drain placement, pallet policy, tool assignment, traffic barriers, and preventive maintenance all reduce transfer pathways. Pest control also belongs here; birds near receiving can lead to dock contamination, and rodent pressure around waste handling can increase transfer risk through wheels and personnel shoes. For local supplier evaluation, U.S. buyers should compare providers on more than product catalog size. Ask whether they support site assessments, hygienic design input, validation guidance, replacement planning, and staff training. Regional support matters in high-volume manufacturing areas such as the Carolinas, California Central Valley, Texas, Wisconsin, Arkansas, and the Midwest protein belt. In 2026, future trends include smarter sensors for environmental conditions, digital route tracking for sanitation tools, more pressure from audit schemes on documented zoning logic, and stronger sustainability requirements tied to water, chemical, and material use. Policy expectations are also increasing around preventive controls, validation, and documented risk assessment, especially for high-risk products. Disruptive Process Solutions supports food and beverage manufacturers across the United States and Canada with a practical, profit-focused engineering mindset. Rather than approaching sanitation zoning as an isolated compliance project, the company helps clients connect hygienic design, production goals, utility systems, automation, and capital efficiency. From a technological standpoint, DPS brings multidisciplinary engineering across process, mechanical, structural, plumbing, electrical, and controls. That includes PLC programming, SCADA, batch logic, utility integration, and line coordination for beverage, dairy, protein, prepared foods, aseptic processing, and other regulated applications. This matters when a zoning improvement also affects CIP strategy, equipment access, drain routing, air handling, or automation sequencing. From a manufacturing standpoint, DPS designs and supplies selected process equipment such as tanks, CIP skids, marination tumblers, and cooking vessels that can be integrated into broader facility upgrades. That helps processors align equipment procurement with sanitation, cleanability, and installation realities rather than sourcing each item in isolation. From a service standpoint, DPS provides planning, feasibility support, owner representation, project management, general contracting coordination, installation, and system integration. For processors evaluating expansion, relocation, or modernization, that full-scope model can reduce the gaps that often appear between engineering intent and plant-floor execution. Additional examples of project outcomes are available in these food and beverage case studies. The company is headquartered in Cary, North Carolina, with a West Coast office in Lake Forest, California, and supports clients across all 50 states. That national footprint is useful for manufacturers operating multiple plants or planning standardized hygienic zoning programs across geographically different facilities. 1. What is the difference between Zone 1 and Zone 2?Zone 1 touches food directly. Zone 2 does not touch food but sits close enough to spread contamination into Zone 1 through splash, touch, condensation, or debris. 2. How many colors should a food plant use?Use only as many colors as employees can apply consistently. Four is common, but some plants add colors for allergen control or dedicated production lines. 3. Do all U.S. food plants need formal zoning maps?Not every site needs the same complexity, but most modern facilities benefit from a documented zone map tied to cleaning, monitoring, and traffic rules. 4. What products need the strictest segregation?Ready-to-eat meats, dairy, aseptic beverages, fresh prepared foods, sauces after lethality, and any open product exposed after a kill step usually require the strongest controls. 5. How often should environmental monitoring be reviewed?High-risk sites often review results weekly, with monthly trend analysis and immediate escalation for repeat findings in the same route or vector path. 6. Can old plants still build strong zone control?Yes. Legacy facilities can improve with better traffic separation, color-coded tools, drain strategy, equipment access upgrades, and focused monitoring, even before full renovation. 7. What should buyers ask sanitation tool suppliers?Ask about material durability, cleanability, chemical compatibility, replacement cycles, storage systems, training support, and whether they understand hygienic zoning by product risk. 8. How does zoning affect ROI?Good zoning reduces contamination events, downtime, product loss, audit findings, and emergency cleaning. It also supports longer-term equipment reliability and faster troubleshooting. 9. What is the biggest 2026 trend?The biggest shift is from basic visual segregation to integrated programs that combine hygienic design, digital verification, monitoring data, personnel control, and sustainability planning. 10. When should a company bring in an engineering partner?Bring one in during early planning for expansions, equipment changes, high-risk product introductions, repeated environmental issues, or when plant layout is limiting sanitation performance. Across the United States, food facility zone segregation and color coding are no longer optional best practices for sophisticated manufacturers. They are operating disciplines that protect product, customers, brand reputation, and capital performance. The strongest programs treat zoning as part of plant design, not just sanitation training. When Zone 1 through Zone 4 are clearly defined, tools are controlled, traffic is managed, vectors are interrupted, and monitoring confirms results, facilities are better positioned for safer growth in 2026 and beyond. -
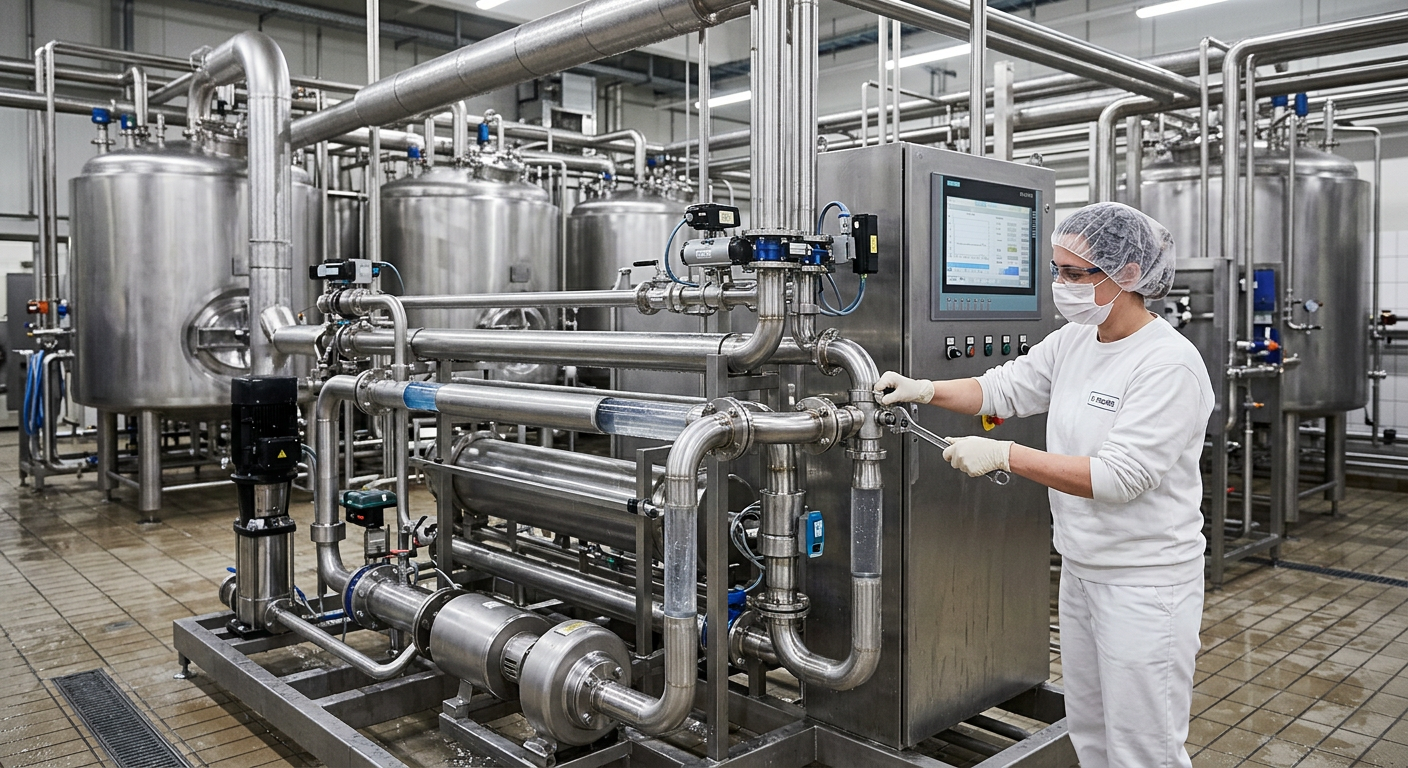
Food Plant Personnel Hygiene Programs: Complete 2026 Checklist
Personnel hygiene is one of the most important control points in any food or beverage facility in the United States. Whether a plant handles ready-to-eat meals in Chicago, poultry in Arkansas, dairy in Wisconsin, sauces in New Jersey, or aseptic beverages near Los Angeles and Houston, employee hygiene programs directly affect food safety, audit performance, labor efficiency, and brand protection. In 2026, food manufacturers are expected to tighten hygiene controls not only to meet FDA, USDA, SQF, and BRC expectations, but also to reduce operational variability, support workforce turnover, and document compliance more effectively. This guide explains how to build and maintain a practical personnel hygiene program for U.S. food plants. It covers exclusion policies, hand washing station design, protective clothing, glove protocols, training, visitor management, and documentation. It also looks at industry demand, product categories, buying advice, applications, local supplier considerations, and upcoming technology and policy trends shaping the American market. A strong food plant personnel hygiene program in the United States should do five things well: prevent sick or contaminated personnel from entering production areas, make correct hand washing easy, standardize protective clothing by risk zone, define glove changeover rules, and verify compliance through training and records. Plants that do this consistently are better positioned for FDA inspections, USDA oversight, customer audits, and GFSI-benchmarked certification reviews. For most facilities, the most effective hygiene program is not the one with the longest policy manual. It is the one that operators can actually follow on first shift, second shift, weekends, and during peak season staffing. That means clear visual controls, good entry design, practical gowning layouts, line-of-sight supervision, digital documentation when possible, and reinforcement during onboarding. In the U.S. market, hygiene programs are increasingly tied to automation and facility design. Modern plants in manufacturing corridors such as North Carolina’s Research Triangle, Texas food logistics hubs, California beverage clusters, and Midwest protein processing regions are investing in better hand wash infrastructure, access control, sanitation zoning, and audit-ready data capture. The 2026 trend is clear: hygiene is moving from a policy topic to an engineered system. For buyers planning a plant expansion or retrofit, personnel hygiene should be addressed at the same time as process flow, utilities, CIP routing, HVAC pressure relationships, and material movement. Retrofitting hand washing points after construction is often more expensive than integrating them during layout development. The chart above reflects a realistic growth pattern in U.S. spending on hygiene-related plant systems, including hand wash access equipment, gowning controls, digital monitoring, training tools, and software. Growth is being driven by labor turnover, retailer expectations, audit readiness, and the need to reduce contamination events in higher-risk categories. Health screening and exclusion policies are the first line of defense in a personnel hygiene program. U.S. food plants should maintain written rules that explain when employees, contractors, and temporary workers must report symptoms, when they are restricted from handling food or food-contact surfaces, and when they are excluded from production areas entirely. At a minimum, screening should address vomiting, diarrhea, fever with sore throat, jaundice, infected wounds on exposed body parts, and diagnosed communicable illnesses relevant to food handling. Policies should also account for respiratory illness procedures where facilities choose to adopt enhanced controls, especially in ready-to-eat environments. These policies matter across product categories, but especially in high-risk applications such as deli salads, dairy processing, post-lethality protein slicing, aseptic packaging, cultured beverages, and prepared foods. A bakery with a fully wrapped product may manage some exposures differently than a ready-to-eat meat operation under USDA scrutiny, but both still need clear decision trees. The table shows the practical difference between restriction and exclusion. Restriction usually means the person may perform non-food-contact duties. Exclusion means they should not enter production, packaging, or ingredient handling areas at all. Plants should define this clearly because confusion at the supervisory level is a common audit finding. For multi-site operators with plants near Savannah, Kansas City, Fresno, or Philadelphia, consistency matters. A centralized policy should be adapted for site risk but not rewritten so heavily that one facility tolerates what another excludes. Temporary labor providers should be contractually required to support the same reporting expectations. Hand washing only works when stations are correctly located, properly supplied, and engineered for flow. In many U.S. plants, compliance problems are caused less by employee resistance and more by poor layout. If staff must detour around forklift traffic, wait in a bottleneck near a gowning room, or reach a sink that is not visible from entry control, hand washing quality drops. Best practice is to place stations at every production entry point, near high-risk transitions, restrooms, rework areas, allergen handling zones, and maintenance access points where employees can re-enter processing spaces. In a large beverage or food campus, hygiene access should be matched to traffic patterns from locker rooms, breakrooms, warehouse interfaces, and maintenance corridors. In retrofit projects, station design should be coordinated with plumbing, floor drainage, splash control, chemical dispensing, sensor activation, and sometimes turnstile release systems. This is one reason many processors involve engineering partners early in a capital plan rather than treating hand wash points as minor fixtures. This table highlights a key point: compliance is strongly influenced by design. When managers ask why hand washing scores are inconsistent, the answer is often found in utility access, ergonomics, and traffic flow rather than in discipline alone. Facilities handling seafood near Gulf Coast ports, meat processing in Omaha, or beverage filling near the Port of Long Beach may each have different layouts, but all benefit from the same principle: the hand wash station must be the natural path of entry, not an optional stop. Protective clothing requirements should be matched to product risk, area classification, and employee task. A low-care dry storage room does not need the same controls as an exposed ready-to-eat slicing room. The goal is not to overburden every employee, but to assign the right garments to the right zone and make changeover easy enough to sustain. Typical garments include smocks, frocks, aprons, beard covers, hairnets, sleeve covers, frosted safety glasses where needed, cut-resistant gloves under outer gloves, dedicated footwear, and color-coded uniforms for departments such as raw, cooked, allergen, sanitation, maintenance, and quality assurance. In high-risk environments, plants may also require segregated boot wash and gowning transitions. Color coding becomes especially useful in larger plants where contractors, sanitation crews, forklift operators, and line personnel move through overlapping spaces. It reduces visual confusion and helps supervisors identify out-of-zone movement quickly. The table shows why a one-uniform-fits-all policy usually fails. Zone-specific clothing improves contamination control and can also simplify training. Employees understand expectations faster when garments visually reinforce area boundaries. For buyers selecting uniforms or gowning systems, look for durability, ease of laundering, replacement lead time, compatibility with metal detection or X-ray requirements where relevant, and support for local service routes. Plants in remote regions may need backup garment inventory if their laundry provider is not nearby. Gloves are useful, but they are not a substitute for hand washing. In many audits, overreliance on gloves actually hides poor hygiene practice. U.S. food plants should treat gloves as a controlled barrier that must be donned correctly, changed at defined events, and matched to product risk and task. Single-use gloves are common in ready-to-eat and packaging tasks, while heavier reusable gloves may be used for sanitation, deboning, thermal operations, or chemical handling. Some operations also use cut-resistant inner gloves beneath disposable outer gloves. Each combination needs a written cleaning and replacement rule. The explanation here is straightforward: gloves need event-based and time-based controls. Event-based changes cover obvious contamination points. Time-based changes are valuable on repetitive tasks where wear, perspiration, and unnoticed contamination can accumulate. Glove buying advice should include material compatibility, dexterity, puncture resistance, food-contact suitability, allergen concerns such as latex avoidance, and procurement resilience. Plants around major freight routes such as Memphis, Dallas-Fort Worth, and the New York-New Jersey distribution corridor increasingly prefer approved secondary suppliers to avoid disruptions. This bar chart reflects how hygiene program intensity varies by sector. Ready-to-eat foods and protein processing tend to show the highest demand because employee contact, product exposure, and contamination consequences are more severe. Beverage plants range from moderate to high depending on whether they run aseptic, dairy-based, fermented, or hot-fill applications. Training is where many hygiene programs either become real or remain theoretical. Every employee should receive hygiene training at onboarding, but effective plants go further by validating understanding, repeating key points by department, and using observations to confirm behavior on the floor. Core training topics should include illness reporting, hand washing sequence, glove use, uniform rules, jewelry and personal item restrictions, traffic flow between zones, allergen movement, breakroom re-entry, reporting damaged PPE, and response to contamination events. Supervisors should receive extra instruction on when to restrict, reassign, or escalate a hygiene issue. Competency checks are especially important for temporary workers, multilingual teams, seasonal hires, and roles with high turnover. In practical terms, that means short quizzes, observed demonstrations, sign-off records, and coaching tied to real tasks. Plants that rely only on slide decks without floor verification often struggle during customer audits. In 2026, training is shifting toward blended models: classroom basics, multilingual video prompts at access points, QR-linked refresher content, and digital observation forms. This is particularly useful in large facilities in Atlanta, Phoenix, Indianapolis, and Charlotte where labor pools are diverse and staffing ramps can happen quickly. The area chart shows a realistic shift in the U.S. market from paper-based hygiene monitoring to digital verification. The change is not only about convenience. Digital systems improve trend review, training follow-up, corrective action closure, and audit retrieval speed. Competency assessment should be retained as part of the training record. A signed attendance sheet alone is weak evidence. A stronger record shows the topic covered, the employee’s department, the trainer, the date, the evaluation method, and any remedial coaching performed after observation. Visitors, vendors, auditors, executives, maintenance contractors, and temporary workers all create unique hygiene risks because they may not be familiar with plant-specific movement rules. A good policy separates low-risk office visits from production access and applies the same hygiene expectations to everyone entering controlled areas. Visitors should complete a sign-in process, basic health declaration, PPE issue, and escorted route. In high-care spaces, facilities may limit access only to essential visits. Photography, loose personal items, and jewelry should also be controlled where they pose contamination or confidentiality concerns. Temporary workers need more than a badge and a quick orientation. They should receive the same hygiene instruction as regular employees, adapted to literacy level and language. Staffing agencies should be aligned on illness reporting, attendance expectations, and disciplinary escalation. This is especially relevant in large seasonal markets such as California produce, Midwest frozen foods, Gulf Coast seafood, and holiday-related bakery or confectionery plants. During labor surges, the weakest point in hygiene control is often compressed onboarding. Useful controls include colored visitor helmets or frocks, restricted zone maps, escort logs, pre-entry checklists, contractor tool sanitation protocols, and a defined process for collecting PPE at exit. Temporary workers should be traceable by line assignment and shift in case an incident review is needed later. Monitoring converts policy into evidence. U.S. plants need enough documentation to show that hygiene expectations are defined, communicated, observed, corrected, and reviewed. At the same time, records should not be so burdensome that supervisors spend more time checking boxes than managing behavior. The best monitoring systems focus on a few high-value checks: pre-op readiness of hygiene stations, PPE availability, entry compliance, hand wash and glove observations, illness reporting documentation, visitor entry records, and corrective actions for repeated misses. Plants can then trend recurring issues by department, shift, or access point. This table illustrates how each record answers a different audit question. Together, they show the plant did not merely write a policy; it implemented and maintained it. If a facility is still heavily paper-based, start by digitizing the records that are hardest to retrieve under pressure, such as visitor logs, training sign-offs, and corrective actions. Plants in highly regulated or customer-audited sectors often combine QA review, operations ownership, and HR support. That cross-functional structure works well because hygiene is not solely a quality issue. It also affects labor management, maintenance access, and production continuity. The comparison chart shows why many larger manufacturers are moving toward integrated hygiene systems rather than isolated products. A basic program may satisfy minimum needs, but an engineered approach usually delivers better audit readiness and smoother labor flow over time. The U.S. market for personnel hygiene products and systems is broad. Buyers may source sinks, turnstiles, boot washers, locker room equipment, disposable PPE, reusable garments, glove dispensers, digital training software, access control hardware, and sanitation-zone signage from separate vendors or through integrated partners. The right approach depends on plant size, category risk, and project complexity. Different industries prioritize different products: Local supply conditions also matter. Plants near major ports such as Long Beach, Savannah, Houston, and Newark may have broader import access for disposable PPE, while inland facilities may prioritize domestic stock reliability. During procurement, ask suppliers about lead times, alternate SKUs, emergency replacements, and regional service support. When comparing local suppliers, buyers should evaluate more than unit cost. Useful criteria include installation support, sanitation-friendly design, spare parts availability, documentation, compatibility with USDA or FDA expectations, and whether the vendor understands food traffic flow rather than only selling generic industrial fixtures. The lesson from this table is that product selection should follow process risk and labor flow. A cheap solution that slows entry or creates confusion often costs more over time through labor loss, workarounds, or nonconformance findings. Several trends are shaping hygiene program decisions in the U.S. food and beverage sector for 2026 and beyond. First, facilities are adopting more digital verification. This includes sensor-linked dispensers, access systems that prompt hand wash sequences, mobile observation tools, and dashboards that show repeat deviations by area. These tools are not replacing supervisors, but they are giving managers better visibility. Second, policy expectations are becoming more risk-based and more documented. Manufacturers increasingly align personnel hygiene with broader preventive controls, environmental monitoring, allergen management, and food defense plans. In practical terms, hygiene no longer sits as a separate SOP binder; it is tied into site-wide compliance systems. Third, sustainability is becoming part of hygiene decisions. Plants are asking whether towel use, garment laundering, water consumption, and disposable PPE can be optimized without compromising food safety. Sensor faucets, efficient wash cycles, durable reusable garments where appropriate, and smarter replenishment systems are becoming more common. Fourth, workforce realities are pushing for simpler, more visual systems. Labor shortages, high turnover, and multilingual staffing are all encouraging better icon-based signage, clearer gowning sequences, and more intuitive plant entry design. Finally, capital project teams are treating personnel hygiene as a built environment issue. That means integrating hygiene controls into early-stage planning with process equipment, drains, utility routing, HVAC, and automation, rather than trying to add them after a layout is fixed. For manufacturers planning new construction, expansion, relocation, or complex retrofit work, hygiene performance often depends on whether facility design and execution are aligned from the start. Disruptive Process Solutions supports food and beverage manufacturers across the United States and Canada with a practical, project-driven approach focused on long-term profitability rather than short-term patchwork. From a technological capability standpoint, DPS works across structural, mechanical, plumbing, electrical, process, and controls engineering. That matters for personnel hygiene because hand washing systems, boot sanitation, gowning transitions, utilities, drains, access points, and automation cannot be solved in isolation. In plants producing carbonated beverages, dairy-based drinks, sauces, proteins, aseptic products, or prepared foods, coordinated engineering helps ensure hygiene controls fit the production reality rather than disrupt it. From a manufacturing capability standpoint, DPS also supports equipment-related execution for complete processing environments and offers its own process equipment line, including tanks, CIP systems, tumblers, and cooking vessels. In practice, that gives clients a partner who understands how personnel movement, sanitation access, processing equipment placement, and utility integration affect food safety and labor efficiency at the same time. Companies exploring new system layouts can review relevant processing equipment capabilities when considering how hygienic design and production throughput intersect. From a service capability standpoint, DPS provides process engineering, capital planning, owner’s representation, project and program management, general contracting functions where applicable, installation, and integration through its design-build-manage model. For food plants trying to improve hygiene access during an expansion or major retrofit, this kind of end-to-end support can reduce the disconnect between concept design and field execution. Manufacturers considering broader plant improvements can explore available engineering and project services or review selected project case examples to understand how integrated execution supports compliance and operations together. In short, the company’s value in this context is not limited to supplying a single hygiene product. It lies in helping manufacturers build production systems where personnel hygiene, utilities, process flow, and business goals work together. The most common weakness is inconsistency between written policy and floor execution. Plants may have strong SOPs, but poor sink placement, weak onboarding, unclear glove change rules, or inconsistent supervision undermines compliance. No. Gloves should be used where risk assessment and product exposure justify them. They are not a replacement for hand washing, and unnecessary glove use can create waste and false confidence. At minimum, during onboarding and at defined refresher intervals. Additional retraining should happen after deviations, role changes, policy updates, or repeated observation failures. High-turnover operations often benefit from short monthly refreshers. Yes. Temporary labor should follow the same health reporting, PPE, hand washing, and traffic control rules as direct employees. Their onboarding may be simplified, but expectations should not be lower. Training and competency records, visitor logs, health reporting documentation, hygiene station checks, and corrective action records are usually the most valuable because they show active implementation rather than passive policy ownership. Start with the highest-risk gaps: production entry control, hand washing access, clothing zoning, glove rules, and training verification. After that, digitize the records or observations that consume the most time and are hardest to retrieve. It depends on the product and process. A shelf-stable hot-fill line differs from an aseptic dairy beverage or kombucha facility. Product exposure, post-process handling, and regulatory expectations determine the needed rigor. Expect wider use of digital verification, more risk-based documentation, stronger integration between hygiene and plant design, and more attention to sustainability in water use, garment programs, and disposable consumables. A well-run personnel hygiene program protects product, supports audits, improves labor discipline, and reduces avoidable risk. In the U.S. food and beverage market, the most effective programs in 2026 will be the ones that combine policy, training, facility design, and practical execution into one system. -
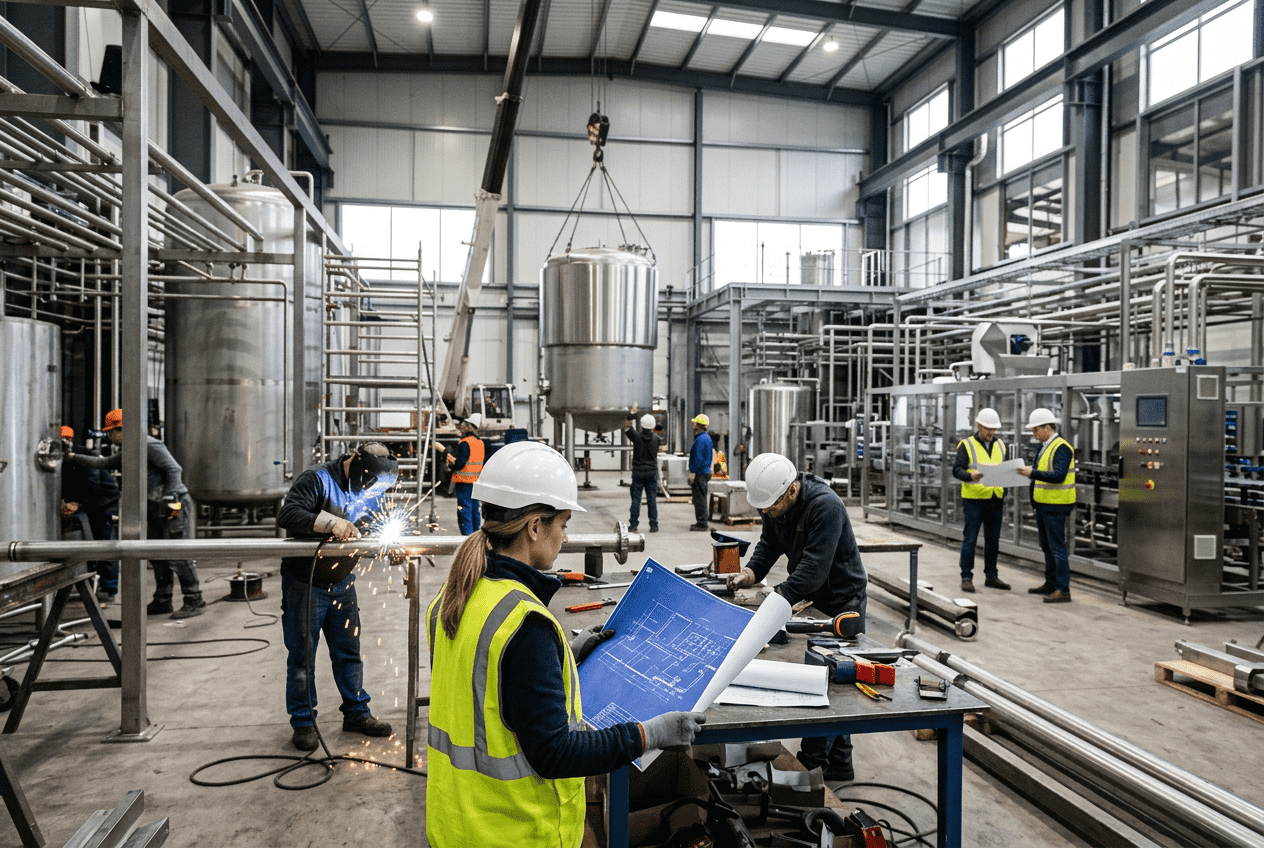
Beverage Factory Expansion Planning
Expanding a beverage facility in the United States is not simply a matter of adding square footage or buying a faster filler. The best projects connect commercial demand, process design, utility capacity, packaging flexibility, quality control, labor planning, and logistics economics into one capital roadmap. Whether a producer is scaling kombucha in Portland, RTD cocktails in Texas, juice in California, dairy-based drinks in Wisconsin, or carbonated soft drinks near Atlanta, the most profitable expansion plans begin with a clear answer: what exact production bottleneck is limiting output today, and what future state is the plant supposed to support three to seven years from now? For many beverage manufacturers, that answer lives somewhere between product development and full industrialization. A bench-top formula may work in a lab, and a pilot run may succeed at a co-packer, but commercial profitability depends on repeatable throughput, sanitation design, utility resilience, changeover speed, and packaging line efficiency. That is why plant expansion often requires an integrated engineering partner rather than isolated equipment purchases. Companies such as Disruptive Process Solutions are increasingly selected by U.S. beverage producers because they tie capital planning to plant performance, not just installation scope. This guide explains how to plan beverage factory expansion for the U.S. market, including capacity modeling, the pilot-to-commercial gap, line selection, utility sizing, phased scheduling, quality lab integration, supply chain savings, timeline control, budget discipline, and 2026 trends in automation, sustainability, and compliance. The fastest way to plan beverage factory expansion in the United States is to work backward from sellable cases, SKU mix, package formats, sanitation windows, and peak-season demand. From there, determine required process throughput, tank capacity, filler speed, warehouse space, labor, and utility loads. A strong expansion plan should answer ten questions before equipment is ordered: The direct answer for most U.S. operators is this: expand only after validating the business case, mapping the bottleneck, and designing a phased utility and equipment plan that can scale without disrupting current production. In the current U.S. market, expansion is being driven by premiumization, regionalization, shorter logistics radius expectations, the rise of functional beverages, and the need for more resilient domestic manufacturing. Producers shipping long distances from a single plant often discover that a second line, a utility expansion, or a new regional facility can reduce freight cost enough to improve margins even before higher output is sold. The chart above reflects a realistic directional trend: U.S. beverage producers continue to invest in line flexibility, regional capacity, and automation as labor costs, freight volatility, and retailer service expectations reshape plant economics. Capacity planning starts with a simple but often misunderstood principle: formula success is not manufacturing success. A drink that tastes right in a bench-top batch can fail commercially because of carbonation drift, ingredient hydration time, emulsification limits, heat sensitivity, flavor separation, or filling temperature variation. Commercial scale-up requires both process science and production math. In practical terms, U.S. beverage producers should convert sales forecasts into a design basis using annual cases, peak-week demand, target OEE, package count per case, operating days, and sanitation downtime. For example, a company projecting 8 million cases per year with heavy summer demand may need equipment sized closer to 10 million-case capability once downtime, SKU changes, and peak periods are accounted for. Below is a useful planning framework. A strong engineering team will model more than filler speed. It will also study syrup room design, mixing accuracy, CIP turnaround, bright tank residence time, flash or tunnel pasteurization requirements, can warmer needs, palletizing rates, and warehouse staging. This is especially important for producers in major U.S. corridors such as Chicago, Dallas-Fort Worth, Los Angeles, New Jersey, and Charlotte, where distribution velocity and customer fill rates directly impact retailer relationships. On the technology side, DPS supports projects requiring process, mechanical, plumbing, electrical, structural, controls, and automation engineering. That matters in scale-up because the difference between a theoretical capacity increase and a real one often comes down to PLC logic, SCADA visibility, recipe control, inline Brix verification, or integrated CIP sequencing rather than simply vessel size. One of the most expensive mistakes in beverage manufacturing is underestimating the gap between making zero commercial cases and making one hundred repeatable, shippable cases every hour, every shift, every week. This “0-to-100 case gap” is where pilot plant expansion plays a strategic role. Pilot-scale assets help manufacturers test process assumptions before major capital is committed. That may include small blending systems, modular pasteurization, mini-CIP skids, trial fillers, temporary carbonation equipment, or flexible tank farms. For functional beverages, RTD coffee, dairy-based drinks, kombucha, and aseptic products, pilot expansion can identify failure points in ingredient handling, microbiological controls, or package performance early enough to avoid major field rework. U.S. manufacturers often use pilot expansion in three ways: This is also where the manufacturing capabilities of a partner matter. DPS designs and integrates beverage systems covering fermentation, distillation, blending, carbonation, pasteurization, filtration, water treatment, aseptic processing, hot fill, cold fill, and full utility infrastructure. For clients moving from proof-of-concept to expansion, that breadth helps prevent the common U.S. problem of buying isolated pilot equipment that cannot connect cleanly to future production assets. A good pilot-to-commercial bridge should prove six things: process consistency, sanitation strategy, operator workflow, utility demand, package integrity, and realistic throughput. If those items are not documented, the pilot phase has not actually reduced project risk. The area chart highlights a broader trend: capital is shifting away from rigid single-purpose assets toward flexible systems that can support phased expansion, SKU growth, and future automation. Equipment selection should always start with the product and packaging mix. A juice producer serving club stores may prioritize high-speed PET, while a craft beer or sparkling water producer may focus on canning flexibility. An RTD cocktail producer may need alcohol-compliant processing, explosion-proof zones, and tight dissolved oxygen control. A dairy beverage plant may require homogenization, refrigeration redundancy, and stringent hygienic zoning. When evaluating expanded capacity, compare not just nameplate speed but effective speed under real U.S. operating conditions. A 400-cans-per-minute line with long changeovers and poor depalletizer reliability may underperform a 250-cans-per-minute line designed for the actual SKU profile. For packaging line procurement, producers should review fillers, seamers or cappers, depalletizers, rinsers, pasteurizers, labelers, coders, conveyors, packers, palletizers, and warehouse interface. In many U.S. expansions, the best result comes not from replacing everything, but from integrating selected new modules into an existing line architecture. To compare equipment approaches, the following chart shows a realistic scoring model used in capital planning. The lesson is not that one approach always wins. It is that modular expansion often outperforms full replacement when the facility needs phased growth, budget control, and continued production during construction. Before placing equipment orders, ask for documented run rates at similar plants in the United States, FAT scope details, spare parts strategy, sanitation access, local service support, controls compatibility, and long-lead component lead times. Equipment should match the business model, not just the desired brochure speed. Utilities are where many expansion projects quietly fail. A new line may fit physically into the building, but if the plant lacks transformer capacity, compressor redundancy, process water flow, wastewater handling, or glycol tonnage, the line will never deliver planned output. Infrastructure sizing must account for current load, future phase load, start-up surge, sanitation demand, and utility redundancy. In U.S. markets with aging industrial parks, such as parts of the Northeast or older Midwest manufacturing corridors, power upgrades may require long utility coordination windows. In fast-growth regions like Phoenix, Nashville, or Central Florida, water and wastewater permitting may become the pacing item. In this part of the project, the technological capability of the project partner matters substantially. DPS combines process and utility engineering with controls and integration, allowing infrastructure to be designed alongside production logic instead of as an afterthought. That is particularly valuable for U.S. beverage facilities adding SCADA, recipe management, energy monitoring, and automated CIP verification. For plants considering 2026 expansion, sustainability targets are now influencing utility design. More projects are incorporating water recovery strategies, heat reclamation, VFD-driven pump systems, compressed air leak analytics, and energy dashboards that help justify capex through lower operating expense. As state and local pressure grows around water use and carbon reporting, these features are becoming commercial tools, not just environmental talking points. Most beverage manufacturers cannot shut down for six months while expansion takes place. They must keep serving distributors, retailers, and foodservice customers during construction. That makes phased scheduling one of the highest-value disciplines in the entire project. A practical U.S. expansion schedule begins with the production calendar. Beer, energy drinks, teas, sports drinks, and sparkling beverages often surge ahead of spring and summer. Cider, specialty holiday SKUs, and certain alcohol-adjacent products may peak later in the year. Construction should be sequenced around these commercial realities. Typical phases include enabling work, utility reroutes, pad and steel installation, off-line equipment assembly, tie-ins during shutdown windows, dry commissioning, wet commissioning, and ramp-up support. In active beverage plants, night work, weekend shutdowns, holiday tie-ins, and temporary bypass systems are often essential. The service model matters here. DPS is known for a design-build-manage approach that combines engineering, construction coordination, and execution oversight into one framework. For U.S. plants trying to avoid finger-pointing between designers, equipment vendors, and trades, that integrated structure can reduce schedule drift and change-order confusion. For many producers, a smart move is to schedule noisy or high-risk work after peak shipping periods and perform final tie-ins during planned sanitation shutdowns or holiday closures. Plants near major distribution hubs such as Memphis, Columbus, Kansas City, and Savannah often benefit from synchronizing construction with freight seasonality to reduce warehouse pressure during transition. Expansion should not be limited to tanks and packaging lines. Quality labs and R&D spaces become more important as product portfolios expand. More SKUs, more ingredients, and more package formats create more opportunities for variance, contamination risk, shelf-life failure, and label claim inconsistency. A modern beverage expansion in the United States should consider dedicated zones for incoming ingredient verification, microbiology support, analytical testing, bench formulation, pilot trials, retain sample management, and data review. For carbonated drinks, oxygen and CO2 checks matter. For juices and functional products, Brix, pH, viscosity, and thermal validation may be central. For dairy or aseptic products, environmental and microbiological controls become even more critical. Lab integration also improves commercial agility. When R&D sits too far from production, scale-up delays increase. When the lab is designed into the facility with proper sample pull points and pilot utilities, commercial launches move faster and with fewer surprises. The chart below reflects demand by beverage segment for upgraded quality and process infrastructure. Manufacturing capabilities and quality systems should be aligned. DPS supports beverage processing systems from fermentation to pasteurization to water treatment, which is valuable when a plant needs to connect R&D results directly to operating conditions on the floor rather than treating the lab as a separate function. Expansion is often justified by production demand, but the supply chain impact can be equally powerful. In the United States, freight costs, retailer service expectations, and risk of disruption have made regional manufacturing networks more attractive. A producer shipping from one facility in the Southeast to customers on the West Coast may find that adding regional capacity cuts delivered cost, improves freshness, and reduces service failures. Ports, rail corridors, and interstate access also matter. Beverage plants near Los Angeles/Long Beach, Savannah, Houston, Newark, Chicago, and Inland Empire logistics clusters often gain advantages in ingredient receiving or finished goods distribution. However, a lower-cost rural site can still win if outbound lanes, labor availability, and utility access align with the commercial map. For some brands, expansion can reduce logistics radius enough to offset a meaningful share of project cost over time. This is especially true for low-margin, high-weight products such as water, juice, and mainstream soft drinks, where freight can erode profitability quickly. When evaluating local suppliers and regional vendors, manufacturers should look beyond initial machine price. Assess installation support, domestic spare parts, controls compatibility, field service response time, and experience with FDA, SQF, or BRC expectations. In many cases, the best supplier network includes both national OEMs and specialized regional fabricators, especially in manufacturing centers across North Carolina, Wisconsin, Ohio, California, and Texas. Timeline and budget discipline depend on clarity of scope. The most common causes of cost overrun in U.S. beverage expansion are incomplete utility assumptions, underdefined controls integration, late layout changes, poor coordination between process and building trades, and unrealistic commissioning expectations. Best practice is to build the project around stage gates: concept validation, budget approval, detailed design freeze, procurement release, installation readiness, startup readiness, and performance acceptance. Each gate should include both technical and commercial review. A useful rule is to separate “required to operate” scope from “nice to have later” scope. Producers should also avoid locking into equipment before the utility basis of design is complete. A filler may look like the critical purchase, but a delayed transformer or boiler package can determine the actual go-live date. Another best practice is selecting a partner that can challenge assumptions. DPS has built its reputation in part by identifying when clients are about to spend heavily in the wrong place. In one example, a planned multi-million-dollar capacity investment was avoided when the true bottleneck proved to be PLC programming rather than mechanical equipment. That kind of honesty is financially valuable because it protects capital efficiency, not just construction activity. Across beverage projects, common winning patterns include regional co-packing transitions into owned production, brownfield line additions with phased utility upgrades, fast-track compressor and boiler expansions supporting canning growth, and integrated syrup room plus packaging expansions for high-volume soft drink operations. DPS has also supported large beverage infrastructure programs where the plant is designed to scale dramatically over time, including utility-intensive systems such as compressors, boilers, cooling towers, and full process support for multi-million-case operations. More project examples can be explored through the company’s project case studies. Disruptive Process Solutions serves manufacturers across all 50 U.S. states and Canada, with a strong focus on profitable capital execution in food and beverage environments. Rather than acting as a narrow equipment reseller, the company supports clients through engineering, capital planning, owner’s representation, project management, general contracting coordination, equipment supply, installation, and system integration. Its technical and project delivery services are summarized on the services page, while custom process assets including tanks and CIP systems are featured in its equipment portfolio. For beverage producers seeking a partner that can connect process design, manufacturing practicality, and schedule accountability, that integrated model is especially relevant. From a manufacturing capability perspective, DPS works across brewing, spirits, wine, kombucha, RTD, carbonated soft drinks, juices, dairy beverages, aseptic systems, and broader food processing categories. From a technology perspective, the team supports process design, controls, SCADA, utilities, thermal systems, refrigeration, water treatment, automation, and compliance-driven hygienic design. From a service perspective, the firm operates as a project-based execution partner built around planning, building, and managing capital projects with speed and transparency. The first step is identifying the real constraint: demand, process throughput, packaging speed, utilities, labor, warehouse space, or controls. Expansion should be based on verified bottleneck analysis, not assumptions. Most plants should design utilities and layout for at least one future phase beyond current need. Even if only one new line is installed now, room for added tanks, compressors, electrical distribution, and warehouse flow should be planned in advance. It depends on SKU mix, available floor space, utility capacity, and required uptime. If changeovers are the main issue, a second dedicated line may outperform a speed upgrade. If controls or ancillary equipment are limiting performance, optimizing the existing line may be the better investment. It is critical for products with sensitive ingredients, carbonation, thermal treatment, fermentation, or aseptic demands. Pilot validation reduces risk in process behavior, sanitation, and package performance before full-scale capital is committed. Compressed air and electrical service are commonly underestimated, followed closely by wastewater and chilled utilities. Sanitation loads and peak simultaneous demand are often missed in early estimates. Use phased construction, temporary utility bypasses, preassembled skids, planned shutdown windows, and commissioning outside peak production periods. Strong field coordination is essential. Functional beverages, RTD cocktails, sparkling and flavored waters, premium soft drinks, energy products, dairy alternatives, and high-value niche fermented beverages continue to drive investment. Expect stronger emphasis on automation, energy monitoring, water reuse, traceability, labor-saving packaging systems, domestic supply resilience, and compliance-ready digital records. Sustainability and operating cost reduction will increasingly be evaluated together. If outbound freight is high or service levels are inconsistent, a regional plant expansion can improve margins by shortening delivery radius, lowering safety stock, and improving replenishment speed to retailers and distributors. Ideally before equipment is selected. Early involvement helps align the business case, utility basis, layout, compliance strategy, schedule, and procurement plan so expensive redesigns are avoided later. In the United States, beverage factory expansion works best when engineering, operations, finance, and supply chain are treated as one decision. The winning plants of 2026 will not simply be larger. They will be more flexible, more automated, more utility-efficient, and better aligned with regional demand. A carefully planned expansion can improve capacity, lower delivered cost, reduce risk, and create a platform for profitable long-term growth. -
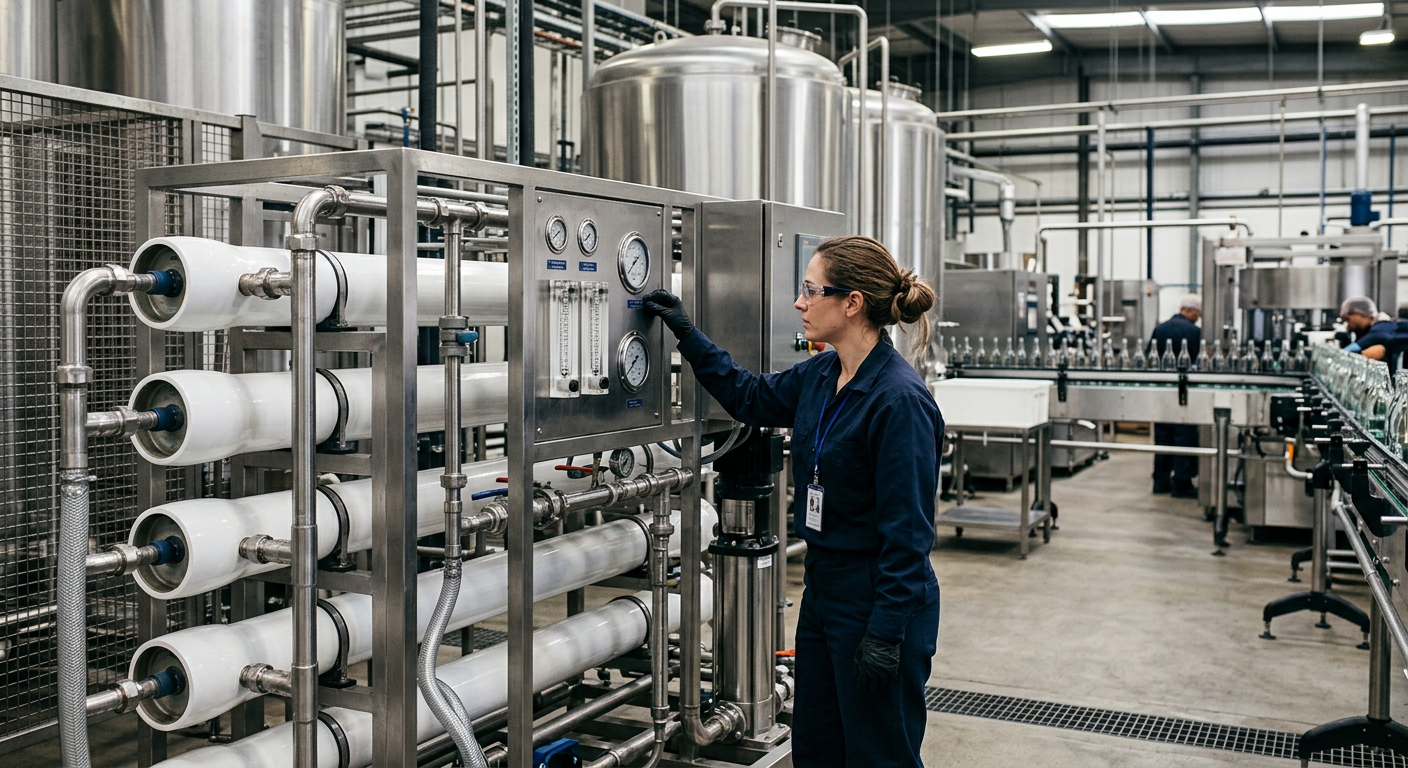
Food Plant Relocation Services
Relocating a food processing plant is not the same as moving general industrial machinery. In the United States, every phase of a food facility relocation must protect product integrity, employee safety, sanitation standards, and regulatory standing. A successful move involves hygienic dismantling, contamination control, temperature management, transport validation, utility coordination, recommissioning, and food safety verification before production restarts. For manufacturers handling protein, dairy, prepared foods, sauces, beverages, aseptic products, or shelf-stable items, the move must be engineered as both a capital project and a food safety event. Across major manufacturing corridors such as Chicago, Dallas-Fort Worth, Los Angeles, Fresno, Atlanta, Charlotte, Omaha, Kansas City, Philadelphia, and the Gulf Coast logistics network, companies relocate lines for expansion, consolidation, co-packing growth, automation upgrades, or proximity to distribution hubs, ports, and labor pools. Whether the destination is near the Port of Houston, the Inland Empire, the Research Triangle, or Midwest cold storage centers, the requirements remain the same: keep the process compliant, keep downtime under control, and restart production with validated performance. For manufacturers looking for a partner that can integrate engineering, installation, compliance, and execution, Disruptive Process Solutions approaches relocation as a business-critical manufacturing program, not just a rigging job. Its model emphasizes planning, process understanding, and profitability alongside technical delivery. Food plant relocation services in the United States combine sanitary engineering, equipment dismantling, transport, utility coordination, reinstallation, automation integration, and food safety validation. Unlike standard machinery moving, these projects must address hygienic zoning, FDA or USDA oversight, allergen controls, environmental monitoring, cold chain requirements, and restart qualification. The best relocation strategy uses a phased plan, detailed pre-move risk assessment, validated cleaning and decontamination, and full recommissioning at the new site to reduce downtime and protect compliance. The table above shows why relocation must be managed as a cross-functional manufacturing program. Every line item affects startup speed, operating cost, and regulatory exposure. A general industrial move is often judged by whether the machine arrives intact and runs again. A food facility move is judged by whether the process can restart without compromising food safety, label claims, shelf life, environmental controls, or inspection readiness. This difference changes every step of project planning. First, food plants contain hygienic design features that cannot be treated casually during teardown. Stainless surfaces, orbital welds, valves, CIP loops, sanitary pumps, heat exchangers, fillers, conveyors, and instrumentation all need handling methods that prevent damage, corrosion, and contamination. A scratch on a food-contact surface or a poorly protected gasket seat may create a sanitation problem after restart. Second, food and beverage lines often operate in controlled hygiene zones. Raw and ready-to-eat segregation, allergen separation, employee traffic flow, handwash and bootwash points, air pressure relationships, floor drainage, and environmental monitoring locations all matter. A relocation project must preserve or improve those protections in the new building. Third, many food manufacturers in the United States operate under overlapping compliance obligations: FDA preventive controls, USDA inspection requirements for meat and poultry, state departments of agriculture, SQF or BRC expectations, wastewater permits, boiler and refrigeration codes, and customer audit protocols. Moving the line without coordinating these approvals can delay launch far longer than the physical move itself. Fourth, a food relocation often includes process optimization. Manufacturers do not just move tanks, kettles, blenders, fillers, retorts, freezers, smokehouses, or pasteurizers; they typically reconfigure capacities, add automation, improve utilities, or eliminate bottlenecks. This is why the strongest relocation partners combine rigging and construction with process engineering and controls integration. In practical terms, a bakery line in Ohio, a protein facility in Arkansas, a dairy plant in Wisconsin, and a beverage operation in California all face different process hazards, but they share the need for sanitary execution. For that reason, smart buyers should prioritize a relocation team that understands both production and compliance. The line chart reflects the growing pace of capital repositioning in the U.S. market as manufacturers upgrade aging assets, shift closer to distribution centers, and adapt to labor and utility realities. Before a single bolt is removed, the project team should complete a pre-move hygiene risk assessment. This is the most important phase for protecting food safety and preventing startup delays. The assessment should identify where product residues, allergens, microbiological harborage, condensate risks, lubricant migration, insulation damage, or environmental contamination may exist. The process begins with a detailed asset inventory. Each piece of equipment should be classified by product contact, non-product contact, utility support, hygienic criticality, and restart dependency. Equipment histories matter here. A kettle that processed allergen-containing sauces, a depositor that handled dairy, or a slicer from an RTE protein room may require different controls than dry ingredient transfer systems. Layout and workflow mapping are equally important. The team should document current-state product flow, waste flow, maintenance access, forklift routes, compressed air drops, steam headers, glycol loops, CIP return paths, and electrical dependencies. In many projects, the move reveals opportunities to redesign sanitation pathways or reduce traffic crossover that previously created risk. Strong planning also includes utilities. Manufacturers frequently discover too late that the destination site has insufficient boiler capacity, wrong voltage, mismatched floor drains, inadequate trenching, limited hot water generation, or weak refrigeration infrastructure. These are avoidable mistakes when process engineering is involved early. Companies can explore broader relocation and integration support through food and beverage engineering services that connect facility planning with execution. This checklist is useful because it forces the team to separate cosmetic concerns from true sanitary and operational risks. In many relocations, the greatest delays come from issues that were visible before teardown but never documented clearly enough. Deep cleaning before dismantling is not optional. It is the baseline for safe disassembly, transport, storage, and reassembly. Equipment should be cleaned to a documented sanitary standard using procedures appropriate to the product type, line design, and regulatory environment. For wet processing lines, the sequence often includes product purge, gross soil removal, CIP or COP execution, rinse verification, sanitizing, drying where needed, and protected shutdown. For dry systems, cleaning methods may focus on vacuum removal, controlled disassembly, dry cleaning tools, and allergen validation. Protein and dairy systems may need intensified microbiological controls, while aseptic and retort lines demand more formal documentation. After cleaning, vulnerable openings should be capped, wrapped, or sealed with food-safe protection materials. Gaskets, elastomers, sensors, flow meters, load cells, and vision components should be removed or packed separately when needed. Lubrication points and exposed drives should be handled under written procedures to avoid residue transfer. Plants with strong sanitation cultures often use this stage to retire worn components. Replacing suspect hoses, cracked seals, damaged panels, or obsolete controls before the move can reduce startup surprises. Companies evaluating upgrade options may review integrated equipment solutions at process equipment offerings when the relocation includes new tanks, CIP skids, vessels, or line additions. The explanation here is straightforward: cleaning methods must match the process and the hazard. A universal cleaning approach is rarely acceptable in a food plant relocation. Not every relocation involves product in transit, but many involve temperature-sensitive assets, ingredients, starter cultures, enzymes, membrane systems, refrigerated vessels, insulation panels, or calibrated instruments that can be damaged by uncontrolled conditions. Cold chain integrity during relocation can be as important as hygienic protection. For refrigerated processing, freezer tunnels, blast chill systems, glycol skids, ammonia or CO2 refrigeration components, jacketed tanks, and temperature-controlled storage assets must be disconnected and transported under procedures that preserve mechanical integrity and insulation performance. Sensors and recording devices may require recalibration after arrival. If the move includes work-in-process inventory, retained samples, culture banks, or validation materials, the logistics plan should define storage temperatures, loading windows, data logging, contingency routes, and emergency contacts. Manufacturers relocating between distant regions, such as from Southern California to Texas or from the Midwest to the Southeast, should factor in climate changes, transit durations, and permitting differences. Ports and trade corridors matter too. Moves involving imported parts entering through Long Beach, Savannah, Newark, or Houston can affect timing for startup spares and replacement components. A cold chain disruption in transit may not show up until commissioning, when a valve seat fails or a seal leaks under process temperature. The bar chart highlights where relocation demand is strongest. Protein, beverage, and prepared food plants tend to generate more move activity due to line changes, capacity shifts, and distribution-driven facility decisions. Regulatory compliance can determine whether a moved line starts on time or sits idle. In the United States, compliance obligations depend on product category, kill step, labeling risks, sanitation exposure, and inspection model. A move can trigger updates to hazard analyses, preventive controls, sanitation programs, lot traceability, process authority documentation, and facility registrations. FDA-regulated plants should review the food safety plan, process flow diagrams, allergen controls, sanitation preventive controls, supply-chain records, recall procedures, and validation files. Any change in layout, utility design, or process sequencing can affect preventive control assumptions. USDA-inspected protein facilities may also need revised grant of inspection details, equipment approvals, SSOP updates, humane handling considerations where applicable, and direct coordination with in-plant personnel. Third-party schemes such as SQF and BRC also matter. Customer audits commonly focus on relocation change control, equipment condition, zoning, pest prevention, calibration, and startup release procedures. If the new site is larger or more automated, the documentation burden can increase rather than decrease. This is where technical capability becomes essential. A relocation partner with process, mechanical, electrical, controls, and utility expertise can ensure that the new site is not only physically assembled but operationally and regulatorily coherent. DPS, for example, supports food and beverage manufacturers with engineering across structural, mechanical, plumbing, electrical, process, and controls disciplines, including PLC programming and SCADA integration. That technical scope is highly valuable when a move includes utility upgrades, automation changes, or bottleneck removal rather than simple reinstallation. This table shows that compliance is not a separate workstream from construction and installation. It is woven through the entire move. Downtime is often the largest hidden cost in a food plant relocation. Lost sales, customer penalties, labor inefficiency, expedited freight, and inventory disruption can outweigh rigging and installation expenses. The best strategy is usually phased relocation rather than a single all-at-once move. A phased approach may include building and testing utilities at the new site first, moving non-critical systems early, creating temporary bypass production, relocating duplicate lines in sequence, or using contract manufacturing during the overlap period. In high-volume categories such as beverages, proteins, and ready meals, manufacturers may maintain partial output at the old facility while trialing startup at the new one. Phasing also gives the team time to complete training, SOP revisions, and automation debugging. When SCADA, recipe systems, batching logic, retort controls, or filler integration are involved, the value of staged commissioning becomes even higher. For many plants, the best relocation plan is not the fastest physical move; it is the fastest validated return to saleable production. Service capability matters here. DPS works as an engineering and project execution partner that can plan, build, and manage capital projects end to end. That includes project and program management, owner’s representation, general contracting support where licensed, and turnkey installation and system integration across utilities, process equipment, controls, and commissioning. This integrated service model is especially useful when downtime reduction depends on parallel workstreams rather than isolated contractors. From a buying standpoint, manufacturers should ask not only “How quickly can you move the equipment?” but also “How will you preserve supply continuity, labor readiness, and validated startup?” The second question is usually more important. The area chart illustrates a clear trend: U.S. manufacturers are increasingly favoring phased, engineered relocations over simple point-to-point machinery moves. Once the equipment arrives, the relocation enters its most scrutinized stage. Reassembly is not only a mechanical activity. It also includes utility tie-ins, alignment, controls verification, safety checks, calibration, sanitation release, and process qualification. Mechanical teams should rebuild equipment according to tagged disassembly records, torque requirements, seal replacement protocols, and hygienic design expectations. Electrical and controls personnel should confirm I/O, motor rotation, communication networks, HMI functions, interlocks, recipe logic, and alarm histories. Utility systems must be proven under load, especially steam quality, compressed air dryness, chilled water or glycol stability, and drainage behavior during washdown. After dry commissioning, food manufacturers should complete wet trials, CIP qualification where relevant, sanitation verification, environmental monitoring, and trial production with QA review. For thermal systems such as pasteurizers, UHT lines, retorts, and tunnel pasteurizers, process validation and instrument confirmation are critical. For aseptic systems, sterile boundary integrity and documentation become central to release. Manufacturing capability matters during this stage because some projects involve replacing or expanding vessels, custom CIP skids, marination systems, or cooking equipment rather than reinstalling only legacy assets. DPS supports these needs with in-house branded processing equipment such as tanks, CIP systems, marination tumblers, and cooking vessels, which can simplify fit-up and schedule coordination during relocation programs. A strong example of the value of engineering-led relocation comes from a Texas project in which a client initially expected to spend heavily on capacity expansion. Process review identified a controls bottleneck, and targeted PLC improvements unlocked additional output before broader relocation work proceeded. That kind of operational thinking can materially reduce capital waste and improve the business case for the move. Manufacturers evaluating similar outcomes can review project experience through food and beverage project case studies to see how relocation, integration, and optimization often overlap in real plant environments. Many food manufacturers still separate relocation into too many contractors: a mover, an electrician, a millwright crew, a refrigeration vendor, a controls integrator, a sanitation team, and an internal project lead struggling to align them all. That structure often looks cheaper on paper but becomes expensive when schedules slip, scope gaps appear, or no one owns startup performance. A turnkey relocation partner reduces risk by controlling interfaces. Engineering informs dismantling. Dismantling records inform reassembly. Utility design informs commissioning. Compliance documentation informs sanitation release. This continuity lowers change orders, reduces miscommunication, and shortens the time between equipment arrival and validated production. Cost savings come from several places: fewer duplicate site visits, better pre-buy planning, more accurate utility loads, smarter upgrade timing, coordinated trade sequencing, and faster problem resolution. There is also strategic value. A good partner can tell the client when not to spend money, when to retrofit instead of replace, and when to relocate only selected assets rather than the full line. For U.S. manufacturers, especially those with multi-state operations, a national reach matters. A partner familiar with food and beverage categories across all 50 states and Canada can better manage regional permitting, labor coordination, freight lanes, and site conditions. This is particularly important for clients operating across the Carolinas, California, Texas, the Midwest protein belt, or cross-border supply chains. Buying advice is simple: choose a partner that understands your product, your compliance framework, your utilities, and your business model. If the provider cannot discuss CIP strategy, allergen validation, USDA implications, controls sequencing, and first-year profitability in the same conversation, that provider may not be suited for a food plant relocation. The comparison chart shows why turnkey execution usually outperforms fragmented models in high-compliance food environments. Single-point accountability has a major impact on schedule certainty and startup quality. How long does a food plant relocation usually take in the United States?Small line moves may take a few weeks, but full plant relocations often require several months of planning and staged execution. Complex projects involving utilities, refrigeration, automation, or USDA/FDA coordination can extend beyond that. What products most commonly require specialized relocation planning?Protein, dairy, ready-to-eat foods, sauces, beverages, aseptic products, frozen foods, and allergen-sensitive lines usually need the most detailed planning because of sanitation, temperature, and validation demands. Can a food plant move while staying in production?Yes, often through phased relocation, parallel lines, temporary co-manufacturing, or utility-first staging. The right model depends on SKU complexity, customer service requirements, and available duplicate assets. What is the biggest mistake manufacturers make during relocation?Treating the move as a rigging project instead of a food safety and operations project. The physical move is only one part of success; compliance, sanitation, utilities, controls, and startup validation are equally important. Do I need to revalidate cleaning and food safety programs after a move?In most cases, yes. Layout changes, utility changes, and altered equipment conditions can affect hazard analyses, sanitation procedures, allergen controls, and environmental monitoring plans. How do I choose between moving old equipment and buying new equipment?Compare the condition of the asset, cleaning design, spare parts availability, labor efficiency, automation compatibility, and expected throughput after the move. In some cases, partial replacement creates a better payback than moving everything. What should be included in a relocation partner’s scope?Ideally: pre-move assessment, engineering review, hygienic dismantling, packaging, logistics coordination, utility planning, reinstallation, controls integration, commissioning, startup support, and documentation handoff. Why are 2026 trends important for planning a move today?Because current relocation decisions should support future requirements. By 2026, manufacturers are expected to face stronger pressure around energy efficiency, water reuse, digital traceability, resilient domestic supply chains, and more auditable sanitation and process data. Smart relocations now include automation readiness, sustainability targets, heat recovery options, utility metering, and flexible layouts that can adapt to new product mixes. What future trends are shaping food facility relocations?Three trends stand out for 2026 and beyond: more use of SCADA and remote diagnostics during commissioning, stronger policy attention on food safety documentation and sustainability, and rising demand for modular utility systems that speed deployment. Manufacturers are also prioritizing wastewater strategy, refrigeration efficiency, and packaging line flexibility. Is local market knowledge important?Absolutely. Labor conditions, permitting timelines, freight access, and trade infrastructure vary by region. A move into Houston differs from one into Fresno, Chicago, Charlotte, or the Inland Empire. Access to local trades and understanding of regional utility and inspection realities can shorten the schedule significantly. For food and beverage companies in the United States, the most successful relocations are the ones planned with the end state in mind: safer product flow, stronger compliance, lower operating cost, and faster profitable production. That is why a relocation project should be approached not as a one-time move, but as a chance to improve the entire manufacturing system. -
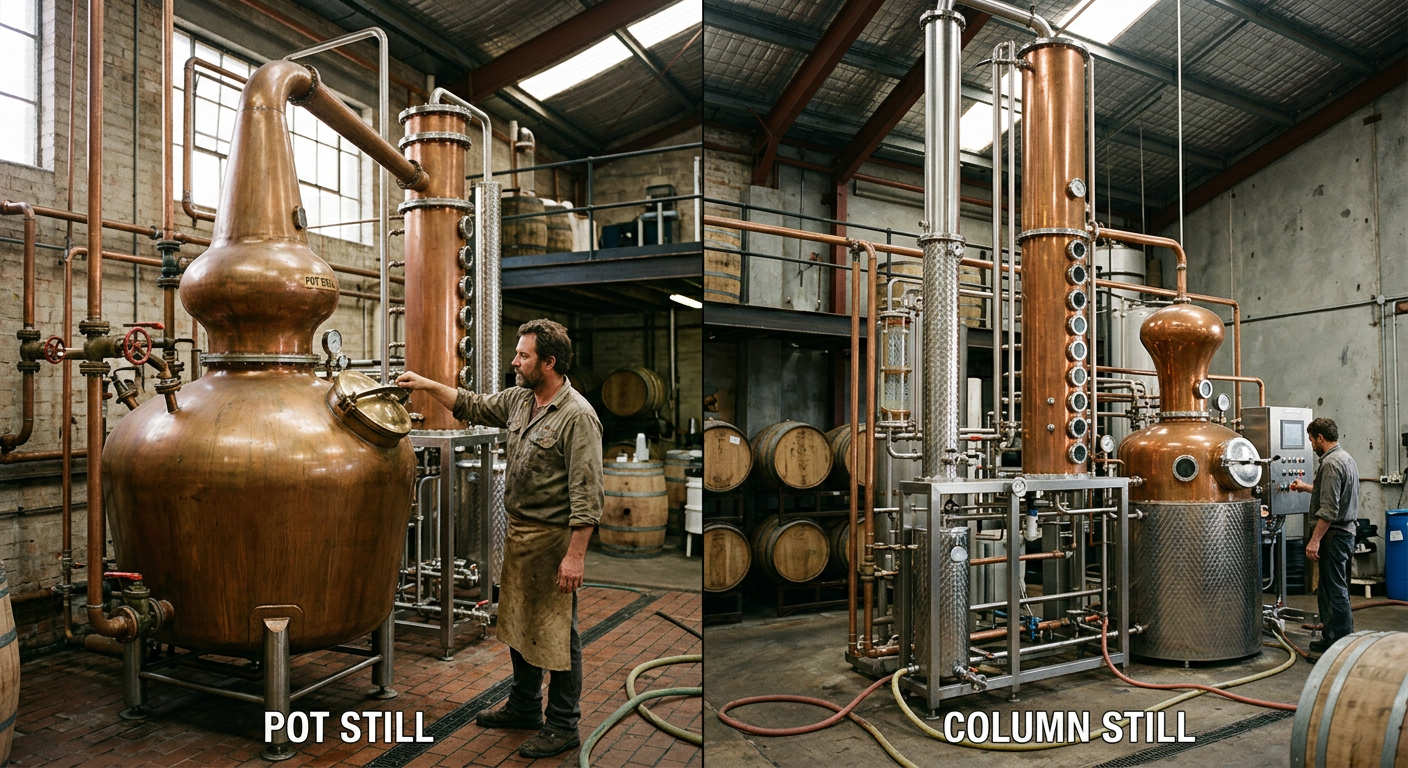
Beverage Plant Relocation Services
Relocating a beverage facility is far more complex than moving standard industrial machinery. A successful beverage plant relocation in the United States must protect product quality, preserve sanitary design, maintain utility compatibility, manage deadlines tied to production schedules, and reduce downtime from shutdown to restart. Whether the project involves a brewery in Denver, a juice line in California, a carbonated soft drink plant near Atlanta, or an aseptic filling operation in Texas, the relocation plan must be built around process risk, regulatory requirements, and return on capital. For U.S. beverage manufacturers, plant moves are often triggered by mergers, capacity realignment, co-packing growth, lease changes, regional demand shifts, or strategic moves closer to ports such as Houston, Long Beach, Savannah, Newark, or Norfolk. In many cases, the best answer is not simply to buy new equipment. Reusing proven assets can be the smarter financial decision when engineering review, transport protection, utility redesign, and commissioning are handled correctly. That is why companies often look for partners with process engineering depth, field installation control, and project management discipline rather than basic rigging alone. Disruptive Process Solutions supports these kinds of capital-intensive transitions across the United States and Canada through an integrated design-build-manage approach. Instead of treating a move as disconnected rigging, freight, and reinstall tasks, the work is organized as a full operating project: process review, dismantling, logistics, reinstallation, startup, documentation, and training. You can learn more about the firm’s background on the company overview page, its broader project support on the services page, its process hardware capabilities on the equipment page, and examples of execution on the case studies page. A beverage plant relocation is the planned dismantling, transport, reassembly, and restart of beverage processing and packaging assets at a new site. In the United States, the most successful relocations are led by teams that understand process systems such as carbonation, blending, pasteurization, HTST, UHT, clean-in-place, utility tie-ins, fillers, can lines, bottling lines, keg systems, and aseptic equipment. The goal is not just to move equipment, but to restore validated operation safely, quickly, and profitably. The key buying advice is simple: choose a relocation partner that can handle engineering, utility mapping, sanitary installation, controls integration, and startup support in addition to rigging and freight. Beverage equipment contains sensitive seals, instruments, fillers, heat exchangers, valves, and controls that can be damaged or misaligned if moved without process-specific preparation. In regulated environments, poor documentation can be just as costly as physical damage. The table above shows why beverage relocation decisions should be made at the business-system level, not just at the transportation level. Capital efficiency depends on how well the old asset is adapted to the new facility. Beverage manufacturing includes one of the widest ranges of process conditions in food production. A craft brewery may focus on fermentation tanks, bright beer tanks, glycol loops, and kegging. A carbonated soft drink site may prioritize syrup rooms, in-line blending, deaeration, carbonation, and high-speed canning. A dairy beverage or protein shake facility may involve homogenization, heat treatment, and cold-chain design. An aseptic operation adds sterile boundaries, validated pathways, packaging integrity, and stricter environmental controls. CO2 systems require special attention because storage tanks, vaporizers, regulators, piping, and carbonation skids involve pressure considerations and product quality implications. Improper reinstallation can affect dissolved gas control, foaming behavior, and package consistency. Aseptic lines carry even higher risk. Sterile tanks, UHT systems, aseptic fillers, sterile air systems, and barrier controls often require more than mechanical reinstall; they require restoration of validated functional conditions and microbiological control strategy. There are also regional infrastructure differences across the United States. A relocation from Milwaukee to Charlotte may involve different utility standards, floor loading assumptions, local code interpretations, labor availability, and freight corridors. A move from a port-adjacent California site to inland Arizona may change lead times, water quality assumptions, and environmental permitting needs. Facilities receiving equipment in Chicago, Dallas, or Nashville often need a detailed review of plant layout, dock access, and crane or gantry restrictions. DPS approaches these variables with multidisciplinary technical capability. Its teams work across structural, mechanical, plumbing, electrical, process, and controls disciplines, with experience in carbonation, blending, water treatment, pasteurization, aseptic processing, fermentation, and utility infrastructure. That matters because beverage relocation is rarely a one-trade job; it is a system reintegration project. This comparison highlights why “beverage” is too broad a label for move planning. Each category has a different failure mode, and the relocation plan should reflect those realities. The line chart reflects realistic market growth drivers: reshoring, co-packing expansion, portfolio rationalization, and the push to redeploy assets rather than replace them immediately. Good relocation outcomes are often decided before the first truck leaves the original facility. Dismantling must be sequenced around product residues, lockout/tagout, utility isolation, fluid removal, sanitary cleaning, and preservation of critical machine references. Equipment should be photographed, tagged, measured, and mapped to a relocation bill of materials. Instrument loops, I/O points, valve clusters, and hose sets should be identified before disassembly begins. Transport-safe packaging is especially important for fillers, depalletizers, seamers, labelers, pasteurizers, heat exchangers, membrane systems, control panels, VFDs, load cells, and specialty valves. Stainless surfaces can be scratched, sensors can be shocked, and alignment can be lost from vibration. A simplistic shrink-wrap approach is rarely enough. Sensitive components often need custom crating, desiccants, shock indicators, corrosion protection, and internal bracing. For beverage producers moving between states such as California, Texas, Ohio, and North Carolina, long over-the-road transport can expose equipment to moisture, impact, and thermal swings. International moves into the United States from Canada or Mexico add customs and border timing considerations. In both cases, the packaging method should match transport duration, mode, and sensitivity. The explanation here is practical: packaging is not an accessory cost. It is an insurance policy for line performance at the destination. The more specialized the beverage system, the more valuable disciplined preservation becomes. Plant relocation logistics are usually more complex than a single pickup and delivery. Many projects involve multiple source locations, temporary warehousing, overseas or cross-border freight, crane appointments, escorts for oversized loads, and destination readiness issues. A carbonated line may leave one plant in St. Louis, collect spare parts from a warehouse in Indianapolis, receive controls components from Ontario, and land at a new site in Phoenix. Without strong coordination, one late truck can delay a full startup sequence. Customs management is especially relevant for moves between the United States and Canada. Harmonized codes, documentation packs, equipment serial records, declarations, and inspection timing must be aligned well in advance. For imported or previously used machinery entering the U.S., supporting documents may also be needed for sanitation, electrical conformity, and ownership verification. Port and inland route planning matters when shipments move through Los Angeles/Long Beach, Houston, Seattle, Detroit, Buffalo, or Newark corridors. Deadline management should also reflect commercial reality. Beverage manufacturers often work against summer peaks, holiday demand, promotional launches, and retailer reset calendars. A delay of two weeks can carry a much larger revenue impact than the transportation invoice itself. This is why experienced project teams create critical path schedules tied to shutdown windows, civil readiness, utility installation, controls integration, dry commissioning, wet commissioning, and first-sale timing. The demand chart shows that relocation activity is spread across beverage categories, with aseptic ready-to-drink and carbonated products remaining particularly active due to growth, portfolio change, and asset optimization. Reassembly is where relocation becomes an operating asset again. The best field teams rebuild the process with attention to mechanical fit, utility alignment, instrumentation, hygienic weld quality, slope and drainability, electrical termination, and control logic integrity. This stage often includes modifications needed to adapt older equipment to a new line layout, throughput target, or packaging format. Commissioning should progress in layers. First comes mechanical completion and punch listing. Then dry functional checks confirm motors, valves, sensors, conveyors, safety devices, and communications. Wet testing follows to verify pumps, CIP paths, heat transfer, temperatures, pressure behavior, flow rates, and leak integrity. Product trial runs should then confirm package quality, changeover capability, reject handling, and throughput stability. Aseptic lines may require additional sterile integrity and validation steps before commercial release. This is also where technical capability matters most. DPS brings process and controls expertise that extends beyond rigging: PLC programming, automation, SCADA support, utility integration, water treatment, blending, carbonation, fermentation systems, pasteurization technologies, and aseptic process knowledge. That breadth helps avoid the common failure mode where equipment is physically installed but not truly production-ready. The table shows why startup should be treated as a disciplined sequence rather than a single event. The handoff from installation to production must be measurable. Documentation is one of the most undervalued elements in a plant move. Yet in many beverage projects, it determines how quickly operators, maintenance teams, sanitation crews, and quality staff can regain control of the line. A professionally relocated system should include updated P&IDs, equipment lists, utility maps, panel schedules, cable references, spare parts lists, startup procedures, cleaning instructions, and changeover guidance. Operator training should be tailored to the new plant, not copied from the previous one. Even when the equipment is the same, the line may have new routing, revised control sequences, different utilities, modified CIP logic, or different bottle/can formats. Maintenance staff should also receive practical training on sensors, wear components, lubrication points, troubleshooting, and restart recovery. For aseptic or sanitary systems, quality and sanitation teams need clear retraining on hygienic zones and critical control points. In the United States, beverage companies increasingly prefer project partners who can support both physical installation and knowledge transfer. That is especially important when experienced staff do not fully transfer to the new site or when a co-packer is bringing on new operators quickly. The area chart reflects a strong trend toward digital turnover packages, remote support records, and standardized training content. By 2026, this is becoming expected rather than optional in advanced beverage relocations. One of the biggest strategic questions in a beverage plant relocation is whether to move existing assets, buy used replacements closer to the destination, or invest in new equipment. The answer depends on age, sanitary condition, controls obsolescence, throughput, spare parts availability, packaging format needs, and the commercial timeline. There is no universal rule, but there is a disciplined way to decide. Relocation often makes financial sense when the equipment is mechanically sound, process-fit for future volumes, and not burdened by severe obsolescence. New investment may be better when the line cannot meet required speed, package flexibility, energy standards, or sanitary expectations. In many real projects, the smartest path is hybrid: move tanks, utilities, and selected process skids while replacing outdated fillers, controls, or package-handling sections. DPS often acts as a business-minded engineering partner in this decision process rather than simply pushing spend. That perspective matters. Sometimes a targeted controls or process upgrade releases capacity without major new capital. Other times, relocation is justified because the existing system still has meaningful economic life and can be integrated into a more profitable plant design. This table is useful as a buying framework. The “best” option depends on total cost of ownership, time to revenue, reliability risk, and strategic flexibility. Safety must govern every phase of a beverage plant move. That includes lockout/tagout, fall protection, confined space entry, rigging plans, forklift routes, crane lifts, elevated work platforms, electrical isolation, chemical handling, pressure systems, and sanitary chemical residues. OSHA compliance is the baseline, but beverage projects also need alignment with food safety programs, site GMPs, and often customer audit standards. For alcohol production, combustible environments and ventilation may require additional review. For dairy and aseptic systems, sanitary integrity and cleaning validation are especially important. For large tank farms and utility systems, structural review, anchoring, seismic considerations in states such as California, and pressure testing may also be needed. When a project spans multiple states, local permitting and contractor rules can vary significantly. Service capability matters here as much as technical capability. DPS operates as an end-to-end engineering and project execution partner, offering process design, capital planning, owner’s representation, project management, general contractor functions where licensed, equipment supply, installation, integration, and commissioning. That full-scope model helps clients reduce the handoff gaps that often create safety and compliance failures during complex plant moves. The explanation is straightforward: compliance is not a post-install checkbox. It should be embedded in the schedule, budget, work packs, and acceptance criteria from the beginning. Consider a realistic U.S. case: a beverage producer needed to relocate a mixed-use line from the Midwest to a new Southern facility serving faster-growing regional demand. The system included storage tanks, blending, a carbonation skid, CIP, conveyors, and package handling. The commercial goal was to restart production before peak seasonal demand with minimal customer disruption. The relocation strategy began with a front-end audit covering asset condition, utility loads, layout fit, controls backups, and spare parts gaps. The team divided equipment into three categories: move as-is, move and modify, and replace. Shutdown sequencing was built around remaining customer orders so that upstream preparation started before final production ended. Dismantling used detailed tagging, photo records, and preservation steps for instruments, valve clusters, and control panels. On the destination side, utilities and foundations were prepared before the first truck arrived. Parallel workstreams handled rigging, piping, electrical installation, and controls. Dry commissioning began as soon as the first modules were complete rather than waiting for the entire line. Operator training started during installation and continued through wet trials. Because critical-path decisions were made early, the plant moved from first energization to first saleable output significantly faster than a traditional sequential approach. This model reflects how experienced relocation teams minimize downtime: early engineering, selective modernization, destination readiness, and disciplined startup sequencing. It also shows the value of manufacturing capability. DPS not only supports integration of third-party machinery, but also designs and manufactures selected process equipment such as tanks and CIP systems. That can be valuable when a relocated line needs supplemental hardware, replacement skids, or fit-for-purpose modifications without waiting on long OEM lead times. The comparison chart illustrates a common market reality in the United States: logistics vendors and riggers can be valuable contributors, but they are not substitutes for a true process relocation partner when the system is complex. How long does a beverage plant relocation usually take in the United States?It depends on scope. A limited skid move may take a few weeks, while a full production line or multi-system plant relocation can take several months including planning, dismantling, transit, reinstall, and commissioning. Projects tied to building readiness or major utility changes typically need more lead time. Is it cheaper to relocate beverage equipment than buy new?Often yes, but not always. If the assets are in good condition and still meet future production needs, relocation can be much more cost-effective. If the equipment is obsolete, too slow, or difficult to support, new investment may create better long-term value. Can carbonation and CO2 systems be relocated safely?Yes, if pressure components, regulators, gas piping, controls, and temperature-sensitive elements are properly isolated, preserved, tested, and recommissioned. These systems should always be handled by teams familiar with beverage gas control and plant safety. Are aseptic lines harder to move than standard beverage lines?Yes. Aseptic systems require higher control over sterile boundaries, documentation, validation, and startup protocols. The reinstall is not just mechanical; it must restore sanitary and sterile performance expectations at the destination facility. What documents should I ask for during a relocation project?Request equipment lists, tagged photo records, shipping manifests, control backups, updated P&IDs, utility maps, installation records, startup procedures, training materials, punch lists, and acceptance documents. What industries benefit from beverage plant relocation services?Breweries, distilleries, wineries, juice producers, functional beverage brands, carbonated soft drink manufacturers, dairy beverage plants, kombucha operations, ready-to-drink manufacturers, and co-packers all benefit from professional relocation support. What should I look for in a U.S. relocation partner?Look for process engineering capability, sanitary installation experience, controls knowledge, project management discipline, multi-site coordination strength, startup support, and documented safety performance. The best partners can advise whether to move, modify, or replace equipment based on business value rather than just scope volume. Why do manufacturers choose a company like DPS?Because the project often needs more than transport. It needs engineering judgment, technical integration, field execution, and startup accountability. DPS supports beverage and food manufacturers across North America with a lean, experienced team focused on profitable capital outcomes, rapid decision-making, and practical execution aligned with the client’s long-term business goals. What are the key 2026 trends affecting beverage relocations?Three trends stand out. First, automation and digital documentation are becoming standard, including remote diagnostics, PLC modernization, and data-driven commissioning. Second, policy and compliance pressure is increasing around worker safety, energy use, traceability, and food system resilience. Third, sustainability is shaping decisions more strongly, with companies reusing viable equipment, improving water and energy efficiency, and redesigning utilities to reduce waste and carbon intensity. In summary, beverage plant relocation in the United States is a specialized project type that sits at the intersection of manufacturing strategy, process engineering, installation quality, and commercial timing. From CO2 systems to aseptic lines, from dismantling and crating to customs, reassembly, training, and startup, every phase affects the speed and profitability of reopening. Companies that approach the move as a full-system capital project, rather than a transport event, are far better positioned to protect production continuity and maximize the value of existing assets.


