Disruptive Process Solutions Home

Brand-to-Factory Planning

Compare continued contract manufacturing, a phased owned facility and a full new plant using the same product, demand and cash-cost boundary.

Discuss Your Project
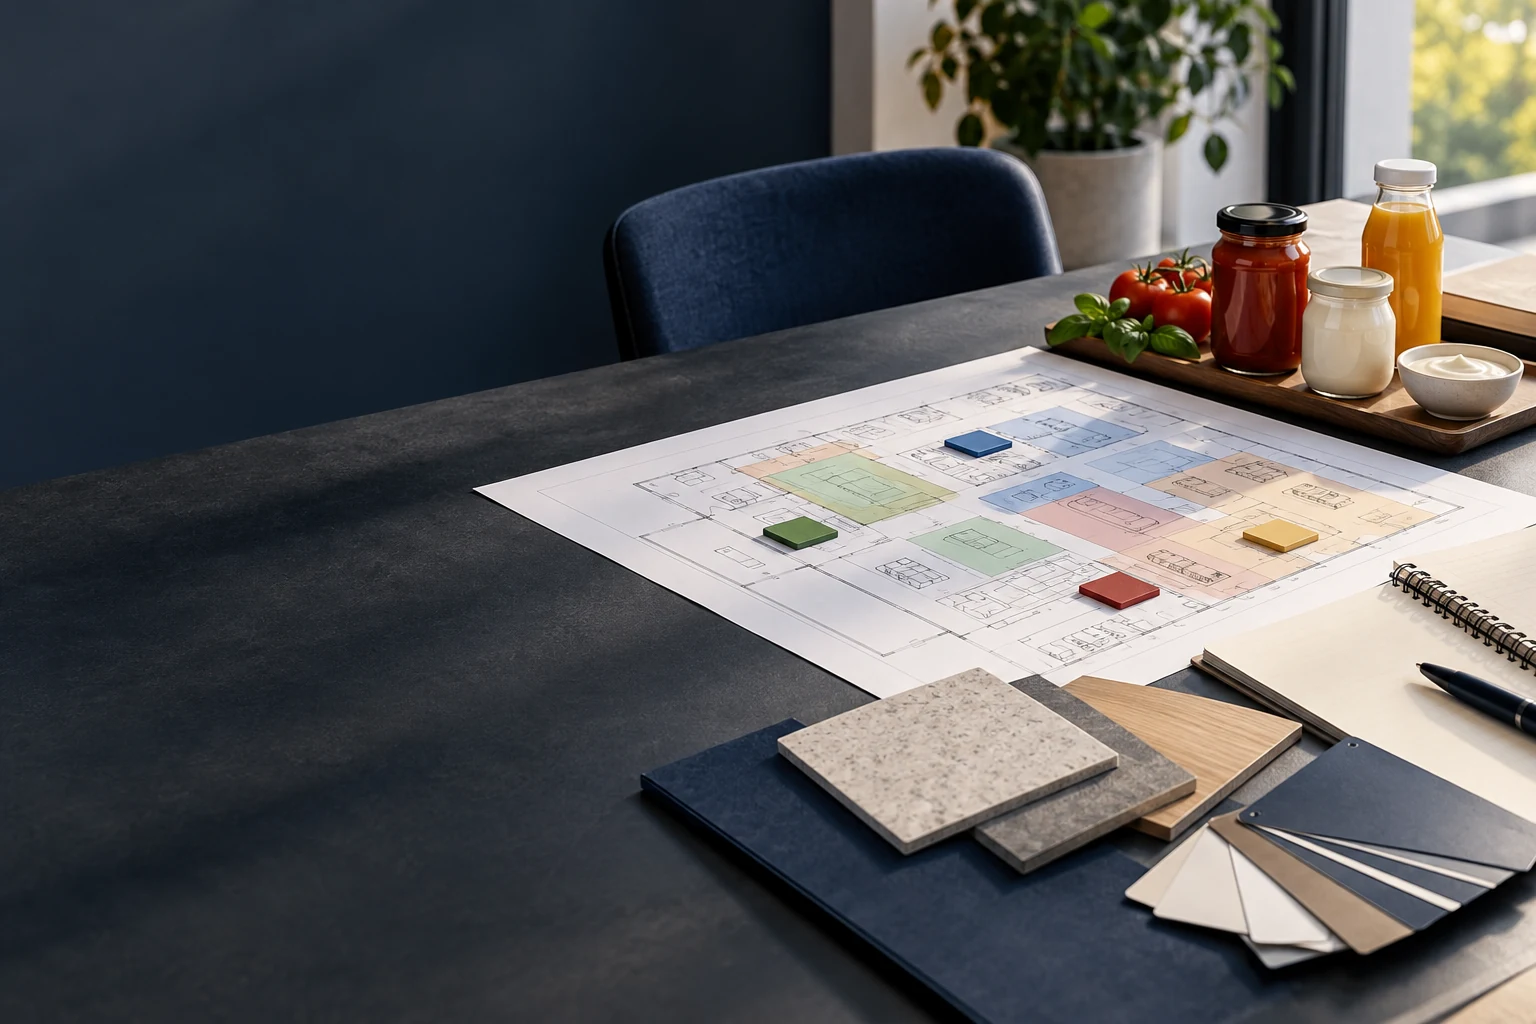
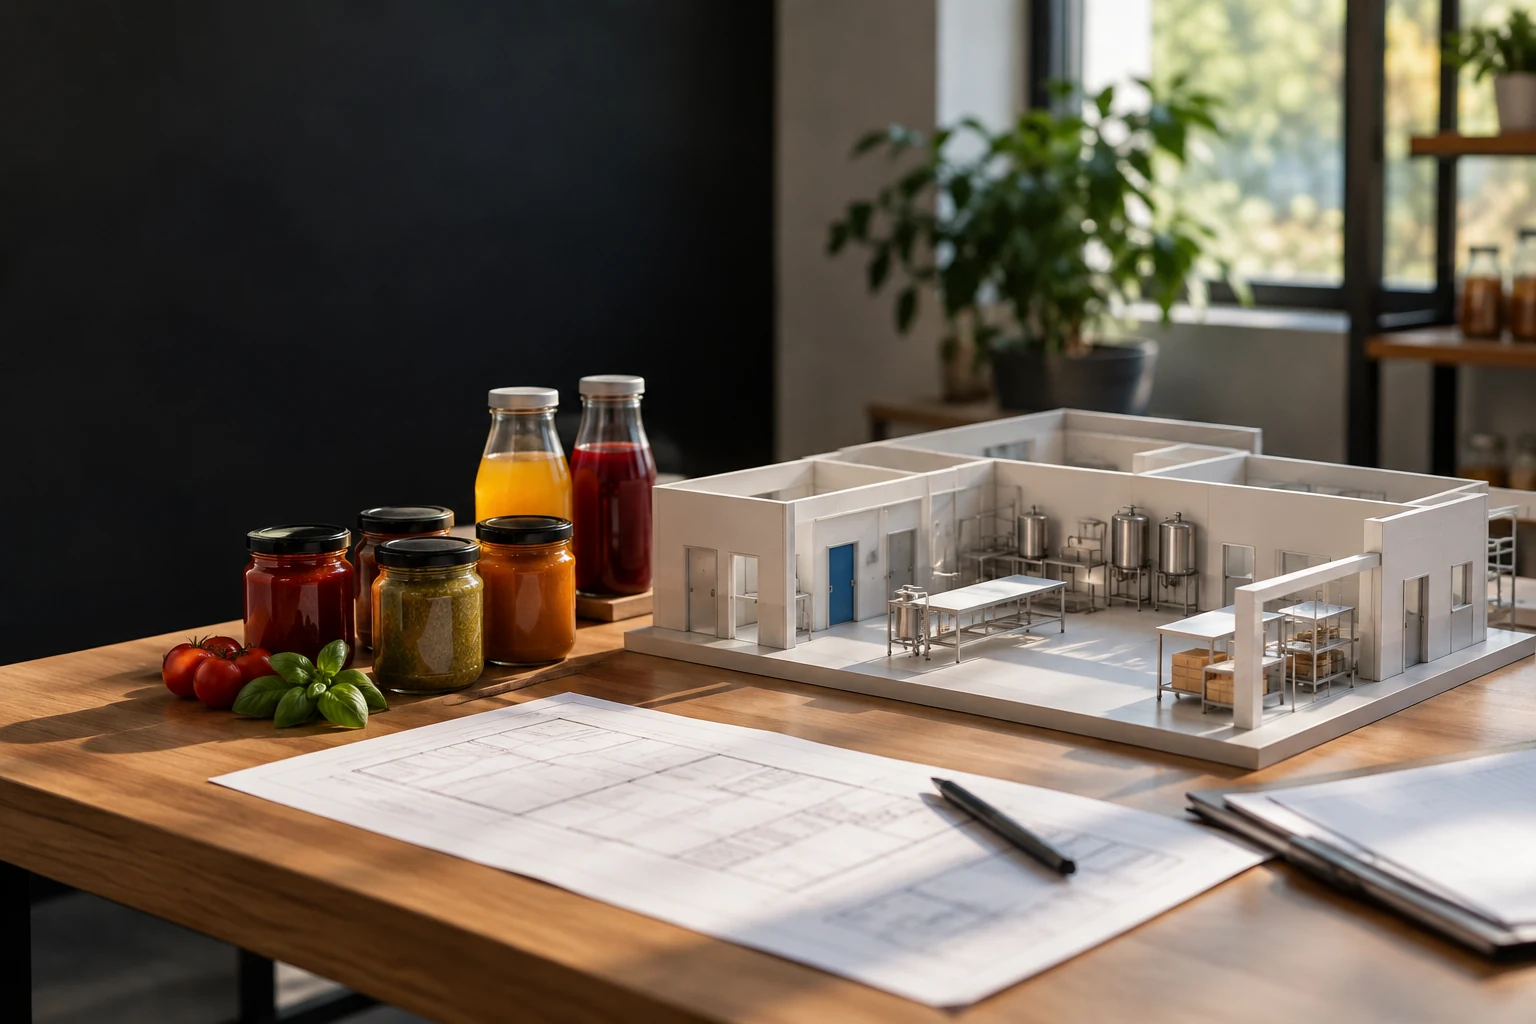
Unbranded bottled beverages moving through a contract packaging line
Unbranded functional beverage and juice samples with ingredient context

Compare Your Operating Models

Continue with Contract Manufacturing

Document current fees, material ownership, minimum runs, freight / storage, qualification, lead time and true service constraints. The existing alternative has costs and advantages that should be represented fairly.

Phased or Shared Owned Operation

Consider which accepted process steps can be internalized while specialist production or packaging remains external. Price additional transport, coordination, trials and duplicated fixed costs.

Full First Factory

Define all ingredient, process, package, site, utility, staff, quality, maintenance and customer-service responsibilities. Owned capacity creates fixed costs and funding requirements even when orders are below plan.

From Brand to Operating Plant

Use the same accepted product, package and demand for outsourced and owned alternatives.

  1. Define commercial demandCommitment, mix and downside.
  2. Specify product / packageQualified route and release.
  3. Map current service costsFees, logistics and ownership.
  4. Agree owner readinessPeople, systems and capital.
Resolve before procurementDo not compare retail revenue with a co-packer fee; brand sales may be common to both alternatives.

Translate the product / OEM requirement into a viable building, utility and operating plan.

  1. Select feasible siteServices, flow and fit-out.
  2. Define complete packagesProcess, treatment and filling.
  3. Budget fixed operationStaff, occupancy and service.
  4. Fund launch and stockTrials, ramp and working capital.
Resolve before procurementEquipment purchase price is only part of first-factory funding.

Coordinate qualification, operator readiness, supplier tests and commercial transition before transferring customer demand.

  1. Freeze supplier interfacesOwner, DPS and specialist OEMs.
  2. Plan training / proceduresOperating and quality readiness.
  3. Run qualified trialsActual recipes and packages.
  4. Ramp against evidenceAccepted output and real orders.
Resolve before procurementAn installed line is not an automatically ready manufacturing organization.

Define the Factory Scope

Review each system by its operating duty and the interfaces to be agreed before procurement.

System Duties & Supplier Responsibilities

Equipment Duties, Utilities and Supplier Responsibilities.

Swipe horizontally to compare all columns ↔

Select by operating duty and agreed supplier scope
SystemOperating dutyRelevant DPS guideConfirm before purchase
Investment alternative assessmentAlternative and all-in funding assessment.Capital planning ↗Same product / demand and explicit counterfactual.
Process / line design basisProduct / package and complete process design basis.Process engineering ↗Qualified supplier responsibilities and site feasibility.
Process utilities and distributionComplete plant process / cleaning services.Utility infrastructure planning ↗Source, distribution, site fit-out and future phases.
Specialist equipment interfacesSelected specialist equipment and owner organization.Installation & integration ↗Acceptance, training, product trials and operating readiness.

Engineering the Manufacturing Operation

Start with the business outcome

A brand should consider an owned factory when the commercial, product and operating model can support the entire asset and overhead base. DPS can discuss scoped feasibility, process engineering, equipment / OEM interfaces, utilities, project delivery and startup planning. The reason to engage is to compare viable alternatives before buying machinery, not to assume that removing a co-packer fee automatically creates a better return.

Confirm the exact brand-to-factory product, preservation route and project suitability with DPS before assigning a delivery scope. Confirm the product / package, specialist process, quality / release, site / licensing and owner operating responsibilities before project commitment. This guide is an assessment framework, not evidence that DPS approves the brand’s formula, guarantees customer demand or supplies every specialist machine.

Commissioning Tests and Performance Acceptance.

Agree a Matched Supply Alternative

Document current contract fees, material ownership, service constraints and actual demand alongside the equivalent owned-factory process and package boundary.

Verify Facility and Operating Readiness

Confirm site, utilities, specialist equipment, staffing, quality, maintenance and supplier acceptance responsibilities for the selected ownership or phased model.

Test the Launch and Funding Basis

Reconcile demand downside, ramp-up, working capital and retained external supply before committing to the operating plan.

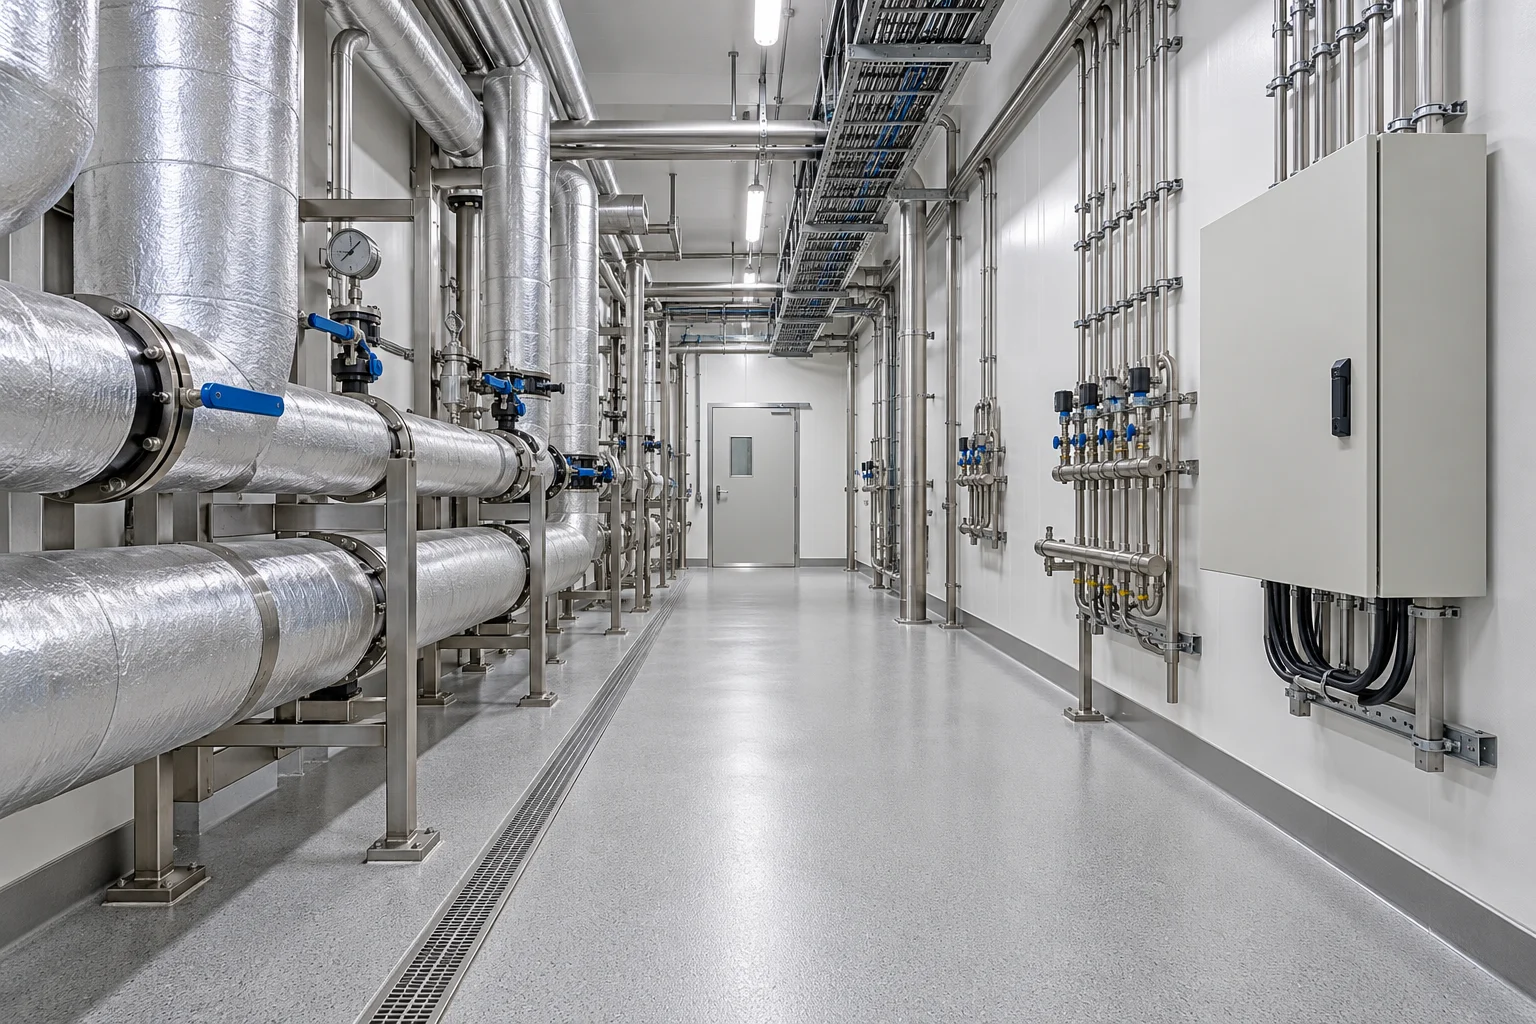
Industrial refrigeration equipment and food factory utility distribution

Plan Your Project

Review the scope, cost assumptions and operating case for your project. The examples and calculators below support early planning and are not DPS quotations.

Compare Site, Staging and Complete Operating Scope.

Price the actual outsourced service and feasible staged internalization at the same accepted product and volume. Include logistics, duplicated work, qualification and quality responsibilities.

Investment boundaryAn incremental insourcing case subtracts the full cost of the current alternative; the standalone factory calculator below must not be mislabeled as that difference.

Define the whole operating organization, qualified product / package route, equipment, site, utilities, staff, service and realistic demand.

Investment boundaryThe default below is standalone new-factory screening: historical savings are zero, and all additional fixed operation and launch funding are included.

High External Conversion Fee, Underused Owned Capacity and Operating Value.

Swipe horizontally to compare all columns ↔

Value-driver and responsibility map
Observed conditionMeasure before designDPS / team decisionEconomic basis
High external conversion feeMatched fee / ownership / service cost and actual volume.Compare owned variable and fixed costs on the same scope.Incremental insourcing difference, not total brand revenue.
Underused owned capacityDemand downside, shifts and fixed operating burden.Compare staged capacity and outsourcing continuity.Cash need, ramp and utilization exposure.
Incomplete capital estimateProcess / OEM, site, utilities, trials and inventory list.Build an all-in owner budget.Full initial funding rather than machine amount.
Launch / operating readinessStaff, quality, maintenance and supplier acceptance gates.Coordinate phased startup and retained supply.Actual transition cash and accepted commercial output.

Compare Outsourcing and Factory Ownership

Swipe horizontally to compare all columns ↔

Project Scope Comparison
DecisionContract ProductionOwned Facility
Production ResponsibilityDefine supplier qualification, service terms and retained brand responsibilities.Include process, package, site, staffing, quality and maintenance duties.
Volume and FlexibilityCompare minimum runs, lead time and actual customer demand.Plan utilization downside and fixed costs, including phased alternatives.
Launch FundingInclude fees, freight, storage and the agreed material-ownership model.Include installed scope, ramp-up and working capital on the same cost boundary.

Co-Packing vs in-House Manufacturing: Compare Incremental Costs on the Same Volume.

This separate hypothetical comparison holds brand sales and materials constant; they cancel from the insourcing decision. The standalone factory calculator uses full product contribution and therefore answers a different question. Do not add the two results. Example: 1,400,000 good kg/year, external conversion fee $1.20/kg, internal incremental conversion cost $0.55/kg and owned fixed cost $900,000/year.

Swipe horizontally to compare all columns ↔

Illustrative annual insourcing cost difference / USD
Matched cost boundaryContinue co-packingOwned operation
Conversion variable cost1,400,000 × $1.20 = $1,680,0001,400,000 × $0.55 = $770,000
Additional owned fixed operationNo new factory fixed cost assumed in this narrow comparison$900,000
Total compared annual conversion cost$1,680,000$1,670,000
Steady annual cost differenceCurrent alternativeOnly $10,000 lower before additional logistics / differences
Material, brand sales, qualification and logisticsUse actual ownership / contract costsInclude any differences separately; do not assume they cancel if different
Investment implicationNo new owned-plant capital in this comparisonA $10,000 annual difference does not justify the separate $5,725,000 standalone capital by itself

First Food Factory Investment: Equipment, Fit-Out and Launch Funding.

Compare proposals with the same product duty, supplier boundaries and acceptance basis. The amount below is a transparent planning example, not a market price range, supplier estimate or DPS quotation.

Illustrative scope-based budget / USD
Cost bucketAssumed amount
Product / process and interface engineering$360,000
Defined configured / OEM component allowance$1,260,000
Mechanical / electrical field installation$690,000
Instrumentation and control integration$360,000
Commissioning and acceptance support$210,000
Training, documentation and closeout$120,000
Defined project scope$3,000,000
Separate site / facility additions$1,500,000
Capital contingency (15%)$675,000
Separate one-time startup / shutdown cost$200,000
Incremental working capital$350,000
Total initial cash$5,725,000

The defined scope assumes applicable freight, procurement charges and taxes are included in the owner’s estimate. Add missing civil, land / shell, OEM, environmental, validation and permitting costs explicitly. Site and field conditions, duty, production access and quoted supplier scope determine actual price. Financing is excluded.

Worked Operating Case

Hypothetical standalone first-factory case: $3,000,000 defined process / equipment / engineering / installation scope + $1,500,000 separate site / fit-out + 15% contingency $675,000 + $200,000 separate owner launch cost + $350,000 working capital = $5,725,000 initial cash. At 250 days × 7 scheduled productive hours/day × 1,600 good kg/h × 55% realization, potential output is 1,540,000 kg, capped by 1,400,000 kg demand. Net $4.20/kg price less $2.60/kg incremental variable cost gives $2,240,000 gross contribution; deduct $900,000 annual fixed operation for $1,340,000 steady net cash. First-year gross realization is 45%, giving $108,000 first-year net cash. All historic material, labor, energy, cleaning and maintenance savings are zero. This standalone result is not the incremental value of leaving a co-packer.

Calculated from these assumptions: steady annual net benefit $1,340,000; year-one net cash $108,000; cash payback Beyond 5 years; five-year NPV at 10% is −$1,765,346. Change the assumptions below to test a different case.
Standalone Factory Cash Flow Versus the Insourcing Decision.

Replace the illustrative inputs with your own measured or quoted values. The five-year pre-tax model uses good kilograms, demand-capped contribution and separately verified baseline savings; it is not a project quotation.

USD / 5-year screening model / pre-tax, unlevered

First-Factory Standalone Screening Example

The default is a standalone new-operation case, not an existing-plant retrofit and not the incremental difference versus continued co-packing. Historical savings are zero. Scheduled productive time and good kg/hour represent the new facility. Fixed annual operation includes $600,000 payroll / supervision, $200,000 occupancy / overhead and $100,000 service / support; incremental product labor, materials, packaging and utilities are in variable cost.

All-in Investment & Working Capital

Calendar & Constrained Good-Output Rate

Verified Baseline Savings & Added Operating Cost

Ramp, Discount & Target Payback

Initial cash investment
$5.72M

Includes contingency, startup and working capital

Steady annual net benefit
$1.34M

Incremental operating cash before tax

Cash payback
Beyond 5 years

Includes year-one ramp assumption

5-year NPV
−$1.77M

At 10% annual discount

Steady annual cash ROI
23.4%

Net annual benefit ÷ initial cash

5-year net cash ROI
-4.5%

Net cumulative gain ÷ initial cash

Modeled incremental sales: 1,400,000 kg/year at $1.60/kg contribution. The demand ceiling limits sales. The base case does not recover the required discounted return within five years. Year-one net cash: $108,000.

Realization needed for the target operating payback

Not feasible

Demand, time, contribution or other cash benefits cannot meet the 5-year target under these assumptions.

CSV export is local. No inputs are submitted.

Cumulative Project Cash

BaseDownside

Swipe the chart to compare all five years ↔

Five-year cumulative project cashBase case starts at −$5,725,000 and ends at −$257,000. Downside ends at −$4,681,120. Annual values are available in the table below.−$7.55M−$4.80M−$2.05M$699.5k0Initial: −$5,725,000InitialYear 1: −$5,617,000Year 1Year 2: −$4,277,000Year 2Year 3: −$2,937,000Year 3Year 4: −$1,597,000Year 4Year 5: −$257,000Year 5
Undiscounted cumulative cash. NPV separately discounts year-end flows; working-capital recovery defaults to zero.

Inspect Annual Cash Flow and Sensitivity

Swipe horizontally to compare all columns ↔

Base-case cash flows
YearNet cashCumulative cashDiscounted cash
Initial−$5,725,000−$5,725,000−$5,725,000
Year 1$108,000−$5,617,000$98,182
Year 2$1,340,000−$4,277,000$1,107,438
Year 3$1,340,000−$2,937,000$1,006,762
Year 4$1,340,000−$1,597,000$915,238
Year 5$1,340,000−$257,000$832,035

Swipe horizontally to compare all columns ↔

Sensitivity assumptions are not forecasts
CaseAnnual benefitNPVCash payback
Downside$578,400−$5,306,609Beyond 5 years
Base$1,340,000−$1,765,346Beyond 5 years
Upside$1,564,000−$1,028,2094.53 years

Downside: installed and site costs +20%, realization ×0.75 and unit contribution reduced by 20% of its absolute value. Upside: realization ×1.15, capped at 100%, and unit contribution improved by 10% of its absolute value. The demand ceiling still applies.

Calculation Basis

  • Five-year, pre-tax cash flow. Financing, depreciation and asset resale are excluded.
  • Initial cash includes contingency, startup costs and working capital; year one reflects ramp-up.
  • Output is capped by demand. Count each production gain or verified cash saving once.

First-Factory Launch Alternatives: One-Time Service Exposure

Separate from the annual standalone case, compare two launch / transfer plans after feasible inventory or continued-co-packer cover. Use genuinely uncovered lost contribution and the extra transition cost. Do not add the one-time difference as an annual saving.

Enable JavaScript

Prepare a Brand-to-Factory Equipment / Upgrade Brief.

Prepare the information below, export the assumptions you have modeled, and discuss the unknowns with DPS. An unmeasured input is a question to resolve, not a reason to invent precision.

Discuss this project ↗

Checklist and model data stay in this browser until you choose to share them.

Brand-to-Factory Equipment and Plant Upgrade FAQ.

Is removing a co-packer fee enough to justify a factory?
No. Compare owned variable costs, full additional fixed operation, capital, launch, working capital and service differences at the same actual demand.
Why can standalone factory profit look attractive while insourcing savings are small?
Brand sales or product margin may already exist under outsourcing. The incremental decision values only the costs and benefits that change between alternatives.
Should the first plant be sized for the most optimistic forecast?
Compare realistic demand, downside utilization, feasible phased capacity and continued external supply. Fixed costs and funding remain even when the line is underused.
Are these prices or returns a DPS commitment?
No. The example inputs exist to make the business-case calculation reviewable. Actual scope, prices, schedule, savings and performance need project-specific assessment and agreement.
What should the first DPS conversation include?
Bring the product and package mix, operating baseline, commercial target, retained assets, site constraints, available outage window and the capital options you are considering. Mark unknowns for measurement or supplier trials.

Discuss Your Brand-to-Factory Planning Project

Bring your product requirements, operating priorities and site constraints to an initial scope discussion with DPS.