Oil-in-Water Emulsified Dressings
Define oil fraction, emulsifier system, addition sequence and accepted final structure. Confirm stability after transfer, filling and the intended storage evaluation, not only immediately after mixing.
Define oil / water addition, ingredient hydration, emulsion quality, transfer and qualified cleaning before upgrading dressing production.
Discuss Your Project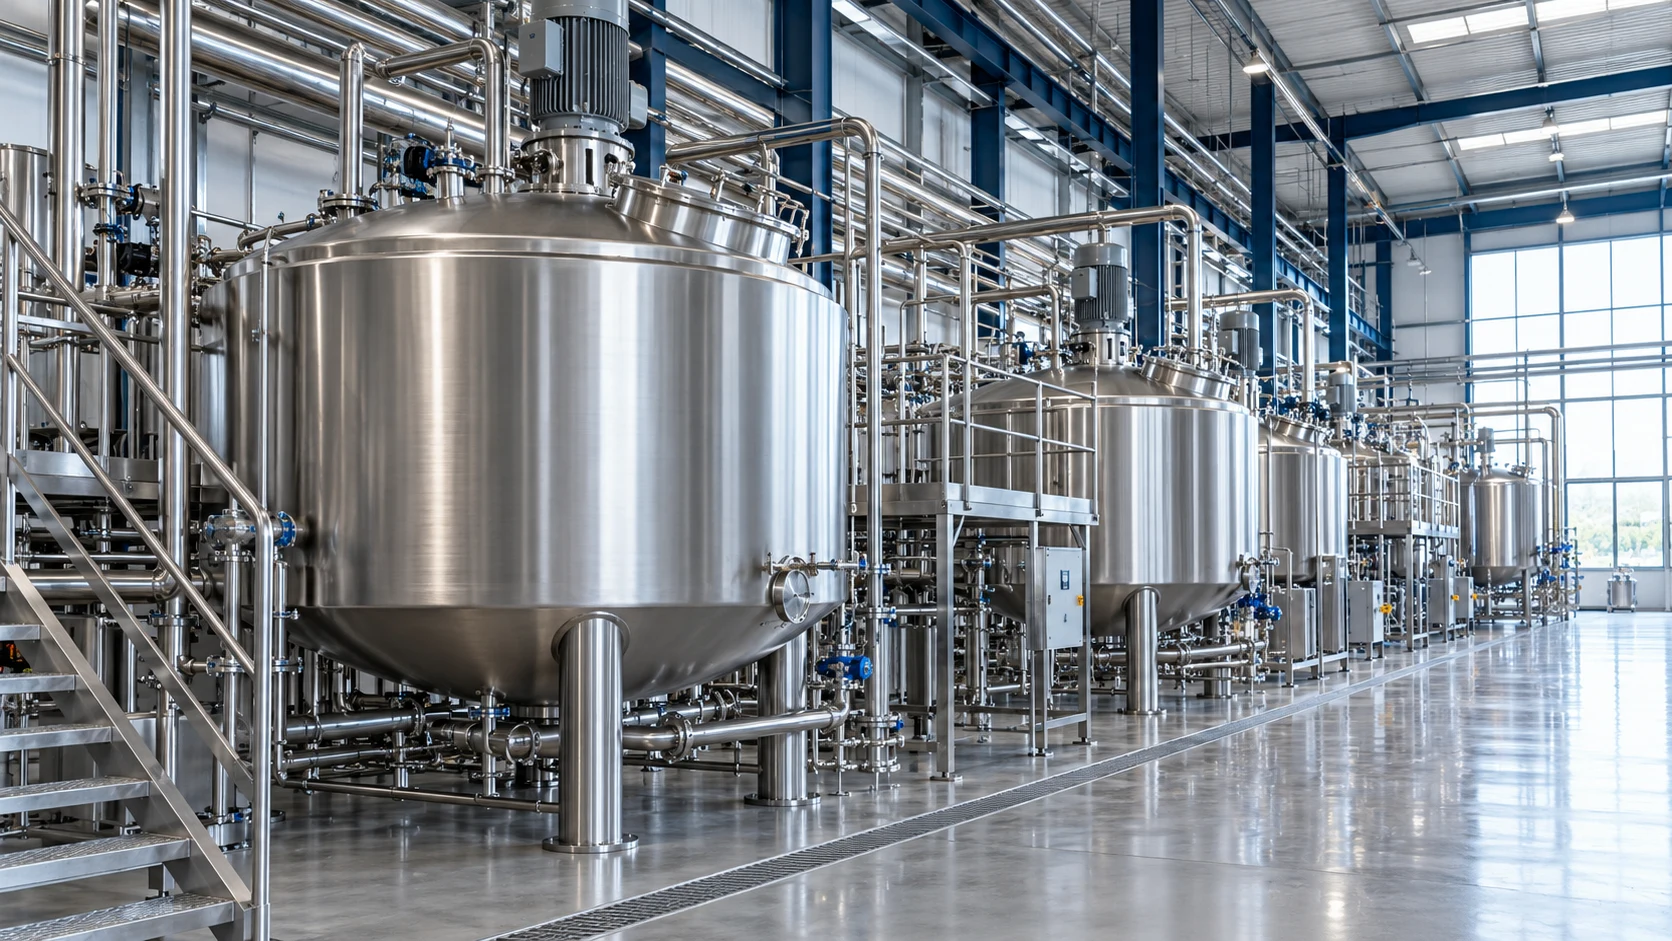
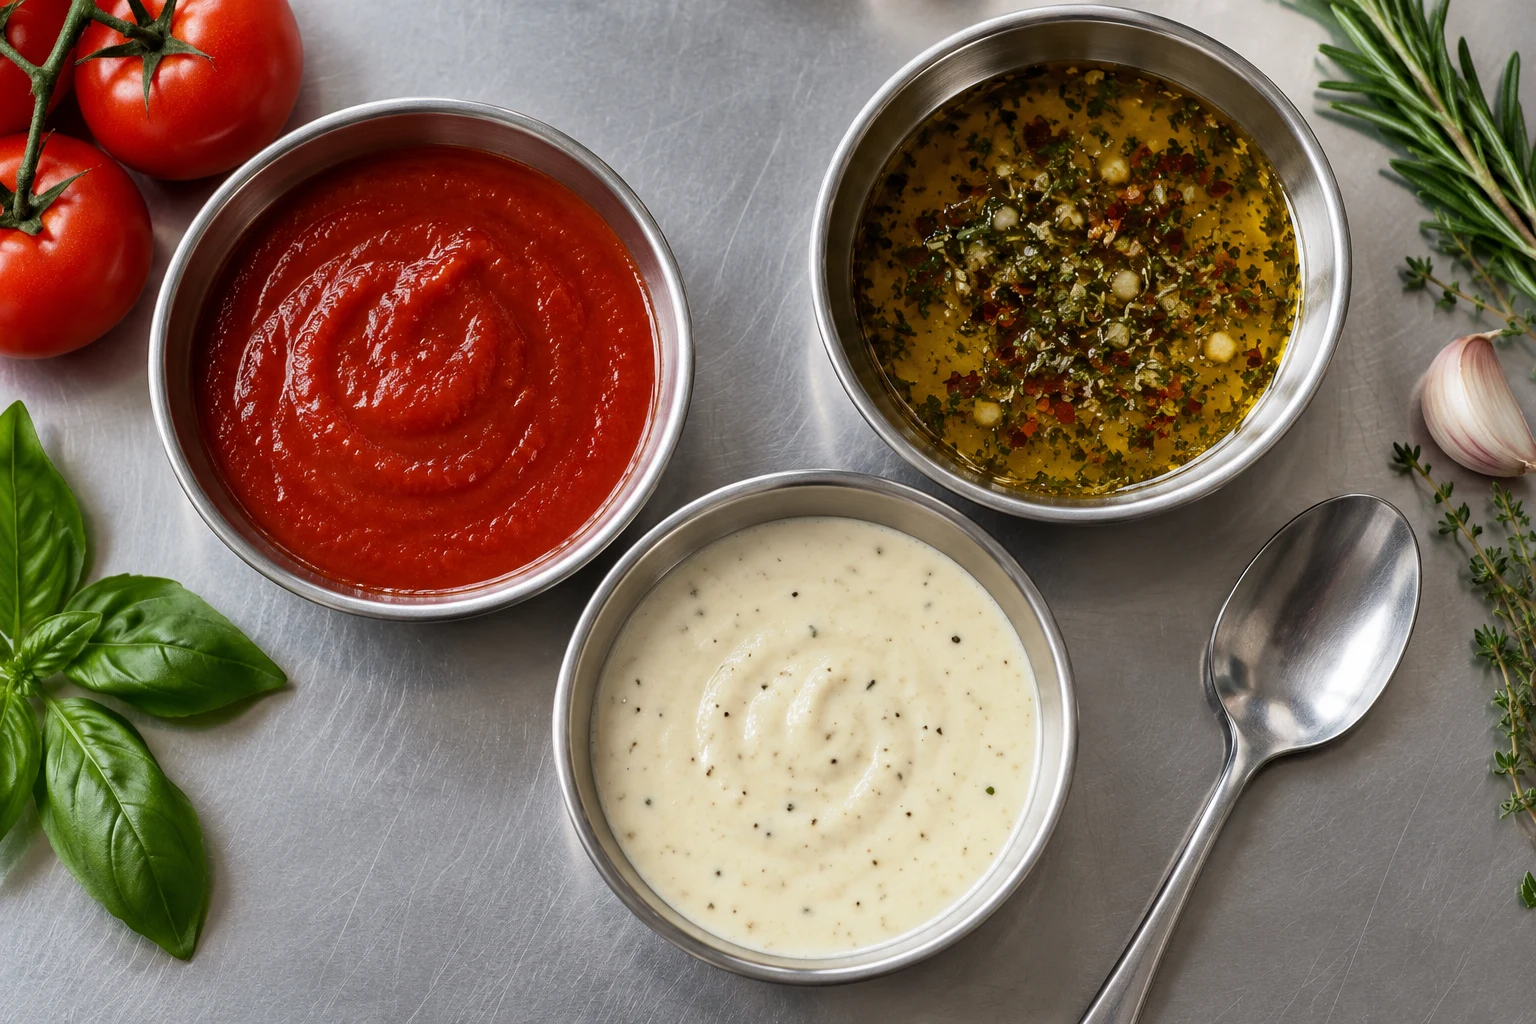
Define oil fraction, emulsifier system, addition sequence and accepted final structure. Confirm stability after transfer, filling and the intended storage evaluation, not only immediately after mixing.
Hydrocolloids, starches and other solids can change wetting, hydration, viscosity and shear response. The worst-case recipe may not be the highest nominal oil recipe.
Some products intentionally separate or contain herbs / pieces. Define the intended distribution / appearance and gentle transfer rather than applying one maximum-shear setting to every product.
Separate wetting, hydration, addition, emulsion formation and entrained-air problems before selecting technology.
Review viscosity through the actual temperature / process history, passages, valves and filler conditions.
Map the product / allergen matrix, ingredient identity, approved cleaning and startup.
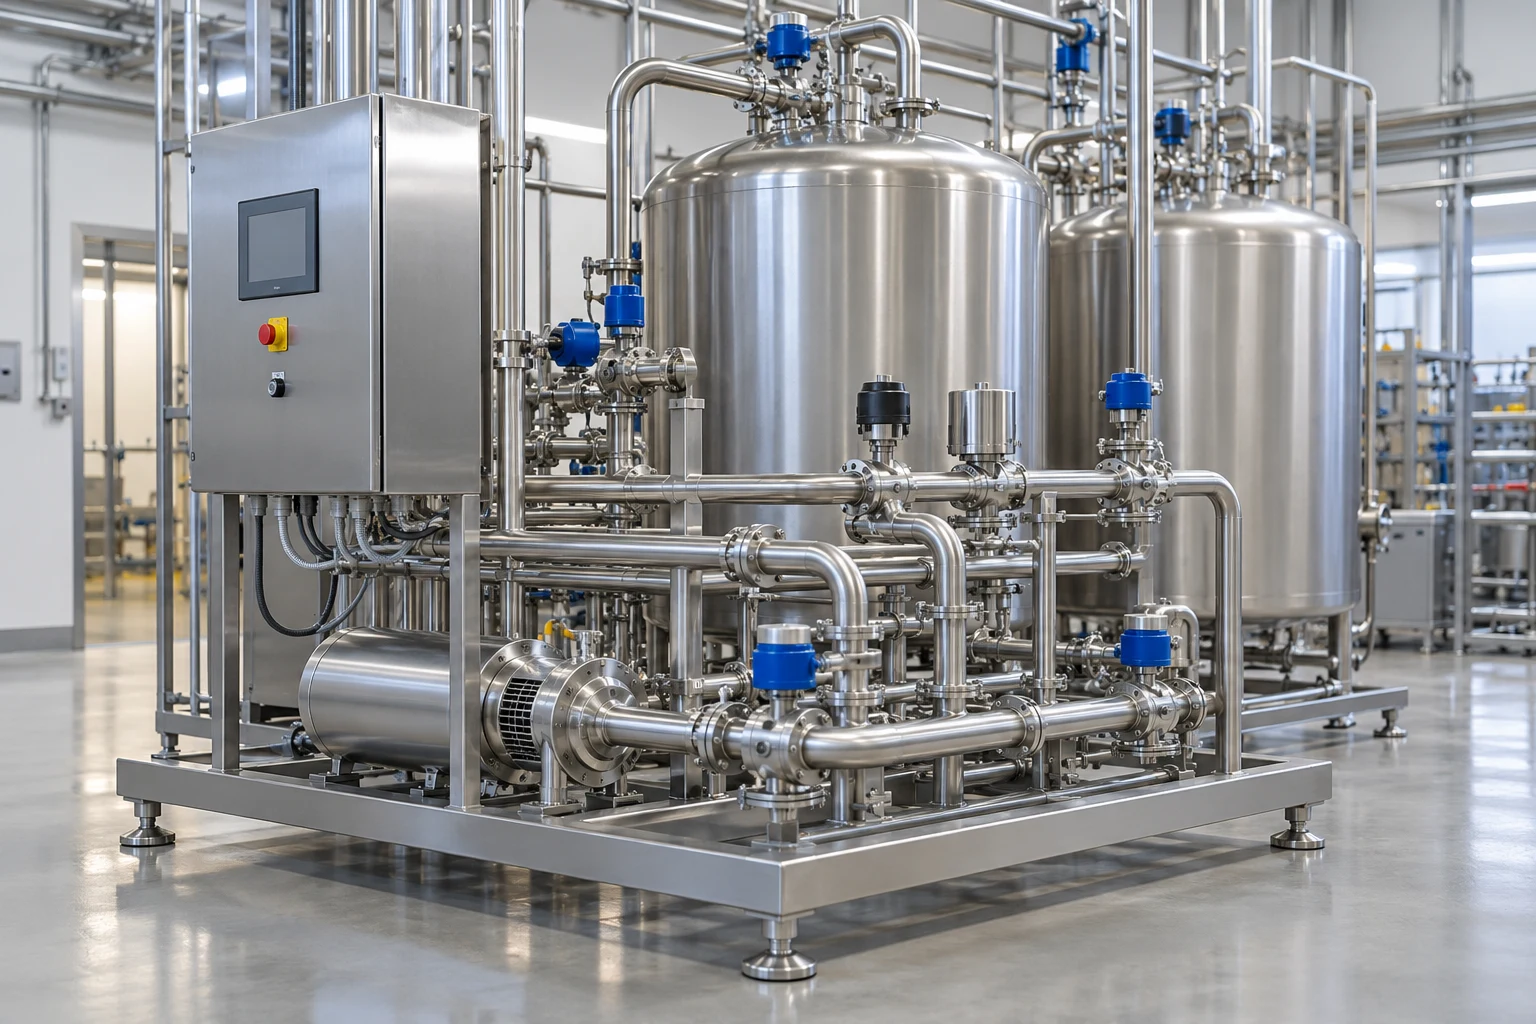
Review each system by its operating duty and the interfaces to be agreed before procurement.
Ingredient addition and dressing blend duty.
Dosing, recipe authority and batch records.
Actual oil / protein / particulate soil circuits.
Specialist shear, transfer and filling packages.
Swipe horizontally to compare all columns ↔
| System | Operating duty | Relevant DPS guide | Confirm before purchase |
|---|---|---|---|
| Configured tanks / vessels | Ingredient addition and dressing blend duty. | DPS tanks & vessels ↗ | Oil / water sequence, hydration, air and discharge. |
| Recipe / sequence controls | Dosing, recipe authority and batch records. | Automation & controls ↗ | Measurement, permissions and exceptions. |
| CIP equipment and circuit interfaces | Actual oil / protein / particulate soil circuits. | DPS CIP systems ↗ | Qualified verification, returns and manual-clean tasks. |
| Specialist equipment interfaces | Specialist shear, transfer and filling packages. | Installation & integration ↗ | Accepted emulsion / texture after the complete process. |
Specify the intended emulsion or distribution, formula range, ingredient / allergen transitions and quality after transfer / filling. Ask suppliers to distinguish high-shear formation from hydration and air management. A successful short demonstration is not the same as accepted full-batch production with qualified release.
Swipe horizontally to compare all columns ↔
| Buying question | Evidence to prepare | Engineering decision |
|---|---|---|
| Is shear really the constraint? | Ingredient sequence, hydration, air and final stability evidence. | Trial the correct mechanism before motor / mixer selection. |
| Can dressing be pumped faster? | Actual viscosity / particles and post-transfer quality. | Set a qualified route and filler duty. |
| How much ingredient saving is real? | Purchases at unchanged accepted baseline output. | Use avoided input cost once, separate from extra sales. |
Start with the business outcome
A dressing manufacturer may need to resolve unstable emulsion, long powder addition, entrained air or difficult product transfer rather than simply buy a higher-powered mixer. DPS can coordinate batching, dosing / recipe controls, utilities, CIP and specialist shear / package interfaces. Returns depend on accepted product after the full process, verified baseline purchases and useful sold output.
Formulation, emulsion stability, microbiological / preservation requirements and shelf-life belong to qualified product specialists. High-shear / homogenization and filling packages need explicit OEM scope. The guide does not prescribe a universal mayonnaise or dressing recipe.
Agree the intended emulsion or separation, ingredient system, oil-water sequence, viscosity and particulate distribution for each recipe family.
Evaluate wetting, hydration, shear and entrained air with representative formulas, including quality after transfer and the intended storage evaluation.
Check residual product, qualified flavor and allergen transitions, batch records and accepted packaged output.
Review the scope, cost assumptions and operating case for your project. The examples and calculators below support early planning and are not DPS quotations.
Record formula-specific additions, hydration, quality, residue and package waits. Trial the most demanding formulations before selecting mixer / pump changes.
Define formula families, qualified process / package basis, specialist mixing, ingredient supply, utilities, sanitation and demand.
Swipe horizontally to compare all columns ↔
| Observed condition | Measure before design | DPS / team decision | Economic basis |
|---|---|---|---|
| Unstable or off-texture dressing | Qualified samples across mixing, transfer and storage. | Resolve formulation / shear / hydration / air boundary. | Verified baseline reject purchases, not full sales revenue. |
| Long addition and hydration | Actual additions, time and rework per formula. | Trial dosing, induction and sequence. | Useful capacity only if filler / demand can absorb it. |
| High residual product | Weighed baseline purchases and accepted output. | Review discharge, piping and package transitions. | Actual input saving once. |
| Flavor / allergen cleaning loss | Qualified timeline and resource bills. | Coordinate installed circuits and recipe handshakes. | Independent time / resource and real paid-cost changes. |
Swipe horizontally to compare all columns ↔
| Decision | Targeted Work | Broader Scope |
|---|---|---|
| Emulsion and Texture | Trial addition sequence, hydration and existing shear duty. | Change mixing or process packages when the formula needs a different envelope. |
| Product Recovery | Correct discharge and sanitary transfer routing. | Reconfigure holding or filling where retained interfaces cause the constraint. |
| Recipe Flexibility | Improve qualified cleaning and recipe handshakes. | Add capability for product families that need separate handling duties. |
Compare proposals with the same product duty, supplier boundaries and acceptance basis. The amount below is a transparent planning example, not a market price range, supplier estimate or DPS quotation.
| Cost bucket | Assumed amount |
|---|---|
| Product / process and interface engineering | $42,000 |
| Defined configured / OEM component allowance | $147,000 |
| Mechanical / electrical field installation | $81,000 |
| Instrumentation and control integration | $42,000 |
| Commissioning and acceptance support | $25,000 |
| Training, documentation and closeout | $13,000 |
| Defined project scope | $350,000 |
| Separate site / facility additions | $45,000 |
| Capital contingency (15%) | $59,250 |
| Separate one-time startup / shutdown cost | $30,000 |
| Incremental working capital | $25,000 |
| Total initial cash | $509,250 |
The defined scope assumes applicable freight, procurement charges and taxes are included in the owner’s estimate. Add missing civil, land / shell, OEM, environmental, validation and permitting costs explicitly. Site and field conditions, duty, production access and quoted supplier scope determine actual price. Financing is excluded.
Hypothetical owner-budget case: 250 days × 0.5 useful recovered hour/day × 900 good kg/h × 60% realization gives 67,500 incremental sold kg/year after the 90,000 kg demand ceiling. Net price $4.8/kg less incremental variable cost $3/kg gives $1.8/kg contribution. The baseline inputs assume $10,000 energy, $14,000 water / chemistry and $7,000 maintenance reductions per year. Avoided payroll is 0 hours × $40 × 0% cash realization. Verified baseline purchase reduction contributes $8,400; its basis is unchanged accepted baseline output. Deduct $16,000 added annual fixed cost. Result: $144,900 steady net benefit; initial cash $509,250 includes the separate site, contingency, startup and working-capital inputs. These are original illustrative assumptions, not a quotation, price benchmark or achieved DPS result.
Calculated from these assumptions: steady annual net benefit $144,900; year-one net cash $88,585; cash payback 3.90 years; five-year NPV at 10% is −$11,160. Change the assumptions below to test a different case.
Replace the illustrative inputs with your own measured or quoted values. The five-year pre-tax model uses good kilograms, demand-capped contribution and separately verified baseline savings; it is not a project quotation.
All defaults are illustrative. The default case is an operating-plant improvement, not a greenfield quote. For a new operation, set baseline savings to zero and enter every additional operating and capital cost.
Includes contingency, startup and working capital
Incremental operating cash before tax
Includes year-one ramp assumption
At 10% annual discount
Net annual benefit ÷ initial cash
Net cumulative gain ÷ initial cash
Modeled incremental sales: 67,500 kg/year at $1.80/kg contribution. The base case does not recover the required discounted return within five years. Year-one net cash: $88,585.
Realization needed for the target operating payback
43.1%
Minimum capacity realization for a 5-year operating cash payback; terminal recovery excluded. Demand and unit margin must also hold.
CSV export is local. No inputs are submitted.
Swipe the chart to compare all five years ↔
Swipe horizontally to compare all columns ↔
| Year | Net cash | Cumulative cash | Discounted cash |
|---|---|---|---|
| Initial | −$509,250 | −$509,250 | −$509,250 |
| Year 1 | $88,585 | −$420,665 | $80,532 |
| Year 2 | $144,900 | −$275,765 | $119,752 |
| Year 3 | $144,900 | −$130,865 | $108,866 |
| Year 4 | $144,900 | $14,035 | $98,969 |
| Year 5 | $144,900 | $158,935 | $89,971 |
Swipe horizontally to compare all columns ↔
| Case | Annual benefit | NPV | Cash payback |
|---|---|---|---|
| Downside | $96,300 | −$270,779 | Beyond 5 years |
| Base | $144,900 | −$11,160 | 3.90 years |
| Upside | $177,097 | $100,649 | 3.26 years |
Downside: installed and site costs +20%, realization ×0.75 and unit contribution reduced by 20% of its absolute value. Upside: realization ×1.15, capped at 100%, and unit contribution improved by 10% of its absolute value. The demand ceiling still applies.
Defaults reproduce $8,400 gross avoided purchases: 700,000 − 696,500 = 3,500 kg × $2.40. Compare the same accepted baseline output and product mix; the main variable cost already covers new volume. Added annual service / trial cost is deducted only once.
Prepare the information below, export the assumptions you have modeled, and discuss the unknowns with DPS. An unmeasured input is a question to resolve, not a reason to invent precision.
Checklist and model data stay in this browser until you choose to share them.
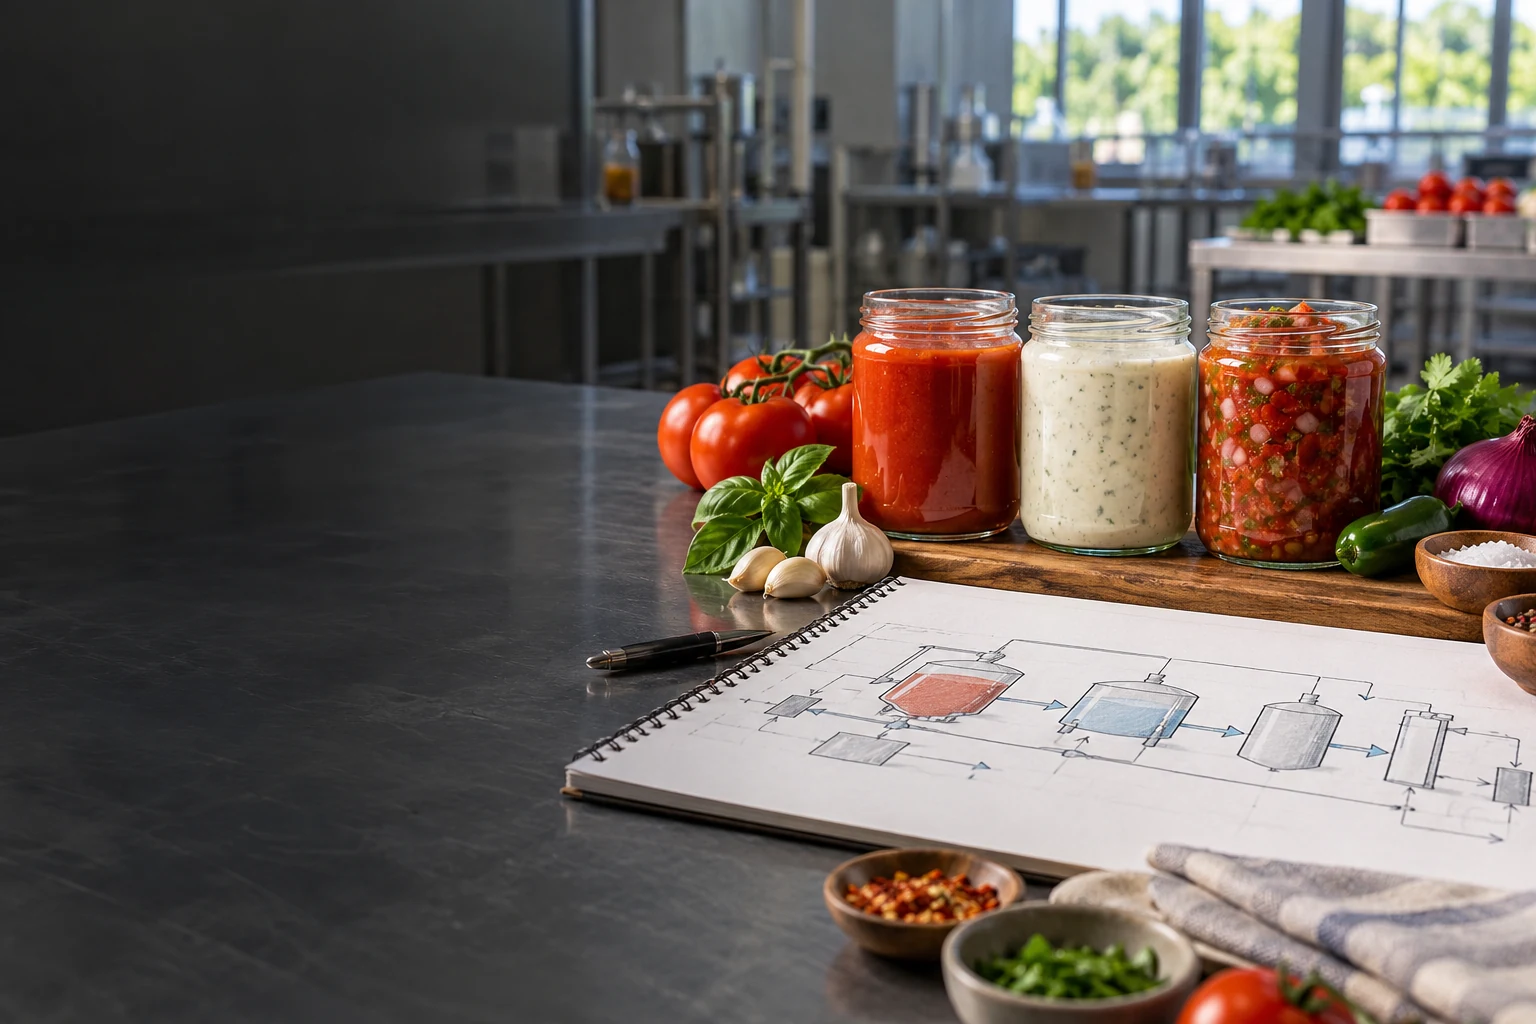
Define sauce manufacturing plant cost across preparation, cooking, cooling, filling, cleaning and utilities, with clear boundaries and budget assumptions.
Compare batch vs continuous food processing using product mix, campaigns, installed scope, utilities and a transparent annual-capacity example.

See what separates equipment purchase cost from total installed cost: package boundaries, utilities, installation, controls, testing and exclusions.
Bring your product requirements, operating priorities and site constraints to an initial scope discussion with DPS.