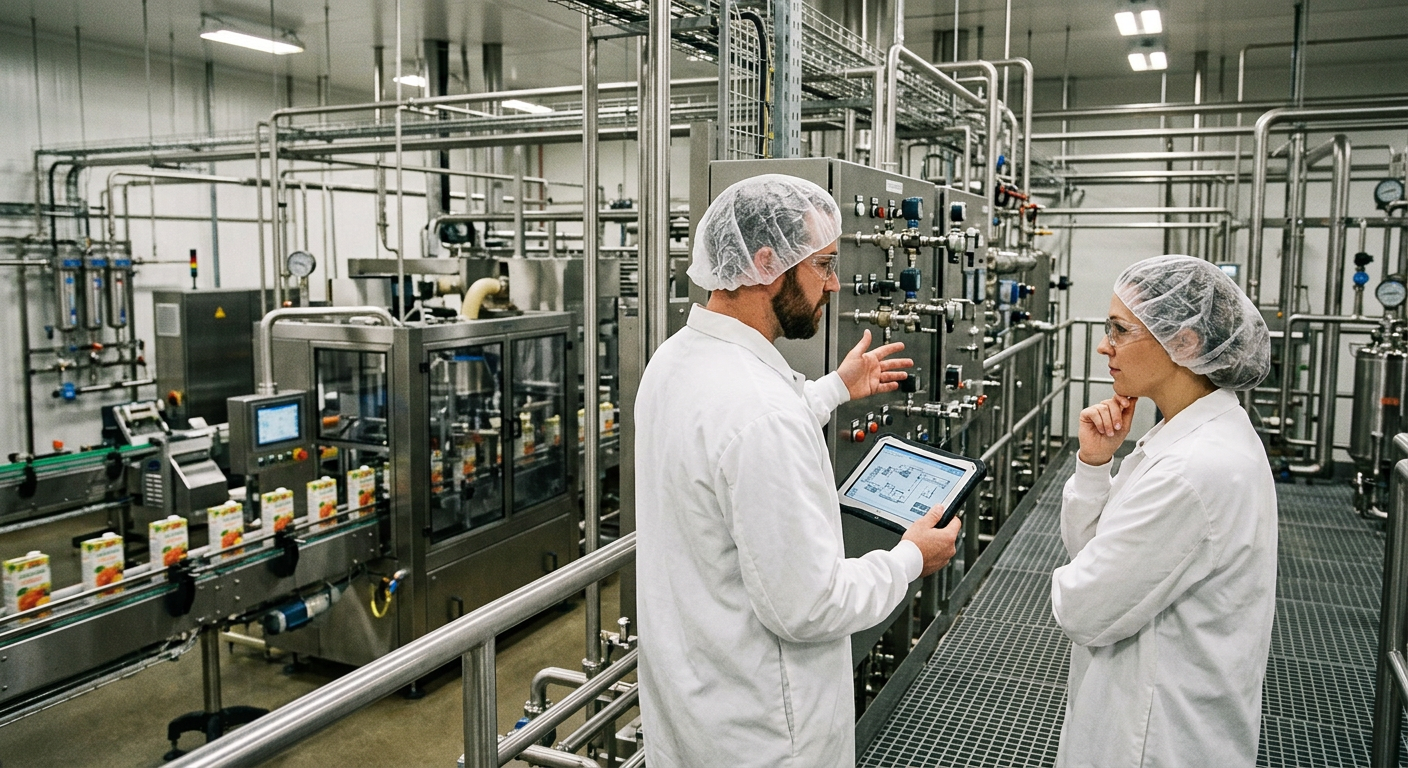
Beverage Plant Feasibility Study
[trp_language language=”en_US”]
Beverage Facility Feasibility Study in the United States
Launching or expanding a beverage manufacturing operation in the United States requires more than a strong formula or a promising brand story. A modern beverage plant feasibility study determines whether a project can succeed commercially, technically, financially, operationally, and regulatorily before capital is committed. For investors, founders, co-packers, breweries, distilleries, dairy beverage manufacturers, and large strategic processors, the right feasibility work reduces waste, exposes hidden constraints, and aligns facility design with a realistic path to profit.
In the U.S. market, feasibility analysis must account for regional labor conditions, utility rates, freight lanes, water quality, wastewater discharge rules, FDA expectations, alcohol permitting where relevant, and category-specific consumer demand. A plant that looks attractive on paper can underperform if line speeds are mismatched, if wastewater surcharges are underestimated, if a syrup room is undersized, or if the chosen site lacks enough power or sanitary drainage capacity. That is why experienced engineering and project partners often begin with a disciplined assessment rather than jumping directly into construction drawings or equipment procurement.
Disruptive Process Solutions supports manufacturers across all 50 states and Canada with planning, engineering, integration, equipment supply, installation, and execution management. Its approach is especially relevant to beverage projects because feasibility is not treated as a generic report. It is tied to throughput, labor, utility consumption, packaging format, sanitation strategy, and first-year profitability. Readers looking for a practical project partner can learn more about the company, review its broader engineering and project services, explore available process equipment solutions, and see representative project examples.
Quick Answer

A beverage plant feasibility study is a structured analysis used to determine whether a proposed beverage manufacturing project in the United States should move forward, how it should be designed, what it will cost, what risks it carries, and what operating model gives it the best chance of profitability. It examines market demand, product mix, package types, equipment requirements, utility loads, labor, permitting, site readiness, water and wastewater capacity, food safety design, capital budget, operating costs, and break-even timing.
For a startup kombucha facility in Austin, a contract canning operation near Chicago, a dairy beverage line in Wisconsin, or a spirits plant near Louisville, the core question is the same: can the business produce the right volume, at the right quality, at the right cost, in a facility that can legally and reliably operate? A feasibility study answers that question with data rather than optimism.
| Feasibility Area | Main Question | Typical U.S. Data Inputs | Common Failure if Ignored |
|---|---|---|---|
| Market | Is there enough demand? | IRI/Nielsen trends, retail velocity, on-premise growth, distributor interest | Overbuilding capacity for a weak category |
| Technical | Can the plant make the product? | Formula needs, line speed, pasteurization method, CIP design | Low throughput and quality instability |
| Financial | Will it earn acceptable returns? | Capex, labor, utilities, packaging cost, margin assumptions | Cash shortfalls and delayed profitability |
| Site | Is the location suitable? | Power, gas, water, sewer, zoning, logistics access | Expensive retrofits after lease signing |
| Regulatory | Can it operate legally? | FDA registration, TTB permits, state licenses, local approvals | Project delays or inability to launch |
| Environmental | Can utilities and waste streams be managed? | BOD/COD loads, pretreatment needs, water quality profile | Fines, surcharges, or shutdown risk |
The table above shows why beverage feasibility must be integrated. Market promise alone is not enough; every successful project connects consumer demand to equipment, labor, utilities, and compliance.
What Is a Beverage Plant Feasibility Study?

A beverage plant feasibility study is a decision-making framework used before greenfield construction, brownfield renovation, co-packing expansion, line addition, or capacity relocation. It is broader than a business plan and more practical than a high-level concept deck. In U.S. manufacturing, it usually combines commercial analysis, process engineering, facility planning, cost modeling, and implementation strategy.
The scope varies by project type. A ready-to-drink coffee line in New Jersey may focus heavily on thermal processing, filling technology, and refrigerated or ambient distribution assumptions. A carbonated soft drink project near Atlanta may emphasize syrup room design, carbonation, can line speeds, depalletizing, and utility redundancy. A distillery in Tennessee or Texas must also account for TTB permitting, bonded space, explosion protection, and barrel warehousing strategy. A dairy beverage project in California or upstate New York may require tighter sanitary zoning, washdown design, allergen controls, and cold chain modeling.
Most strong studies answer five operational questions. First, what products and packaging formats will the plant make: cans, PET bottles, glass, cartons, kegs, bag-in-box, or aseptic packs? Second, what annual and peak volumes must be supported in years one, three, and five? Third, what process architecture is needed: blending, carbonation, fermentation, filtration, HTST, UHT, tunnel pasteurization, hot fill, cold fill, or HPP support? Fourth, what site and utility platform can support those needs at acceptable cost? Fifth, what investment level can the business support without harming cash flow?
At this stage, specialized engineering input matters. DPS is known for approaching feasibility with an operations-first mindset rather than simply maximizing project spend. That means challenging assumptions when needed, identifying cheaper ways to unlock capacity, and connecting plant design to commercial outcomes. This is especially valuable for founders and operators who need a plan that works in real manufacturing conditions, not just in a spreadsheet.
| Project Type | Typical Feasibility Focus | Preferred Output | Decision Trigger |
|---|---|---|---|
| Greenfield beverage plant | Full site, utility, process, capex, labor, and launch model | Concept layout and staged investment roadmap | Land purchase or lease decision |
| Line expansion | Bottleneck analysis, utility capacity, packaging mix | Debottlenecking plan and ROI model | Demand outgrowing current capacity |
| Co-packing facility | Multi-SKU flexibility, cleaning changeover, customer requirements | Commercial and technical service matrix | Contract commitments or investor review |
| Brewery or fermented beverage plant | Fermentation, cellar, utilities, wastewater, cold storage | Tank farm and packaging strategy | Regional distribution expansion |
| Spirits distillery | TTB, process safety, still sizing, storage, maturation | Compliance and capacity plan | Brand growth or tourism model |
| Aseptic beverage operation | Sterility, clean room interfaces, filler compatibility | Technology comparison and cost case | Shelf-stable premium product launch |
This table highlights how feasibility must be tailored to product and operating model. A one-size-fits-all report is rarely useful in beverage manufacturing.
Market Feasibility: Analyzing Beverage Category Demand and Trends

Market feasibility begins with category selection. The U.S. beverage market is large, but demand is fragmented. Carbonated soft drinks remain high volume, yet growth in many regions is slower than in energy drinks, functional beverages, protein shakes, premium water, low-sugar refreshment, kombucha, spirit-based RTDs, and certain dairy-adjacent formats. Feasibility teams must understand not only national growth but channel-level demand by geography, season, package type, and margin structure.
For example, a premium canned mocktail line may perform differently in Los Angeles, Miami, and New York City than in secondary inland markets. A sports hydration beverage may rely heavily on summer seasonality and big-box retail access. A refrigerated probiotic drink must account for shorter shelf life, cold distribution, and retail spoilage risk. A plant built around one category should stress-test adjacent products so the line stays utilized if consumer preferences shift.
U.S. trade hubs matter here. Facilities near Chicago can reach major Midwest markets with balanced freight economics. Plants near Dallas-Fort Worth or Houston gain broad access to Texas growth and Gulf logistics. Southern California sites can connect to the Ports of Los Angeles and Long Beach but face higher labor and utility costs. New Jersey and Pennsylvania support dense East Coast population centers. Atlanta, Charlotte, and Nashville offer strong transportation access and growing regional demand. Market feasibility should compare category demand against freight realities, not only consumer trends.
By 2026, several trends are likely to shape feasibility decisions: continued pressure toward lower sugar and cleaner labels, automation to offset labor constraints, sustainability claims tied to water and packaging efficiency, tighter retailer expectations around service levels, and stronger scrutiny of ingredient sourcing and traceability. Plants designed only for one short-lived trend may struggle; facilities designed for flexible batching, multiple can sizes, and future product extensions are more resilient.
The line chart illustrates why growth category selection matters. High-volume legacy beverages can still be profitable, but faster-growing segments may justify more flexible or premium-capable production systems.
The bar chart shows a realistic demand ranking used in strategic screening. High-demand categories may support quicker line utilization, while niche categories need stronger pricing power to justify capex.
| Beverage Category | Demand Outlook in the U.S. | Main Driver | Feasibility Warning |
|---|---|---|---|
| Energy drinks | Strong | Convenience and functional use | Competitive shelf space and marketing spend |
| Functional water | Moderate to strong | Health positioning and low calorie appeal | Margin pressure in mainstream channels |
| Protein and nutrition beverages | Strong | Fitness, meal replacement, recovery | Complex thermal and texture management |
| RTD coffee and tea | Moderate to strong | Premiumization and convenience | Shelf-life and flavor stability challenges |
| Kombucha and fermented drinks | Selective growth | Gut health and natural image | Cold chain and process variability |
| Craft beer | Mature | Regional loyalty and taproom value | Slower growth and SKU proliferation |
| Spirits-based RTDs | Strong | Convenience and premium cocktails | TTB, state alcohol rules, tax complexity |
This table is useful for buying advice. Investors and operators should not choose a category solely because it is popular nationally; they should choose one where local route-to-market, product differentiation, and plant economics align.
Technical Feasibility: Processing Equipment, Bottling Lines, and Utilities
Technical feasibility converts the business model into an operating system. This is where many beverage projects fail, because founders often underestimate the interaction between process design, packaging speed, sanitation, utility demand, and future expansion. The right technical plan starts with the beverage itself. Is it still or carbonated? Acidified or low acid? Ambient shelf-stable or refrigerated? Alcoholic or non-alcoholic? Pulp-containing or clear? Sensitive to oxygen pickup? Every answer changes the equipment architecture.
Typical processing blocks include ingredient handling, water treatment, blending and batching, in-line Brix control, carbonation where needed, pasteurization or sterilization, surge capacity, filling, secondary packaging, CIP, and plant utilities. In some beverage categories, especially premium nutrition or aseptic products, the filler is not the whole story; upstream thermal treatment, hygienic zoning, and recipe repeatability are often the larger technical risk.
DPS brings unusual depth to this area. On the technological side, the company works across structural, mechanical, plumbing, electrical, process, and controls engineering, with automation support that includes PLC programming, SCADA, recipe systems, batch control, and integration of complete utility platforms. For beverage manufacturers, that means feasibility can cover fermentation systems, distillation, carbonation and bright tanks, HTST and UHT processing, hot fill and cold fill, aseptic processing, filtration, clarification, reverse osmosis, disinfection, and complete CIP strategy. Instead of viewing equipment as isolated machines, the engineering focus is on throughput, reliability, sanitation, and profitable line balance.
Utilities are equally important. A can line rated at 400 cans per minute is not truly feasible if compressed air delivery is unstable, glycol is undersized, boiler capacity cannot support CIP and thermal loads, or the electrical service requires a long utility upgrade lead time. Across the United States, utility availability varies sharply. Sites in Phoenix may face water concerns; California municipalities may impose strict discharge and sustainability expectations; Gulf Coast locations may offer strong industrial infrastructure but require weather resilience planning; older Northeast buildings may need expensive electrical and drainage modernization.
| Technical Element | Purpose | Common Equipment | Key Feasibility Check |
|---|---|---|---|
| Water treatment | Consistent product quality | RO, carbon filtration, softening, UV, ozone | Feedwater variability and recovery rate |
| Blending and batching | Recipe control | Mix tanks, dosing skids, Brix monitoring | Ingredient accuracy and changeover time |
| Thermal processing | Safety and shelf life | HTST, UHT, flash pasteurizer, tunnel pasteurizer | Product sensitivity and required hold conditions |
| Filling | Primary package delivery | Can fillers, PET fillers, glass bottling lines, aseptic fillers | Package mix and target speed |
| CIP systems | Sanitation and uptime | Single-use or multi-tank CIP skids | Chemical use, labor, and line availability |
| Utilities | Plant support | Boilers, air compressors, glycol, cooling towers, HVAC | Peak load versus utility redundancy |
| Controls | Automation and traceability | PLC, HMI, SCADA, historian | Operator usability and future expansion |
The table above helps operators compare options during equipment purchasing. A lower machine price can become more expensive if it creates changeover delays, sanitation issues, or utility inefficiency.
On the manufacturing capabilities side, DPS also designs and supplies proprietary process equipment, including tanks up to 12,000 gallons and custom CIP systems, while integrating third-party processing and packaging assets into complete plants. That makes it easier to evaluate whether a project needs fully custom fabrication, a hybrid supply model, or strategic reuse of existing equipment. For clients with fast growth plans, the advantage is not simply buying machinery, but building a phased process platform that can scale from first-year demand to much higher case volumes without reworking the entire utility backbone.
Financial Feasibility: Startup Costs, Revenue Models, and Break-Even Analysis
Financial feasibility translates engineering and commercial assumptions into a capital decision. In beverage manufacturing, startup cost errors are common because teams focus only on visible line equipment and overlook building improvements, utility infrastructure, water treatment, permitting, warehouse fit-out, controls integration, startup scrap, spare parts, validation, and working capital. A practical U.S. beverage plant model should include both one-time capex and the true operating cost profile of the first 24 months.
Startup costs vary widely. A modest pilot and regional production setup may require a few million dollars, while a highly automated multi-line co-packing plant can require tens of millions. Cost drivers include package type, sanitation standard, utility intensity, required speed, degree of automation, and whether the project is greenfield or retrofit. Retrofitting an older food facility in the Midwest can save shell costs but create expensive drainage, slab, or power upgrades. Greenfield sites offer cleaner layout options but higher initial development cost and longer schedules.
Revenue models also differ by business type. Brand owners usually model revenue by case sales, pricing tiers, promotional deductions, and channel mix. Co-packers often model by tolling rates, minimum runs, changeover charges, warehouse services, and pass-through ingredient or packaging fees. Breweries and distilleries may layer in hospitality or direct-to-consumer revenue. A good feasibility study stress-tests all of these, not just the base case.
The area chart reflects an important 2026 trend: flexible lines are gaining strategic value because they reduce risk when product mix changes. Financially, this often justifies higher capex if utilization is improved across categories or customers.
| Cost Category | Typical Share of Budget | Why It Matters | Frequent Underestimate |
|---|---|---|---|
| Core process equipment | 20% to 35% | Determines capability and speed | Installation and integration cost |
| Packaging line | 15% to 30% | Controls packaged throughput | Conveyance and accumulation needs |
| Utilities and infrastructure | 10% to 20% | Supports stable operations | Electrical service upgrades |
| Building modifications | 10% to 25% | Enables sanitary and production flow | Drainage, slab, walls, HVAC zoning |
| Engineering and project execution | 5% to 12% | Reduces rework and schedule risk | Startup support and commissioning |
| Permits, testing, and validation | 2% to 6% | Needed for legal launch | Municipal review delays |
| Working capital and startup inventory | 8% to 18% | Protects early operations | Packaging MOQs and customer terms |
This table shows why break-even analysis must go beyond machine quotations. The true cost of readiness often determines whether a project survives its first year.
Break-even modeling should include line efficiency assumptions, not just nameplate speed. If a line is rated for 300 bottles per minute but only runs at 62% OEE after changeovers, sanitation, and minor stops, the business case changes quickly. Sensible revenue models should test low, base, and high scenarios. For many U.S. projects, the most dangerous mistake is assuming immediate utilization. In reality, new plants often ramp in stages as customers are onboarded, operators are trained, and process stability improves.
Site Selection Criteria for Beverage Manufacturing Facilities
Choosing the right site can save millions of dollars over the life of a plant. Site feasibility should examine logistics, labor, utilities, zoning, food-grade suitability, expansion room, climate exposure, and access to customers or supply nodes. In the United States, beverage manufacturing sites often compete on four dimensions: inbound packaging and ingredient cost, outbound freight efficiency, labor availability, and utility reliability.
Facilities near major trade and logistics corridors have obvious advantages. Chicago offers rail, road, and broad Midwest reach. Dallas-Fort Worth supports national freight distribution and Texas demand. Atlanta provides Southeast coverage and labor depth. Charlotte and the Research Triangle attract advanced manufacturing talent. Southern California gives import access through Los Angeles and Long Beach, although cost pressure is high. Savannah and Houston can support port-driven supply chains. Louisville, Nashville, and Indianapolis often work well for central distribution. A feasibility study should model freight from the actual service radius, not from a generic national average.
Real estate selection must go beyond square footage. Ceiling height, floor loading, sanitary drainage, truck court size, cold storage capability, room for wastewater pretreatment, utility service entrance size, and future tank farm placement all matter. Beverage facilities also benefit from clean process flow: raw material receipt to batching, thermal treatment, filling, packaging, warehousing, and shipping with minimal cross-traffic.
From a service capabilities standpoint, DPS supports feasibility, capital planning, owner’s representation, project and program management, general contracting where licensed, and turnkey installation and integration. That makes site selection more actionable because the analysis does not stop at “good location” or “bad location.” It can extend into conceptual layout, utility routing, construction scope, local trade coordination, and implementation planning. For multi-state clients, this is valuable when comparing a retrofit in Ohio against a greenfield in North Carolina or Texas.
| Site Criterion | What to Review | Ideal Condition | Red Flag |
|---|---|---|---|
| Water supply | Volume, pressure, quality, municipal limits | Stable industrial-grade service | Frequent restrictions or poor chemistry |
| Wastewater | Sewer capacity, surcharges, pretreatment needs | Predictable industrial discharge pathway | No clear approval for high-strength effluent |
| Power and gas | Available service and upgrade lead times | Capacity for thermal and automation loads | Long utility extension timeline |
| Logistics access | Interstate, rail, port, and customer reach | Efficient inbound and outbound freight lanes | Congestion or costly final-mile constraints |
| Labor market | Wages, skills, turnover, training base | Food and beverage workforce presence | Severe competition for operators |
| Building suitability | Height, slab, drains, docks, washdown finish | Food-grade adaptation with room to expand | Major civil work needed after lease |
| Regulatory fit | Zoning and use approvals | Industrial use already aligned | Conditional use uncertainty |
The table above is especially helpful for buying or leasing advice. Many operators sign a lease based on rent alone and later discover sewer, drainage, or power issues that erase any apparent savings.
Regulatory Compliance: FDA, TTB, and State-Level Permitting
Regulatory feasibility is often underestimated until late in the project. Beverage facilities in the United States may be governed by the FDA, the Alcohol and Tobacco Tax and Trade Bureau, state alcohol agencies, local building departments, fire marshals, environmental agencies, and municipal sewer authorities. Which rules apply depends on the product, processing method, and location.
For non-alcoholic beverages, core federal obligations usually include FDA food facility registration, compliance with Current Good Manufacturing Practice requirements, preventive controls where applicable, traceability and records readiness, sanitary design, allergen management if relevant, and labeling compliance. Acidified or low-acid products can trigger additional process controls. Dairy beverages may face further state and industry requirements.
Alcoholic beverages introduce another regulatory layer. Breweries, distilleries, wineries, and certain RTD operations may need TTB permits, formula approvals, label approvals, bonded space planning, excise tax systems, and state-level manufacturing or distribution permissions. States differ significantly. A project in California, North Carolina, Texas, Kentucky, or Florida can face different licensing timing, local interpretations, and distribution implications. This means regulatory feasibility should be built into the project timeline from the beginning, not treated as paperwork after engineering is complete.
By 2026, manufacturers should also expect increased scrutiny around sustainability claims, water discharge, chemical handling, and digital recordkeeping. Facilities planning for long-term enterprise customers may need to align with SQF, BRCGS, or customer-specific audit expectations even if those are not legal requirements on day one.
| Compliance Area | Who Oversees It | Typical Beverage Relevance | Feasibility Impact |
|---|---|---|---|
| Food facility registration | FDA | Most non-alcoholic beverage plants | Required for launch readiness |
| GMP and preventive controls | FDA | Broad food and beverage manufacturing | Drives layout, sanitation, and training |
| Alcohol production permit | TTB | Breweries, distilleries, wineries, RTD alcohol | Affects design, timing, and inventory controls |
| Label and formula review | FDA or TTB | Product-specific | Can delay commercialization if late |
| Building and fire approvals | Local authorities | All facilities | Impacts occupancy and safety systems |
| Wastewater discharge permits | Municipality or state agency | High-BOD beverage plants | Can require pretreatment capex |
| State manufacturing licenses | State regulators | Alcohol, dairy, and selected categories | Varies by state and product class |
This table demonstrates why compliance should be part of the feasibility budget and schedule. It is not simply a legal task; it shapes layout, process, documentation, and launch timing.
Water Quality and Wastewater Management Feasibility
Water is both an ingredient and a utility backbone in beverage production. Because of that, water feasibility deserves its own section. Source water chemistry affects taste, consistency, scaling, membrane life, carbonation performance, microbial risk, and cleaning outcomes. Even when municipal water is available, treatment is often necessary to stabilize the process.
Water quality evaluation should consider hardness, alkalinity, chloramines, dissolved solids, iron, manganese, silica, microbial load, and seasonal variation. A facility producing premium still beverages may require one treatment profile, while a brewery, distillery, dairy beverage plant, or aseptic line may require a different combination of filtration, RO, UV, ozone, deaeration, or mineral adjustment. Water recovery and reject management should also be included because sustainability and utility cost pressure are increasing across the U.S.
Wastewater feasibility is equally critical. Beverage plants often generate high-strength effluent from sugars, organics, yeast, product loss, cleaning chemicals, and rinse water. Municipalities may assess surcharges based on BOD, COD, TSS, pH, and flow. In some regions, direct discharge without pretreatment is not realistic. In others, the economics may favor flow equalization, screening, pH adjustment, DAF, or biological treatment depending on plant size and product mix.
Water and wastewater planning is one of the strongest indicators of whether a feasibility study is truly serious. Plants in drought-sensitive Western states, fast-growing Sun Belt municipalities, or older industrial sewer districts often face constraints that are easy to miss during early real estate evaluation. A site that looks ideal logistically can become a poor choice if water and sewer capacity are weak.
This comparison chart shows a realistic way to evaluate suppliers or product families during feasibility. The best option is rarely the cheapest piece of equipment; it is the one that balances capital efficiency with room to scale.
| Water/Wastewater Topic | Why It Matters | Typical Solution | Main Feasibility Risk |
|---|---|---|---|
| Source water consistency | Protects taste and process repeatability | Blended treatment train | Unstable product quality |
| Mineral control | Prevents scaling and flavor variation | Softening, RO, remineralization | Equipment fouling and downtime |
| Microbial control | Supports safety and shelf life | UV, ozone, sanitary storage | Contamination events |
| Water use intensity | Lowers cost and sustainability impact | Recovery loops, optimized CIP | High operating cost |
| High-strength effluent | Affects sewer fees and compliance | Equalization, pH control, DAF, biological steps | Municipal surcharges or denial |
| Chemical discharge profile | Influences permit conditions | Segregated cleaning waste handling | Permit violations |
| Future utility expansion | Supports scale-up | Modular treatment design | Rebuild needed too early |
The table above helps explain why sustainable design is becoming a financial issue, not only an environmental one. By 2026, water reuse, lower chemical consumption, and more efficient CIP design will increasingly influence operating margin and customer perception.
Risk Assessment and Sensitivity Analysis for Beverage Projects
No beverage project should be approved based only on a base-case model. Risk assessment tests what happens when the project faces real-world pressure. In the U.S. beverage sector, common risks include demand volatility, ingredient inflation, aluminum and PET pricing swings, utility cost spikes, labor shortages, delayed permits, slower-than-expected startup, customer concentration, and quality failures during launch.
Sensitivity analysis usually examines several variables: sales volume, line efficiency, gross margin, packaging cost, labor cost, utility cost, and capex overrun. A project that only works at 95% utilization and perfect margin assumptions is not robust. A more defensible project remains viable even when sales ramp more slowly or when startup scrap is higher than expected.
Operational risk should also be considered by product type. Fermented beverages carry biological variability. Aseptic systems have validation and sterility risks. Dairy beverages require tight sanitation execution. Carbonated products may suffer from CO2 supply fluctuations or dissolved oxygen issues. Alcohol projects may face licensing delays or state route-to-market constraints. Regional weather risk matters too: hurricane exposure on the Gulf and Southeast coasts, freeze events in Texas, wildfire logistics disruption in the West, and winter freight interruptions in the Upper Midwest and Northeast.
One reason companies bring in DPS for feasibility is that the firm combines engineering, project execution, and business-minded judgment. Its project philosophy emphasizes honest challenge, not passive approval. If a client is planning to spend heavily to solve the wrong bottleneck, the analysis is expected to say so. That type of radical transparency is essential in risk review because the most expensive error is often not a visible machine issue, but a flawed project assumption that nobody questioned early enough.
| Risk Variable | Low Case Example | Base Case Example | High-Risk Outcome |
|---|---|---|---|
| Volume ramp | 70% of forecast by year 1 | 85% of forecast by year 1 | Debt pressure and delayed break-even |
| Packaging cost | Stable annual contracts | Moderate inflation | Margin compression on fixed customer pricing |
| OEE performance | 75% | 65% | Need for extra shifts or missed demand |
| Capex delivery | On budget | 5% over | 15% to 20% overrun and cash strain |
| Permit timing | On schedule | 30-day delay | 90-day delay and lost customer launch |
| Labor availability | Stable staffing | Higher overtime usage | Training gaps and quality risk |
| Utility rates | Flat | Moderate increase | Energy-intensive products lose profitability |
The value of this table is simple: executives can see which variables matter most and build contingency plans before money is spent. In many cases, the right answer is phased investment, flexible equipment selection, or selecting a different site with lower utility or labor risk.
As a practical case perspective, beverage projects that scale successfully in the United States usually share three traits. First, they align production capability with a realistic customer pipeline. Second, they build utility and sanitation systems with enough flexibility for future SKU changes. Third, they use experienced owner-side engineering or integrated project leadership to prevent late-stage surprises. Those principles are visible in advanced co-packing, brewing, distillation, soft drink, and aseptic projects across North America.
FAQ
How long does a beverage plant feasibility study usually take in the United States?
A focused study may take four to eight weeks, while a complex greenfield or multi-line analysis can take several months depending on site options, process complexity, and permit research depth.
What products benefit most from a full feasibility study?
High-growth or technically demanding categories such as RTD beverages, dairy drinks, functional products, kombucha, canned cocktails, aseptic beverages, and high-volume carbonated products benefit the most because errors in design or utility planning are expensive.
Can a feasibility study help decide between co-packing and owning a plant?
Yes. It can compare tolling rates, margin retention, control over quality, volume thresholds, working capital needs, and strategic flexibility. Many brands should begin with co-packing, while others justify ownership once demand stabilizes.
What is the biggest hidden cost in beverage plant projects?
Utilities and infrastructure are common hidden costs. Water treatment, wastewater management, power upgrades, compressed air, glycol, drainage, and automation integration are frequently underestimated.
Do small beverage brands need engineering input this early?
Yes, especially if they plan to scale. Early engineering input prevents expensive site mistakes and helps define whether the business should build, retrofit, or outsource production first.
How important is wastewater analysis for beverage manufacturing?
Very important. Sugars, organics, and cleaning chemicals can create high-strength wastewater that leads to pretreatment requirements or municipal surcharges. Ignoring this can break an otherwise attractive project.
What should buyers ask equipment suppliers during feasibility?
Ask about actual throughput at your product type, changeover time, sanitation method, spare parts availability, controls compatibility, utility consumption, and whether the equipment can support future packaging formats.
Why work with an integrated engineering and execution partner?
Because feasibility becomes more accurate when the same team understands design, installation, controls, utilities, and startup. This reduces the gap between concept and real plant performance.
What makes DPS relevant for beverage feasibility projects?
DPS combines process engineering, capital planning, owner representation, project management, equipment integration, utility design, automation, and turnkey execution for beverage and food manufacturers across North America. Its practical focus is on profitable project outcomes rather than simply increasing project size.
What should companies do next after a positive feasibility study?
The next step is usually concept design, site control, capital approval, permit planning, equipment strategy, and phased execution scheduling. A strong feasibility study should provide a clear roadmap into that next stage.
For U.S. beverage companies, a feasibility study is not a formality. It is the bridge between ambition and execution. Whether the goal is a new co-packing platform, a brewery expansion, an RTD launch, a dairy beverage facility, or an aseptic line, the project should be tested across market demand, technical fit, financial resilience, site readiness, compliance, water strategy, and operational risk. Done properly, the process creates more than a report. It creates a smarter investment path.
[/trp_language]
Complete Company Portfolio

About the Author: Disruptive Process Solutions (DPS)
The DPS team combines process engineering expertise with real-world food and beverage manufacturing experience. Our content focuses on process optimization, production efficiency, facility improvements, and practical solutions that help manufacturers operate more effectively in a rapidly evolving industry.
Share

