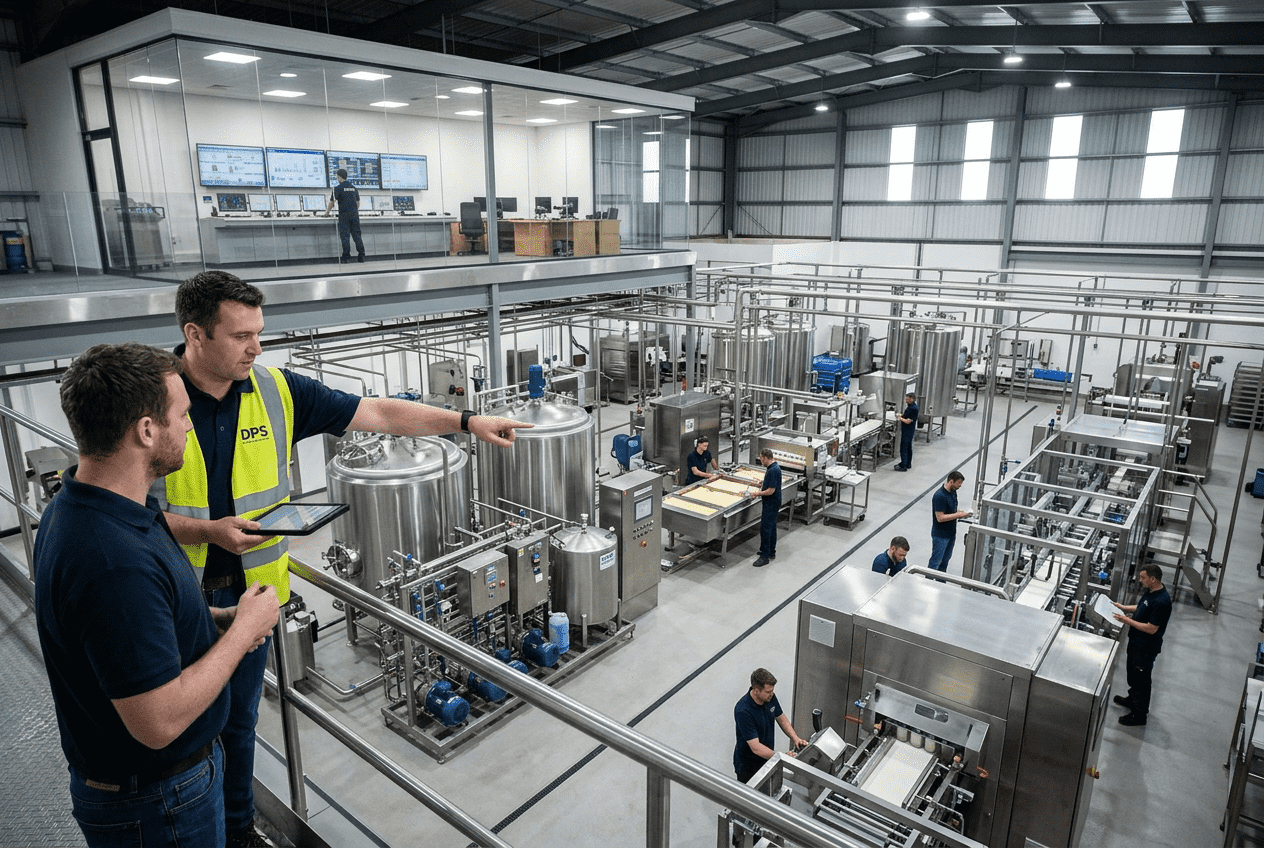
Beverage Plant ROI Analysis
[trp_language language=”en_US”]
Beverage Plant Return on Investment Analysis in the United States
For beverage manufacturers in the United States, return on investment is not just a finance metric. It is the operating logic behind every tank, filler, boiler, syrup room, warehouse lane, and labor schedule. A strong beverage plant ROI analysis connects capital spending to throughput, margin, working capital, utility demand, and market access. Whether a company is evaluating a greenfield plant in Texas, an expansion in North Carolina, or a contract manufacturing strategy near Chicago or Los Angeles, the goal is the same: invest capital where the profit path is clearest and the operational risk is manageable.
In practical terms, a U.S. beverage ROI model should answer five questions. First, how much volume can the plant realistically sell by SKU and channel? Second, what will it cost to make and deliver each unit? Third, how long until the project reaches break-even and positive free cash flow? Fourth, how sensitive is the investment to seasonality, freight, labor shortages, and packaging costs? Fifth, which project structure creates the best return: new build, plant expansion, or outsourcing production?
This guide is written for beverage executives, private equity operators, plant managers, founders, controllers, lenders, and investors who need a usable framework, not a generic formula. It also reflects the way sophisticated engineering partners approach capital planning. Companies such as Disruptive Process Solutions work at the intersection of process design, construction execution, and profitability planning, helping clients align facility decisions with real commercial outcomes rather than simply installing equipment.
Quick Answer

Beverage plant ROI analysis is the process of measuring whether a manufacturing investment will generate enough operating profit and cash flow to justify its cost. In the United States, this usually means modeling capital expenditure, sales volume by product and channel, cost of goods sold, labor, utilities, logistics, maintenance, and financing costs over a multi-year period. A good model estimates payback period, internal rate of return, net present value, break-even volume, and downside risk under different operating scenarios.
For most beverage projects, ROI improves when capacity is phased, SKU complexity is controlled, packaging is standardized, and utility infrastructure is sized to actual ramp-up rather than ultimate theoretical demand. Plants that look attractive on a simple revenue multiple often underperform if line changeovers are frequent, warehouse throughput is constrained, or the market mix shifts toward lower-margin channels. Conversely, some projects that appear expensive upfront create superior long-term returns because they reduce labor dependence, improve yield, and support higher-value product categories such as functional beverages, RTD cocktails, aseptic products, or premium co-packing.
If leadership needs a quick rule of thumb, the investment should not be approved until management can explain: the expected annual contribution margin, the monthly cash burn during ramp-up, the exact break-even case volume, the utilization rate needed for target EBITDA, and the fallback plan if demand arrives six to twelve months later than forecast.
What Is Beverage Plant ROI Analysis?

Beverage plant ROI analysis is a structured financial and operational study used before a capital decision is made. It combines engineering assumptions with commercial assumptions. Finance teams often start with a formula such as annual net profit divided by total investment, but that is only the surface. In beverage manufacturing, ROI depends on line speeds, fill size mix, sanitation time, package availability, warehouse turns, route density, and compliance requirements.
In the U.S. market, the analysis is especially important because production economics vary sharply by geography and product type. A carbonated soft drink line near Atlanta may benefit from access to distribution lanes across the Southeast. A functional beverage co-packer in Southern California may face higher labor and real estate costs but gain faster access to West Coast retail and import channels through Long Beach and Los Angeles. A Midwest operation near Columbus or Indianapolis may optimize freight and improve service levels to grocery, club, and e-commerce networks.
ROI analysis also helps define the best project scope. Some investments fail not because the technology is wrong, but because the project is oversized, underutilized, or poorly sequenced. A business may not need a full new plant in year one. It may need debottlenecking, a revised controls strategy, a better CIP system, an upgraded blending room, or an additional packaging format that unlocks margin. This is where engineering discipline matters. The most effective project teams evaluate the plant as a profit engine, not just a collection of assets.
From a capability standpoint, a strong engineering partner should understand process systems such as blending, batching, carbonation, pasteurization, aseptic handling, water treatment, utilities, automation, and SCADA. Those technological capabilities directly influence yield, uptime, labor productivity, and quality consistency, all of which feed the ROI model.
ROI Calculation Framework for Beverage Manufacturing Investments

A practical ROI framework for beverage manufacturing starts with four layers: capital costs, operating economics, cash flow timing, and risk adjustment. Capital costs include land, building, process equipment, utilities, controls, installation, startup, permitting, validation, and contingency. Operating economics include volume, net sales, gross margin, labor, maintenance, freight, overhead, and working capital. Cash flow timing reflects when spending occurs versus when revenue begins. Risk adjustment tests what happens if volume ramps slower, costs rise, or customer mix changes.
The most common performance metrics include simple ROI, payback period, EBITDA margin, free cash flow, break-even units, net present value, and internal rate of return. In board discussions, payback and downside resilience often matter more than top-line enthusiasm. Lenders and investors also want to see how the business performs at 60%, 75%, and 90% of projected volume, not just at full utilization.
| Model Component | What It Includes | Why It Matters | Typical U.S. Concern |
|---|---|---|---|
| Capital Expenditure | Land, building, tanks, fillers, boilers, utilities, controls, installation | Sets the investment base for ROI and payback | Construction inflation and long-lead equipment |
| Startup Costs | Commissioning, training, validation, initial scrap, trial runs | Often underestimated in project approvals | Delayed labor readiness and line tuning |
| Revenue Assumptions | Units, case volume, SKU mix, channel pricing, customer rebates | Drives contribution margin and scale economics | Retail margin pressure and promotional spend |
| Production Costs | Ingredients, packaging, direct labor, utilities, sanitation | Defines gross margin quality | Aluminum, sweetener, and PET volatility |
| Fixed Operating Expense | Salaries, QA, insurance, plant overhead, maintenance | Determines break-even threshold | Higher wage floors in major metros |
| Working Capital | Inventory, receivables, payables, safety stock | Impacts real cash requirements | Seasonal builds before summer peaks |
| Financing Structure | Debt, equity, interest rates, covenants | Changes free cash flow and investor return | Rate sensitivity and collateral requirements |
The table above shows why ROI cannot be treated as a single percentage. In beverage plants, timing and operating detail matter as much as total spend. A line that runs at 600 bottles per minute on paper but loses capacity to flavor changeovers, carbonation variance, or downstream palletizing disruptions will not produce the modeled return.
The chart above illustrates a realistic growth pattern in U.S. beverage capacity investment. The trend is supported by continued demand for functional drinks, RTD alcohol, low-sugar beverages, protein beverages, and premium private label programs. However, growth does not guarantee project success. Plants must still match technology and capacity to actual demand.
Revenue Modeling: Volume Projections by SKU and Distribution Channel
Revenue modeling begins with a simple question: what exactly will the plant sell, in what package, through which channels, at what net realized price? Many beverage models fail because they forecast total annual cases without separating SKUs, package formats, line compatibility, retailer deductions, and channel-specific freight or slotting economics.
In the United States, beverage demand can vary widely by channel. Grocery offers scale but heavy price pressure. Convenience stores favor single-serve formats and faster turns. Club stores reward pallet efficiency and larger pack sizes. Foodservice can be margin-rich but contract-dependent. E-commerce has different packaging damage risk and fulfillment costs. Contract manufacturing may provide base load volume but lower gross margin per case. A credible ROI model should allocate volume by SKU and channel month by month during the ramp period.
It is also important to model product families separately: carbonated beverages, juices, dairy-based drinks, kombucha, sports nutrition, alcoholic RTDs, and aseptic products all behave differently. Shelf-life, process complexity, microbial risk, ingredient volatility, and package constraints affect both pricing and cost.
| SKU / Format | Primary Channel | Year 1 Cases | Net Revenue per Case | Gross Margin Profile |
|---|---|---|---|---|
| 12 oz can multipack | Grocery | 850,000 | $18.40 | Moderate |
| 16 oz single-serve can | Convenience | 620,000 | $24.10 | High |
| 1 liter PET bottle | Mass retail | 540,000 | $16.80 | Moderate |
| 8 oz functional shot | E-commerce | 210,000 | $37.50 | High |
| Ready-to-drink cocktail can | Regional distribution | 430,000 | $28.60 | High but regulated |
| Aseptic protein beverage | Club / private label | 300,000 | $31.20 | High if utilization is stable |
The revenue table highlights why weighted average pricing alone is not enough. A plant serving Dallas, Charlotte, and Phoenix may sell the same brand in multiple formats, but each format creates different throughput, margin, and inventory implications. The best models translate commercial plans into operational load: required hours, changeover frequency, warehouse space, and ingredient procurement cycles.
Manufacturing capabilities also matter here. A facility designed for blending, carbonation, hot fill, cold fill, fermentation, or aseptic packaging should be matched to the product portfolio. If the equipment architecture does not support the revenue mix, theoretical sales will not convert into profitable production. Companies often explore engineering and capital planning services at this stage to validate whether the line design truly supports the sales forecast.
The demand chart shows how category momentum can shift ROI assumptions. Functional beverages, RTD alcohol, and aseptic nutrition continue to attract investment because they often support stronger pricing than legacy commodity segments. Still, higher-margin categories usually require tighter process control and more sophisticated validation.
Cost Structure Analysis: COGS, Labor, and Operating Expenses
A beverage plant may win on revenue and still miss its return targets because costs are poorly understood. Cost structure analysis should separate variable costs from fixed costs and identify which items move with volume, which move with complexity, and which move with time. In most U.S. facilities, cost of goods sold includes ingredients, packaging materials, direct labor, utilities, sanitation chemistry, quality consumables, and line scrap. Operating expenses include supervision, maintenance, insurance, software, warehouse overhead, property taxes, and administrative support.
Packaging is often the largest cost driver after labor and ingredients. Aluminum cans, closures, corrugate, labels, and PET resin can materially change project economics. Ingredient costs are also volatile in categories using sweeteners, dairy inputs, fruit concentrates, caffeine systems, nutraceuticals, or alcohol bases. Utilities matter more than many executive teams expect, especially where boilers, chillers, compressed air, tunnel pasteurization, or aseptic sterilization are involved.
| Cost Category | Typical Cost Driver | Variable or Fixed | ROI Impact |
|---|---|---|---|
| Ingredients | Formula complexity, commodity pricing, yield | Variable | Direct effect on gross margin |
| Packaging | Can, bottle, closure, tray, label, carton | Variable | Often the largest unit cost |
| Direct Labor | Shift pattern, automation level, overtime | Mixed | Strong effect during ramp-up |
| Utilities | Steam, water, compressed air, glycol, electricity | Mixed | Important for thermal and aseptic lines |
| Maintenance | Spare parts, preventive work, service contracts | Fixed / semi-variable | Protects uptime and long-term margins |
| Quality and Compliance | Lab tests, records, sanitation verification | Fixed / semi-variable | Critical for regulated categories |
| Freight and Distribution | Distance to customers, pallet density, backhaul | Variable | Can erase margin in low-price channels |
The explanation from this table is straightforward: not all costs scale the same way. Labor may rise faster than volume in a manual packaging environment, while utilities may be more efficient at higher throughput if the system is properly sized. This is why automation decisions must be evaluated in ROI terms, not only in engineering terms.
Service capabilities are especially relevant in cost analysis. A full-scope partner that can combine process engineering, owner representation, project management, installation oversight, equipment integration, and commissioning can reduce hidden cost leakage during execution. That is one reason many manufacturers review both project strategy and equipment sourcing together, including specialized process equipment options that fit the production profile without overspending on unnecessary complexity.
The area chart shows a broad industry shift toward automation. By 2026 and beyond, labor reliability, traceability, and energy management are expected to play larger roles in plant economics. Automation does not always reduce headcount immediately, but it can improve yield, shorten changeovers, strengthen data visibility, and reduce compliance risk.
Break-Even Analysis and Profitability Timeline for Beverage Plants
Break-even analysis identifies how many cases, production hours, or revenue dollars are needed before the plant covers all fixed and variable costs. For a new beverage facility, this should be mapped monthly, not just annually. The first twelve to twenty-four months often include training losses, vendor learning curves, working capital spikes, and customer onboarding delays.
A useful break-even model includes at least three scenarios: conservative, base, and accelerated ramp. In the conservative case, launch customers order late, scrap is high, and freight is inefficient. In the base case, volume builds as expected. In the accelerated case, customer demand is strong but additional working capital and labor are required sooner. Management should know whether growth creates a cash need before it creates a profit benefit.
| Scenario | Monthly Break-Even Cases | Expected Break-Even Month | Estimated EBITDA Margin at Stabilization |
|---|---|---|---|
| Small regional startup line | 110,000 | Month 14 | 11% |
| Mid-scale carbonated plant | 240,000 | Month 16 | 15% |
| Functional beverage line | 155,000 | Month 12 | 18% |
| RTD alcohol co-packing line | 190,000 | Month 15 | 17% |
| Aseptic nutrition line | 130,000 | Month 18 | 20% |
| Multi-format expansion project | 175,000 | Month 10 | 16% |
This table shows that faster break-even does not always mean better long-term economics. A complex aseptic line may take longer to stabilize but deliver stronger margins once commercial volume is secured. An expansion within an existing plant may break even earlier because utilities, labor leadership, and quality systems are already in place.
Case studies often reveal this clearly. In one type of real-world scenario, a manufacturer may assume that a multimillion-dollar capacity expansion is needed to unlock growth, only to discover that the actual bottleneck is controls logic, scheduling, or line synchronization. Evaluating debottlenecking before construction can dramatically improve ROI. Manufacturers comparing options often benefit from reviewing prior project case examples that show how engineering decisions changed commercial results.
Seasonal Cash Flow Impact on Beverage Plant ROI
Seasonality is one of the most underappreciated risks in beverage economics. Demand for soft drinks, teas, sports beverages, and convenience-oriented products often builds ahead of spring and summer. Retail promotions, distributor inventory builds, and ingredient buys can force a plant to spend cash months before revenue converts into collections. If the model does not include seasonal inventory and receivable pressure, the project can appear profitable on paper while straining liquidity in practice.
Seasonal cash flow analysis should track monthly raw material purchases, finished goods inventory, accounts receivable days, and the timing of promotional deductions. It should also account for planned shutdowns, maintenance windows, weather disruptions, and utility peaks. For alcoholic beverages, seasonality may tie to holiday demand or distributor ordering patterns. For functional drinks, social media campaigns and retailer resets can create lumpy order timing.
| Month Group | Typical Demand Pattern | Cash Flow Risk | Planning Response |
|---|---|---|---|
| January-February | Reset period, mixed demand | Post-holiday receivable lag | Tight inventory control |
| March-April | Pre-season build | Working capital spike | Secure packaging early |
| May-July | Peak shipment period | Labor overtime and freight premiums | Add temporary capacity plans |
| August-September | High but normalizing demand | Customer forecast volatility | Adjust procurement cadence |
| October-November | Channel-specific promotions | Inventory imbalance by SKU | Use demand segmentation |
| December | Holiday timing effects | Production scheduling inefficiency | Coordinate shutdown and maintenance |
The table makes clear that ROI is inseparable from cash timing. A plant can report solid annual margins while still requiring emergency financing if summer inventory builds are not funded. In the United States, this is particularly relevant for businesses shipping into large retail networks from hubs such as Atlanta, Chicago, Dallas-Fort Worth, the Inland Empire, or New Jersey distribution corridors.
Comparing ROI: New Build vs Expansion vs Contract Manufacturing
When beverage companies plan for growth, they usually face three strategic paths. The first is a new build, which offers control and long-term capacity but requires the most capital and the longest ramp. The second is expansion of an existing facility, which usually improves payback because utilities, workforce, and compliance systems already exist. The third is contract manufacturing, which minimizes initial capital but can reduce margin control and scheduling flexibility.
The correct choice depends on commercial certainty, category complexity, geographic needs, and capital access. A greenfield facility may be ideal for a company with secured multi-customer demand and a long-term footprint strategy. An expansion is often best when an existing site already serves the market well and bottlenecks are identifiable. Contract manufacturing is useful when demand is uncertain, product development is still evolving, or leadership wants to preserve capital for sales and brand building.
| Option | Capital Requirement | Speed to Market | Margin Potential | Control Level |
|---|---|---|---|---|
| New Build | Highest | Slowest | Highest long-term | Very high |
| Existing Plant Expansion | Moderate | Medium | High | High |
| Contract Manufacturing | Low | Fast | Lower to moderate | Limited |
| Hybrid Start with Co-Pack, Build Later | Low to moderate | Fast initially | Improves over time | Increasing |
| Utility and Line Debottlenecking | Low to moderate | Fast | High if capacity unlocks | High |
| Regional Satellite Packaging Operation | Moderate | Medium | Channel-specific | Moderate to high |
This comparison shows why many U.S. manufacturers do not jump directly to a new plant. A phased approach can preserve capital and reduce demand risk. For example, a brand may co-pack in the Midwest while validating East Coast grocery traction, then expand into owned capacity in the Carolinas once annualized demand is more predictable. Others may expand an existing Texas site to serve both regional growth and export adjacency through Gulf Coast logistics.
The comparison chart reflects a common reality: expansions often produce the strongest risk-adjusted ROI, while new builds offer the highest strategic upside if utilization is secured. Hybrid models are becoming more popular as companies manage uncertainty while preserving future optionality.
How to Use ROI Models to Secure Financing and Investor Buy-In
Lenders and investors do not fund enthusiasm; they fund disciplined assumptions. To secure financing for a beverage plant, management should present an ROI model that is operationally grounded, sensitivity-tested, and supported by realistic execution plans. The model should show revenue by customer and channel, not just by category. It should quantify line utilization, labor efficiency, gross margin by SKU family, and monthly cash flow through the ramp period.
Strong financing packages typically include a base case, downside case, and mitigation plan. The downside case should address delayed customer wins, higher packaging costs, labor inefficiency, slower commissioning, or reduced throughput. The mitigation plan should explain how the company can phase equipment, adjust shifts, outsource overflow, or defer noncritical capital.
This is also where a credible project partner adds value. Investors respond well when the engineering and construction approach is integrated with the business case. A design-build-manage mindset is useful because it connects concept, budget, execution, and operating performance. In practice, this means the plant is not being designed in a vacuum. It is being engineered around return targets, startup timing, compliance needs, and long-term maintainability.
For 2026 and beyond, financing conversations increasingly include automation readiness, sustainability, and policy resilience. Lenders want to know whether a plant can manage energy use, water efficiency, traceability, and future regulatory requirements. Projects with heat recovery, efficient CIP design, better water treatment, stronger controls, and utility right-sizing may attract better support because they show lower long-term operating risk. Sustainability should not be treated as a branding add-on. In beverage manufacturing, it is increasingly tied to actual cash economics and investor confidence.
When presenting to investors, include the following buying advice. First, do not overbuild for a five-year dream if the first two years are uncertain. Second, protect the project with flexible line design and clear debottleneck plans. Third, invest in automation where it solves a measurable cost or compliance problem. Fourth, anchor location strategy around customer density, labor quality, utility reliability, and freight access. Fifth, choose engineering and execution teams that understand both manufacturing reality and capital discipline.
From an “our company” standpoint, Disruptive Process Solutions is relevant because it approaches projects as profitability platforms rather than equipment-only jobs. Its teams support beverage and food manufacturers across the United States and Canada with process engineering, capital planning, owner representation, project management, equipment integration, installation, and execution oversight. Its beverage experience spans brewing, distillation, wine, kombucha, RTD, carbonated and non-carbonated drinks, dairy beverages, and aseptic systems. That breadth matters because ROI improves when technical design, manufacturing fit, and service execution align from the start.
FAQ
What is the best ROI metric for a beverage plant?
There is no single best metric. Most U.S. operators use a combination of payback period, EBITDA margin, free cash flow, break-even volume, and internal rate of return. For lenders, downside cash flow often matters more than headline ROI.
How long does it usually take a beverage plant to break even?
Many projects break even between 10 and 24 months after startup, depending on scale, category, existing customer commitments, and how much infrastructure already exists. Expansions usually break even faster than greenfield builds.
Should I build a plant or use contract manufacturing first?
If demand is still uncertain, contract manufacturing or a hybrid model is often safer. If volume is secured and margin control matters, an owned plant or expansion may create better long-term returns.
What costs are most often missed in ROI models?
Startup scrap, commissioning labor, utility upgrades, quality compliance costs, spare parts, inventory carrying costs, and seasonal working capital are frequently underestimated.
How important is plant location in the United States?
Very important. Freight density, labor availability, utility reliability, water access, tax structure, and customer proximity can materially change ROI. Cities and corridors such as Dallas-Fort Worth, Atlanta, Chicago, Charlotte, Columbus, Phoenix, and Southern California each offer different advantages.
How does automation affect beverage plant ROI?
Automation can improve yield, uptime, traceability, sanitation consistency, and labor efficiency. It works best when tied to a specific financial outcome, such as reducing overtime, shortening changeovers, or improving batch accuracy.
What should investors want to see in a beverage ROI model?
Investors should expect detailed revenue assumptions by SKU and channel, realistic throughput assumptions, monthly cash flow, working capital needs, downside scenarios, and a clear execution plan supported by experienced engineering and project teams.
What trends will matter most in 2026?
Expect more emphasis on energy efficiency, water reuse, data visibility, automation, traceability, domestic supply resilience, and sustainability-linked operating design. Functional beverages, premium RTD categories, and aseptic nutrition are likely to remain active investment areas.
In summary, beverage plant ROI analysis in the United States is most effective when it connects market demand, product strategy, engineering design, and financial discipline in one model. The companies that outperform are usually the ones that ask the hardest questions before spending capital: where profit will come from, what operational constraints could delay it, and which investment structure creates the best risk-adjusted return.
[/trp_language]
Complete Company Portfolio

About the Author: Disruptive Process Solutions (DPS)
The DPS team combines process engineering expertise with real-world food and beverage manufacturing experience. Our content focuses on process optimization, production efficiency, facility improvements, and practical solutions that help manufacturers operate more effectively in a rapidly evolving industry.
Share

