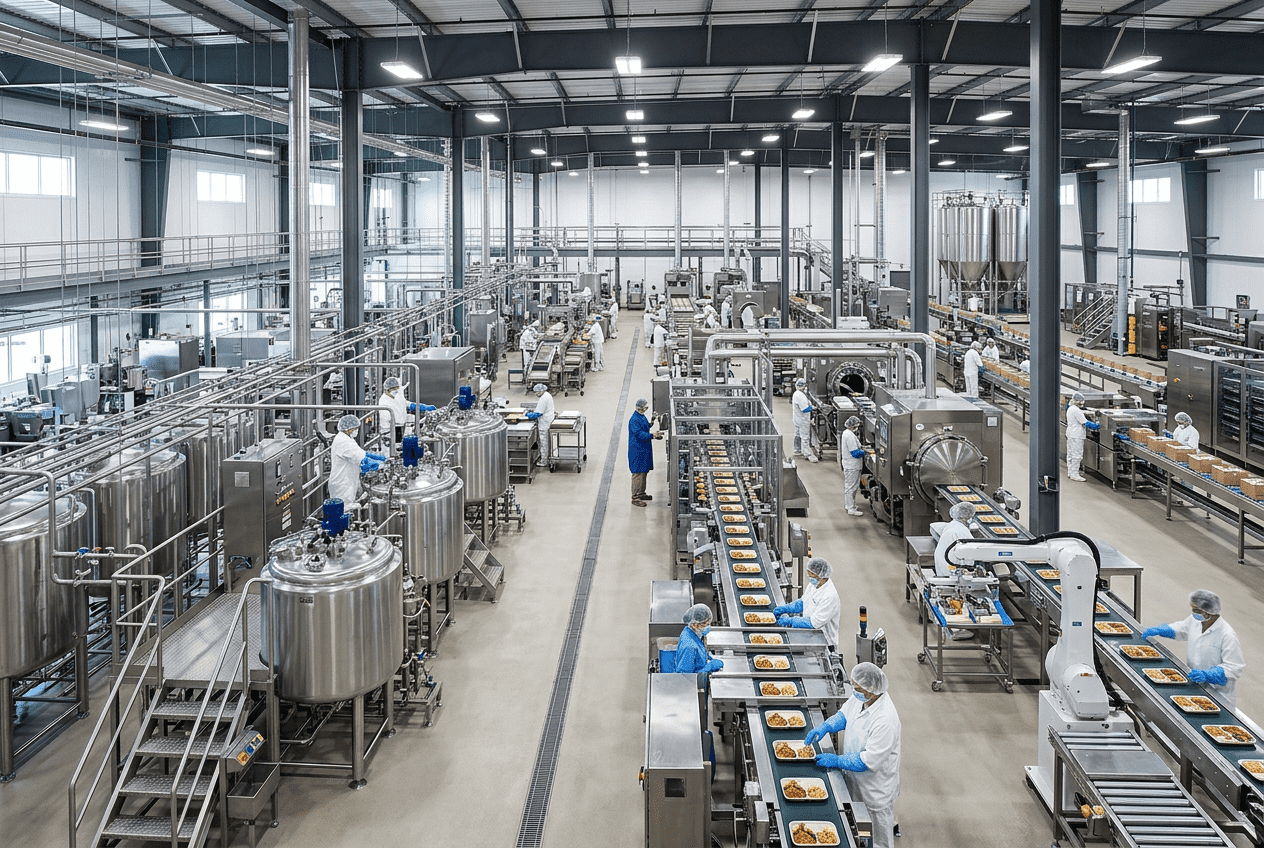
Beverage Factory Expansion Feasibility
[trp_language language=”en_US”]
Beverage Factory Expansion Feasibility in the United States
Expanding a beverage plant in the United States can create major profit upside, but only when capacity, utilities, layout, labor, automation, and financial returns are evaluated together. Many manufacturers assume they need a new line, a larger syrup room, or additional packaging equipment, when the real limit is often hidden inside controls logic, CIP scheduling, wastewater treatment, compressed air, or warehouse flow. A disciplined expansion review helps beverage producers avoid overbuilding and directs capital toward the true constraint.
For U.S. manufacturers producing soft drinks, ready-to-drink beverages, spirits, juices, kombucha, dairy beverages, brewing products, and aseptic formats, expansion decisions are increasingly tied to regional distribution strategy, retailer service levels, freight economics, and utility resilience. Plants near major trade corridors such as Chicago, Dallas-Fort Worth, Atlanta, Los Angeles/Long Beach, Savannah, Houston, and New Jersey often see strong scale opportunities, but they also face tight labor markets, more demanding municipal utility rules, and increasingly complex compliance expectations.
This guide explains how to assess whether a beverage facility is truly ready for expansion, what technical and financial criteria matter most, and how to build a smarter project plan that protects long-term profitability.
Quick Answer

Yes, a beverage factory is ready for expansion only when five core conditions are met: current bottlenecks are clearly identified, the building and site can physically support additional process and packaging assets, water and wastewater systems have sufficient reserve capacity, the expansion delivers acceptable payback under realistic demand scenarios, and the project can be executed without destabilizing seasonal production commitments.
In practice, that means a U.S. beverage producer should validate:
- Actual line capacity versus advertised equipment capacity
- Utility headroom for water, wastewater, steam, glycol, compressed air, and electrical loads
- Space for production, maintenance access, sanitation, material movement, and future growth
- Automation readiness, data visibility, and recipe or batch control limitations
- Labor availability, training impact, and maintenance support requirements
- Return on invested capital under base, high, and low demand cases
If one or more of these areas is weak, expansion can still happen, but the project scope must be adjusted. Often, a targeted debottlenecking effort produces better returns than a full line addition.
| Assessment Area | Key Question | Typical Risk if Ignored | Primary Metric | Decision Impact | Priority Level |
|---|---|---|---|---|---|
| Throughput | Where is the real production constraint? | Overbuying equipment | Cases per hour realized | Determines scope | Very High |
| Utilities | Can the plant support added load? | Frequent downtime | Peak utility demand | Determines infrastructure spend | Very High |
| Layout | Is there space for safe flow? | Congestion and sanitation issues | Available square footage | Determines constructability | High |
| Controls | Can automation coordinate new assets? | Reduced OEE | System response and integration | Determines upgrade need | High |
| Financials | Does payback meet investment targets? | Weak capital efficiency | IRR / payback | Determines approval | Very High |
| Timing | Can work avoid peak season disruption? | Lost revenue during install | Shutdown window | Determines schedule | High |
The table above shows why beverage plant expansion cannot be judged by sales growth alone. Even when customer demand is strong, utility or process limitations can turn a seemingly simple growth project into an expensive underperformer.
Is Your Beverage Factory Ready for Expansion? Key Assessment Criteria

The first step is separating market demand from operational readiness. A factory may have enough orders to justify more output, but if uptime, changeover discipline, sanitation windows, or tank utilization are weak, adding equipment may only magnify inefficiency. In the United States, where labor, construction, and utility costs vary sharply by region, expansion readiness must be measured with operating data, not assumptions.
Producers serving retailers, foodservice channels, club stores, and contract manufacturing customers should review at least 12 to 24 months of operating history. This should include hourly performance by SKU family, downtime causes, shift staffing, utility peaks, warehouse turnover, and customer service penalties. Plants in high-growth beverage categories such as energy drinks, functional beverages, alcohol alternatives, premium mixers, and aseptic RTD coffee should also stress-test demand against packaging supply lead times and regional freight patterns.
Useful readiness criteria include:
- Sustained OEE above target on the current constraint asset
- Documented sold demand or customer pipeline that exceeds practical capacity
- Stable quality performance under current volume
- Reliable raw material and packaging supply chain
- Adequate floor space or a viable building/site expansion path
- Municipal approval feasibility for added water use and discharge
U.S. beverage plants near major logistics hubs often have an advantage. For example, distribution from Indianapolis, Memphis, Kansas City, and Columbus can reduce outbound freight to broad regions of the country. However, those savings can be erased if the plant lacks wastewater permit flexibility or cooling capacity during summer production surges.
At this stage, many manufacturers benefit from an outside engineering perspective. A firm like Disruptive Process Solutions approaches readiness from a business-first standpoint, focusing on whether capital will improve profitability rather than simply increase installed equipment. That mindset matters because the best answer is not always “build bigger”; sometimes it is “fix the process first.”
| Readiness Criterion | Healthy Signal | Warning Signal | Data Source | Typical Fix | Expansion Relevance |
|---|---|---|---|---|---|
| Demand visibility | 12+ months forecasted orders | Spotty promotional spikes only | Sales and S&OP | Scenario planning | High |
| OEE stability | Consistent output by shift | Large variance across teams | Line reporting | Training and controls tuning | High |
| Quality yield | Low rework and holds | Frequent flavor or fill deviations | QA records | Process standardization | High |
| Utility reserve | 15%+ headroom | Near peak utility loads | Utility logs | Infrastructure upgrades | Very High |
| Warehouse flow | Clear pallet movement | Staging congestion | Operations audit | Layout redesign | Medium |
| Maintenance readiness | PM compliance above target | Reactive repair culture | CMMS data | Spare parts and PM reset | Medium |
This readiness matrix helps teams decide whether expansion capital should go into new production assets, utility reinforcement, software integration, or operational discipline first.
The market growth trend above reflects a realistic view of continued U.S. beverage investment. Growth is not uniform across all categories, but the broader direction supports careful capacity planning, especially in high-value packaged beverage segments.
Bottleneck Analysis: Identifying Constraints in Current Operations

The most important expansion question is simple: what is actually limiting throughput today? In beverage operations, the bottleneck is often dynamic. On one SKU run it may be blending, on another it may be filler speed, tunnel pasteurization, label application, secondary packaging, or palletizing. In some facilities, the true bottleneck is not hardware at all. It may be CIP turnaround time, PLC logic, changeover sequencing, or operator staffing.
A good bottleneck study maps the full production path from ingredient receiving through batching, blending, treatment, filling, packaging, palletizing, warehousing, and loadout. It should look at both peak rate and sustained rate. Advertised equipment speed is rarely the number that matters; sellable output over an entire shift is what drives economics.
For example, a carbonated soft drink plant in Texas may have a filler rated at 600 bottles per minute, yet only average 68% of theoretical output because syrup changeovers, CO2 management, capper stoppages, and downstream accumulation issues reduce run efficiency. In that case, buying a faster filler would not solve the problem. A better answer may be controls reconfiguration, accumulation redesign, or improved line balancing.
This is where practical engineering experience matters. DPS has built a reputation by identifying hidden constraints before clients commit unnecessary capital. The company’s technology depth includes process engineering, controls engineering, PLC programming, automation, SCADA, and integration across utilities and production systems. In one representative situation, the real bottleneck was controls-related, and resolving the PLC limitation created a significant capacity gain without forcing a multimillion-dollar expansion. That kind of analysis protects capital and often improves payback more than a new asset purchase.
| Process Area | Common Constraint | Symptom | Diagnostic Method | Typical Remedy | Capital Intensity |
|---|---|---|---|---|---|
| Receiving and storage | Tank turnover | Idle filler waiting on product | Tank utilization study | Add storage or sequencing logic | Medium |
| Batching and blending | Recipe cycle time | Late product release | Batch timing analysis | Automation and inline monitoring | Low to Medium |
| Thermal process | HTST or UHT throughput | Queue before filler | Flow and hold-time review | Heat exchanger upgrade | High |
| Filling | Microstops and sanitation loss | Low sustained speed | Downtime Pareto | Mechanical and controls tuning | Low to High |
| Packaging | Case packer limits | Downstream backup | Line balance audit | Add accumulation or replace packer | Medium |
| Utilities and CIP | CIP window overlap | Delayed restart | Schedule and flow mapping | Additional CIP set or tanking | Medium |
This table shows that not every bottleneck requires major construction. Some can be solved through sequencing, controls, and process optimization, which usually produce faster returns.
The bar chart highlights where expansion demand is strongest across beverage segments. High-growth categories typically justify faster investment decisions, but they also require more disciplined risk screening because product mix can shift rapidly.
Space and Layout Feasibility for Beverage Line Additions
Even when demand and utilities support growth, the building may not. Space and layout feasibility is more than finding enough floor area for a new filler or canning line. U.S. plants must also consider access for installation, code-required clearances, sanitation zoning, traffic separation, mezzanine loading, forklift flow, ingredient staging, spare parts access, and future maintenance.
Layout failures are expensive because they create lasting inefficiency. A line inserted into an already crowded building can generate chronic congestion between depalletizing, packaging material feed, QA hold zones, and finished goods staging. It can also compromise food safety design by crossing raw and finished traffic paths or by creating hard-to-clean dead spaces.
For beverage categories such as kombucha, dairy beverages, and aseptic products, hygienic zoning becomes even more important. Additional tanks, valves, transfer piping, and CIP return routing must be evaluated as a system, not as isolated pieces of equipment.
DPS supports this kind of planning through integrated engineering disciplines that include structural, mechanical, plumbing, electrical, process, and controls design. That matters during line addition studies because the “space” question often becomes a roof loading question, a utility corridor question, or an access and constructability question. For manufacturers reviewing possible reconfiguration or equipment relocation, the broader engineering and project delivery services available from an experienced design-build-manage partner can reduce coordination gaps and change-order risk.
| Layout Factor | Why It Matters | Minimum Review Point | Frequent U.S. Plant Issue | Recommended Action | Effect on Expansion |
|---|---|---|---|---|---|
| Equipment footprint | Determines physical fit | 2D and 3D block layout | Underestimated service clearances | Use detailed footprint models | High |
| Operator access | Supports safe operation | Walkway width | Pinch-point congestion | Maintain access lanes | High |
| Forklift traffic | Drives material flow | Inbound and outbound paths | Cross traffic at packaging areas | Separate traffic zones | Medium |
| Sanitary design | Protects product quality | Drainage and washdown access | Pooled water after cleanup | Regrade drains and utility drops | High |
| Future growth space | Avoids repeat disruption | Reserved expansion area | No room for extra tanks | Master-plan utilities | Medium |
| Installation path | Impacts project execution | Rigging and removal route | Insufficient exterior access | Plan temporary openings | Medium |
Layout reviews often reveal that minor relocation of existing assets can unlock better value than a building addition. In dense urban or suburban U.S. sites where land costs are high, reflowing operations may be more economical than expanding the footprint.
Water and Wastewater Infrastructure Capacity for Expansion
Water and wastewater are among the most underestimated factors in beverage expansion planning. Beverage plants consume water for product, CIP, sanitation, boiler feed, cooling tower makeup, and general operations. The plant may be able to fit a new line physically, yet still fail expansion feasibility because municipal water pressure, pretreatment, or discharge permits cannot support added volume.
This issue is particularly important in regions facing infrastructure or sustainability pressure, including parts of California, Arizona, Colorado, and fast-growing areas of the Southeast. Plants near major metros like Phoenix, San Diego, Charlotte, and Austin may encounter stricter water management expectations, rising rates, or longer permitting timelines.
Wastewater is just as critical. Increased sugar loads, pH swings, suspended solids, alcohol content, dairy loads, or cleaning chemical discharge can overwhelm existing pretreatment systems. Municipal surcharges can quickly erode the economics of expansion if not modeled in advance.
Strong beverage expansion planning therefore includes incoming water quality analysis, treatment capability review, peak-day and peak-hour demand modeling, sewer discharge characterization, and resilience planning. DPS brings relevant capabilities here through complete utility system integration, including process water systems, reverse osmosis, disinfection, CIP, boilers and steam, glycol systems, compressed air, refrigeration, cooling towers, and wastewater coordination. This is especially valuable for beverage manufacturers adding more complex products or high-sanitation processes.
| Utility Element | Expansion Question | Typical Bottleneck | Measurement Basis | Possible Upgrade | Risk if Missed |
|---|---|---|---|---|---|
| Incoming water | Is pressure and volume sufficient? | Peak draw shortfall | Gallons per minute | Booster and storage upgrades | Line stoppages |
| Water treatment | Can quality meet product specs? | RO or filtration undersized | Flow and rejection capacity | Expanded treatment skid | Quality issues |
| CIP water demand | Can cleaning overlap with production? | Hot water shortage | Cycle demand mapping | Additional CIP tanks/heating | Longer downtime |
| Wastewater volume | Can discharge handle added output? | Sewer permit limits | Daily and hourly flow | Equalization or pretreatment | Permit breach |
| Wastewater strength | Will BOD/COD rise materially? | High sugar or dairy load | Lab characterization | Process segregation | Surcharge escalation |
| Utility redundancy | Can the plant recover from upset? | No contingency capacity | Single-point failure review | Backup pumps and controls | Production losses |
The main lesson is that beverage growth frequently depends on utility resilience as much as production equipment. A plant with strong water and wastewater planning is better positioned to support expansion, compliance, and sustainability goals at the same time.
The area chart illustrates a clear shift toward water efficiency, reuse, and sustainability-driven utility planning through 2026. This is becoming a strategic advantage, not just a compliance checkbox.
Equipment and Technology Upgrade Requirements
Once bottlenecks and utilities are understood, the next question is which equipment and technology investments will create scalable gains. In many U.S. beverage plants, a successful expansion requires more than just adding primary process equipment. It may involve packaging automation, inline quality monitoring, recipe control, data collection, energy management, or upgraded CIP architecture.
Technology requirements vary by product type:
- Carbonated soft drinks may need improved carbonation control, bright tank integration, and faster packaging synchronization.
- RTD coffee, tea, and dairy beverages may require more robust thermal processing, homogenization, aseptic interfaces, or hygienic design improvements.
- Brewing, kombucha, wine, and spirits operations may need expanded fermentation or cellar capacity, better process control, and improved CIP management.
- Functional beverages may need tighter dosing, Brix monitoring, batching accuracy, and traceability.
Manufacturing capability should be reviewed holistically. DPS supports beverage manufacturers with system design and integration across fermentation systems, pasteurization and sterilization technologies, carbonation, blending and batching, filtration, aseptic processing, filling support, and broad utility infrastructure. In addition, the company manufactures selected process equipment such as tanks and custom CIP systems, giving clients a practical path when standard off-the-shelf solutions do not match project requirements. More on those equipment options can be found through the company’s process equipment capabilities.
For 2026 and beyond, upgrade decisions are being shaped by three trends: higher automation adoption, tighter sustainability expectations, and stronger demand for operating data. Producers increasingly want systems that can scale without proportional labor growth. That means more attention to SCADA visibility, remote diagnostics, batch reporting, predictive maintenance, and energy tracking.
| Upgrade Type | Best Fit Application | Main Benefit | Typical Cost Level | 2026 Relevance | Implementation Difficulty |
|---|---|---|---|---|---|
| Inline Brix and dosing control | Juices, CSD, functional drinks | Yield and consistency | Medium | High | Medium |
| SCADA and batch reporting | Multi-SKU plants | Traceability and visibility | Medium | Very High | Medium |
| High-efficiency CIP systems | Hygienic beverage plants | Less water and downtime | Medium | High | Medium |
| Aseptic processing upgrades | Shelf-stable RTD beverages | Product flexibility | High | High | High |
| Energy management systems | Large utility users | Lower operating cost | Low to Medium | High | Low |
| Predictive maintenance tools | High-speed packaging lines | Reduced unplanned downtime | Medium | High | Medium |
These upgrade categories matter because expansion decisions should strengthen future competitiveness, not only solve today’s capacity gap.
Financial Modeling: Expansion Investment and Payback Analysis
Every beverage plant expansion should be tested against realistic economics, not optimistic top-line assumptions. The financial model should compare at least three paths: debottleneck only, partial expansion, and full expansion. It should also model a downside case where demand grows more slowly than forecast, input costs rise, or startup takes longer than expected.
In the United States, the cost of expansion is affected by location, labor rates, local permitting complexity, utility connection fees, sanitary design requirements, and whether the project includes a building expansion. A line installed in North Carolina or Tennessee may have a different cost profile than a similar line in Southern California or the Northeast corridor.
Key financial categories include:
- Process and packaging equipment
- Utilities and infrastructure upgrades
- Building modifications and structural work
- Controls, software, and electrical scope
- Installation, commissioning, and validation
- Owner’s costs, contingency, and startup inventory
Service capabilities are especially important here. DPS supports capital planning, feasibility studies, owner’s representation, project and program management, general contracting where licensed, and turnkey installation and integration. That end-to-end model helps manufacturers connect financial assumptions to actual execution realities, which is critical when estimating startup risk and payback timing.
| Scenario | Estimated Capex | Capacity Gain | Annual EBITDA Improvement | Simple Payback | Best Use Case |
|---|---|---|---|---|---|
| Controls and debottlenecking only | $250,000 | 8% to 15% | $450,000 | 0.6 years | Hidden process constraints |
| Packaging line optimization | $900,000 | 12% to 20% | $700,000 | 1.3 years | Downstream line imbalance |
| Additional tanks and CIP | $1.6 million | 18% to 28% | $950,000 | 1.7 years | Batching and sanitation limits |
| New beverage line in existing shell | $4.2 million | 30% to 45% | $1.7 million | 2.5 years | Strong contracted demand |
| Line plus major utility upgrades | $6.8 million | 35% to 50% | $2.0 million | 3.4 years | Infrastructure-constrained sites |
| Greenfield or major building addition | $14 million+ | 60%+ | $3.2 million | 4.4 years | Multi-phase strategic growth |
This example shows why payback can vary dramatically based on project type. Many of the strongest returns come from solving constraints before adding full-scale assets.
The comparison chart reflects a common market reality: integrated project delivery tends to produce stronger outcomes because engineering, construction, controls, and startup decisions are aligned earlier.
Seasonal Production Peaks and Expansion Timing Strategy
Timing can make or break an expansion. Beverage demand in the United States is often seasonal, with strong summer peaks for soft drinks, flavored waters, energy beverages, beer, and many RTD formats. Holiday demand can also drive spikes for spirits, mixers, and promotional packs. If a plant schedules installation during peak selling periods, revenue loss and customer service failures can outweigh the long-term benefit of the project.
The best timing strategy starts with customer commitments, promotional calendars, weather-sensitive demand, packaging material lead times, and utility availability. A plant serving southeastern states through Atlanta or Florida lanes may face very different summer risks than one serving the Pacific Northwest from Portland or Seattle. Likewise, a brewery supplying Midwestern stadium and event channels may need winter shutdown windows, while a juice or dairy beverage plant may align around harvest cycles or school-year demand patterns.
Expansion timing should also consider contractor access, equipment lead times, municipal permitting schedules, and startup labor readiness. U.S. utility interconnection or wastewater approval can take longer than the mechanical installation itself.
A strong strategy usually includes phased implementation:
- Pre-buy long lead equipment
- Upgrade utilities before the line arrives
- Perform tie-ins during planned shutdowns
- Commission with lower-risk SKUs first
- Ramp labor and maintenance support before peak season
By 2026, producers are also expected to factor in resilience planning. Heat stress, water restrictions, power instability in some regions, and stricter sustainability reporting can affect the ideal expansion window. Plants that sequence projects around these risks will be better prepared for long-term operating stability.
Case Study: Successful Beverage Factory Expansion Planning
A practical example helps illustrate how expansion feasibility should work. Consider a U.S. beverage manufacturer operating a multi-SKU facility near a major distribution corridor in the South. Sales growth from private label and co-packing customers suggested the need for a multimillion-dollar capacity expansion. Initial thinking focused on adding major new process equipment and increasing packaging speed.
However, the feasibility review showed that the plant’s actual limits were more nuanced. The primary issues included inefficient controls logic, poorly sequenced CIP activity, and utility coordination gaps during product changeovers. Packaging assets were not fully synchronized, and realized throughput lagged theoretical capacity by a meaningful margin.
Rather than immediately installing the largest possible expansion package, the team first corrected the real bottlenecks. Controls and sequencing improvements increased output, stabilized line performance, and improved labor effectiveness. Only after the plant captured those gains did it move into the next phase: targeted equipment and utility upgrades sized to realistic future demand.
This phased approach is consistent with how DPS typically supports manufacturers: engineer the solution, manage execution, and keep profitability at the center of the decision. The company’s project model is built around aligning capital with operational reality, whether the need is a feasibility study, utility upgrade, equipment integration, relocation, or a complete growth plan. Additional project examples and outcomes can be explored through the firm’s case study portfolio.
The core lessons from this case are clear:
- Do not confuse sales pressure with the need for maximum installed capacity.
- Validate the true bottleneck with data before approving capital.
- Size utilities for the expansion path, not just the first equipment purchase.
- Use phased execution to preserve customer service during growth.
- Choose partners who can connect engineering decisions to business performance.
For U.S. beverage producers, this is often the difference between a profitable expansion and a costly underperforming project.
FAQ
What is the first sign that a beverage plant should consider expansion?
The first sign is sustained sold demand that consistently pushes the plant near practical capacity, not just occasional sales spikes. That signal should be confirmed with OEE data, downtime records, and utility usage.
How much reserve utility capacity should a plant have before adding a line?
There is no single number for every site, but many plants aim for meaningful headroom in water, wastewater, compressed air, cooling, steam, and electrical systems. If current loads are already close to peak, utility upgrades should be part of the project.
Can debottlenecking replace a full expansion?
Often, yes. Controls improvements, CIP redesign, line balancing, tank utilization changes, and packaging upgrades can deliver significant gains at lower cost and with faster payback than a complete line addition.
Which U.S. regions are attractive for beverage manufacturing expansion?
That depends on market access, labor, freight, utilities, and permitting. Regions around Dallas-Fort Worth, the Carolinas, Tennessee, the Midwest logistics belt, and parts of the Southeast are frequently attractive, but each project must be evaluated site by site.
How long does a beverage expansion feasibility study usually take?
A focused study may take several weeks, while a more complex review involving utility modeling, multiple product types, building constraints, and capital staging may take longer. The right duration depends on risk and project size.
What product categories most often require advanced hygienic design?
Aseptic beverages, dairy beverages, kombucha, functional products with sensitive ingredients, and certain shelf-stable RTD products usually require more rigorous hygienic design and process control.
Should expansion planning include future sustainability requirements?
Yes. By 2026, water efficiency, energy performance, wastewater reduction, and broader reporting expectations will increasingly shape project approvals and operating costs in the United States.
What kind of project partner is best for beverage expansion?
The strongest partner is one that can evaluate process, utilities, controls, installation, and financial implications together. That integrated view reduces the risk of solving one problem while creating another.
In summary, beverage factory expansion feasibility in the United States depends on rigorous assessment, not enthusiasm alone. The best projects begin with a direct answer to the real operating constraint, then move through layout, utilities, technology, capital modeling, and timing in a disciplined way. Manufacturers that take this approach are far more likely to add profitable capacity, protect service levels, and create a plant platform ready for the next phase of growth.
[/trp_language]
Complete Company Portfolio

About the Author: Disruptive Process Solutions (DPS)
The DPS team combines process engineering expertise with real-world food and beverage manufacturing experience. Our content focuses on process optimization, production efficiency, facility improvements, and practical solutions that help manufacturers operate more effectively in a rapidly evolving industry.
Share

