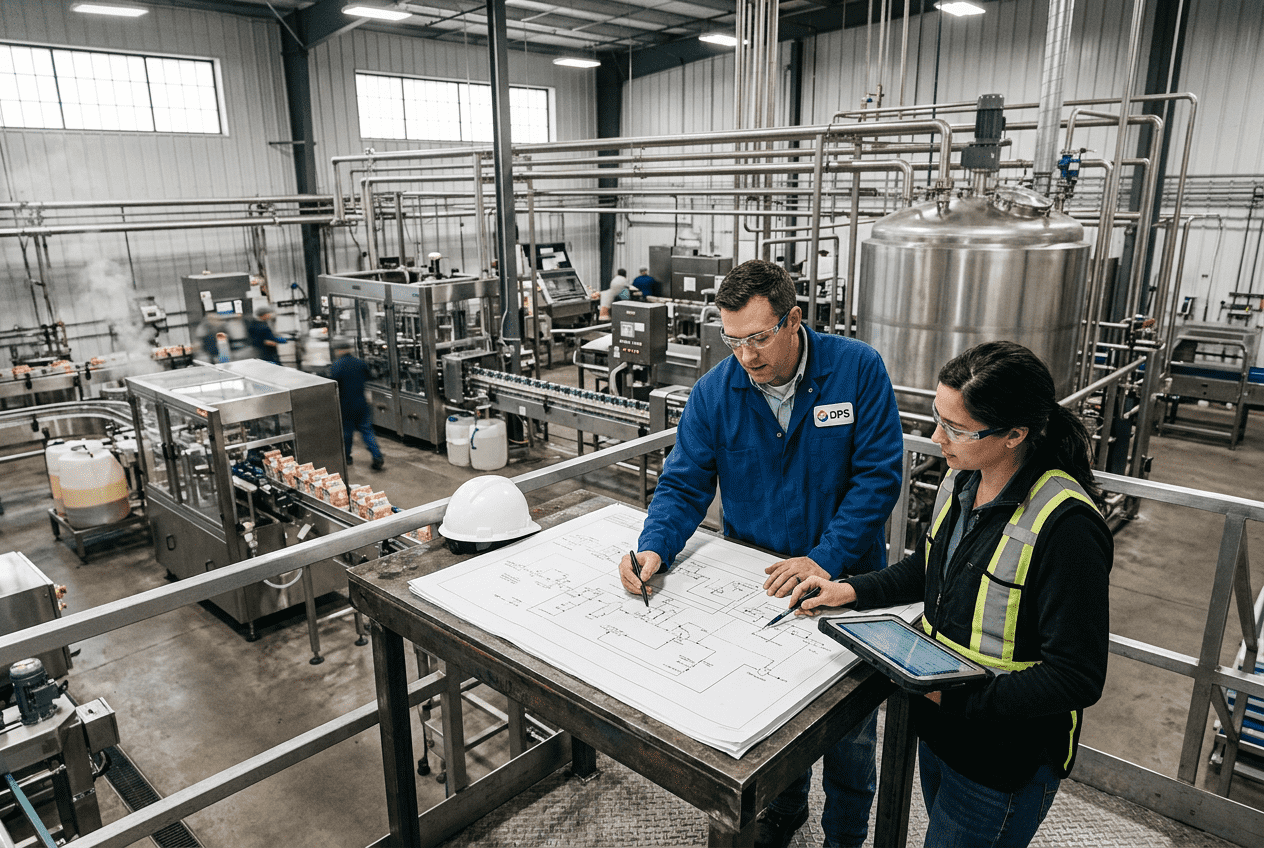
Food Plant Capacity Planning
[trp_language language=”en_US”]
U.S. Food Plant Capacity Planning for Profitable Growth
Food plant capacity planning is the discipline of aligning demand, equipment, labor, utilities, storage, and compliance requirements so a processing facility can meet customer needs at the lowest practical cost and risk. In the United States, that means planning not only for throughput, but also for USDA or FDA oversight, retailer service expectations, labor availability, sanitation windows, energy constraints, and seasonal demand swings across regions such as the Midwest, Southeast, Texas, California, and the Northeast.
For food and beverage manufacturers, strong capacity planning answers a practical question: can the plant make the right product mix, in the right quantities, at the right time, without sacrificing quality, food safety, or margin? Whether the operation produces sauces in Chicago, aseptic beverages near Charlotte, poultry in Arkansas, dairy in Wisconsin, seafood in the Pacific Northwest, or prepared meals in Texas, the planning framework is the same: understand constraints, forecast demand, calculate true line capacity, improve utilization, and invest capital only when operations data supports it.
Fast Take: The Core of Food Plant Capacity Planning

The quick answer is simple. Food plant capacity planning is the process of determining how much product a facility can safely and profitably produce, then matching that capability to market demand. It covers line speed, changeovers, sanitation, uptime, staffing, warehouse space, ingredients, utilities, and future growth.
In the U.S. market, the best plans are built around three realities. First, nominal machine speed is not the same as true plant output. Second, bottlenecks often sit outside the obvious processing step, such as packaging, CIP timing, cold storage, steam generation, PLC logic, or labor coverage. Third, profitable growth usually comes from improving flow and utilization before buying new equipment.
For buyers, operators, and investors, this matters because capacity mistakes are expensive. Underbuilding leads to missed orders, expedited freight, overtime, and retailer penalties. Overbuilding ties up capital in underused assets and oversized utility systems. A disciplined capacity plan protects cash while giving the plant a clear path from current production to future expansion.
Across the U.S., manufacturers increasingly use phased expansion models. A new co-packing plant near Atlanta or Dallas may be designed for a first operating year volume and then engineered with room to scale utilities, tankage, or packaging lines later. That approach is especially valuable in categories such as RTD beverages, protein snacks, fermented products, sauces, dairy, and shelf-stable foods.
| Question | What It Measures | Why It Matters |
|---|---|---|
| What is the actual hourly output by SKU? | True throughput | Separates rated speed from real-world performance |
| Where is the primary bottleneck? | Constraint identification | Directs improvement dollars to the right asset |
| How much time is lost to changeovers? | Available production time | Critical in high-mix operations |
| Can utilities support growth? | Infrastructure readiness | Steam, glycol, compressed air, and water often cap output |
| How seasonal is demand? | Demand variability | Shapes staffing, inventory, and outsourcing plans |
| What utilization rate is sustainable? | Operating strategy | Avoids burnout, quality drift, and maintenance backlog |
The table above shows why capacity planning is broader than equipment sizing. It combines market demand, production engineering, operations management, and capital discipline into one decision framework.
Understanding Capacity Planning in U.S. Food Plants

Food plant capacity planning in the United States sits at the intersection of market volatility and operational complexity. Demand can change quickly because of retailer promotions, private-label wins, foodservice recovery, export activity through ports such as Savannah, Houston, and Long Beach, or weather-driven spikes in categories like beverages, frozen foods, and grilling proteins. At the same time, production is constrained by sanitation rules, shelf-life requirements, cold-chain limits, allergen segregation, packaging availability, and workforce scheduling.
A useful way to think about it is in layers. The first layer is market capacity: the sales forecast by customer, region, and product family. The second is production capacity: what each line, room, or utility system can truly support. The third is business capacity: what the company can fund, staff, maintain, and manage without eroding profit.
Product type matters. Beverage plants often focus on syrup rooms, blending, carbonation, tunnel pasteurization, filler speeds, labelers, and palletizing. Protein processors may be constrained by deboning, marination, smoking, cooking, chilling, slicing, or packaging. Dairy plants must coordinate homogenization, separation, fermentation, filling, and refrigerated storage. Retort and aseptic facilities need balanced sterilization, holding, filling, and package integrity systems. In every case, capacity planning must reflect the specific process path.
From an industry standpoint, the highest pressure categories in recent years have included ready-to-drink beverages, value-added proteins, contract manufacturing, plant-based products, sauces and dressings, and better-for-you convenience foods. These sectors tend to combine growth with SKU complexity, which makes line balancing and scheduling more difficult.
For plant leaders comparing partners, buying advice is straightforward: choose an engineering and integration firm that understands both process and business economics. Capacity projects affect ROI, utility loads, layout, staffing, automation, and expansion sequencing. A good partner should be willing to challenge assumptions, not simply approve oversized capital requests. Manufacturers evaluating strategic support can review the company background of DPS to understand how an engineering-led, profit-focused approach differs from conventional project execution.
Local supplier ecosystems also influence planning. Midwest processors may rely on packaging and ingredient networks around Chicago, Milwaukee, and Minneapolis. Southeast beverage and food producers often leverage freight and labor access around Charlotte, Atlanta, and the Port of Savannah. Texas operators benefit from strong industrial support in Dallas-Fort Worth and Houston. California processors often optimize around Central Valley agriculture, Los Angeles logistics, and the Port of Long Beach. A strong capacity plan accounts for these local supply realities, not just internal equipment limits.
Three Ways to Time Capacity Investments

Most food manufacturers use one of three capacity planning strategies: lead, lag, or match. The right choice depends on growth confidence, customer commitments, available capital, and operational risk tolerance.
A lead strategy adds capacity before demand fully arrives. This is common when a processor expects a major retail launch, a new co-pack contract, or a regional expansion. It reduces the risk of stockouts and creates room for scale, but it requires confidence in demand and access to capital.
A lag strategy adds capacity only after demand has clearly materialized. This protects cash and avoids underused assets, but it can strain service levels, increase overtime, and delay onboarding of new business.
A match strategy adds capacity in planned increments as signals become clearer. For many U.S. food plants, this is the most balanced approach, especially when utility systems, floor space, or controls architecture are designed for phased expansion.
| Strategy | Best Use Case | Main Advantage | Main Risk |
|---|---|---|---|
| Lead | Strong customer pipeline, high confidence demand | Protects service and captures growth fast | Idle capital if volume lags |
| Lag | Uncertain demand or tight cash position | Lower upfront investment | Missed sales and operational strain |
| Match | Moderate growth with phased visibility | Balances service and capital efficiency | Requires disciplined trigger points |
| Hybrid outsource-then-build | New product launch or pilot market entry | Tests market before full investment | Margin dilution and co-packer dependency |
| Automation-first | Plants limited by labor consistency | Improves repeatability and throughput | Integration complexity |
| Utilities-first | Sites expecting multiple future lines | Prepares for scalable growth | Oversizing if expansion stalls |
The most successful U.S. projects often blend these strategies. For example, a beverage site near Raleigh may install utilities, tank pads, and controls infrastructure for future fillers, while only purchasing one filling line in phase one. A protein plant outside Kansas City may add chilling and packaging in stages while using schedule optimization first. A California sauce facility may reserve floor space, drainage, and CIP routing for later kettles rather than overbuilding from day one.
That is also where experience matters. DPS is known for approaching projects as a business-minded operations partner rather than a volume-driven contractor. In practice, that means helping clients determine whether the best next move is new equipment, line reprogramming, relocation, utility upgrades, or layout redesign. Manufacturers exploring this kind of support can review engineering and project services to see how feasibility, design, installation, and execution align around profitability.
This line chart illustrates how U.S. food manufacturers are steadily increasing investment in data-driven planning, automation, and capacity visibility. The 2026 outlook is especially strong as labor constraints, retailer service expectations, and sustainability reporting push plants to improve planning sophistication.
Calculating Output Capacity on Food Processing Lines
Capacity calculation starts with a baseline formula, but it must be adjusted for real operating conditions.
The basic formula: Effective capacity = Rated speed × Available time × Performance factor × Quality factor.
For example, if a line is rated at 10,000 units per hour, runs 16 scheduled hours per day, loses 2 hours to sanitation and changeovers, performs at 88% of rated speed, and delivers 98% good product, daily effective capacity is:
10,000 × 14 × 0.88 × 0.98 = 120,736 saleable units per day.
That is the number management should use for planning, not the brochure speed. In food processing, the gap between theoretical and effective capacity can be large because of clean-in-place cycles, allergen washdowns, cook or cool dwell time, packaging material swaps, code date changes, and product viscosity differences.
| Step | What to Measure | Typical U.S. Plant Considerations |
|---|---|---|
| 1 | Rated machine speed | Vendor specification at ideal conditions |
| 2 | Scheduled production hours | By shift pattern and day of week |
| 3 | Planned downtime | Sanitation, setup, changeover, breaks |
| 4 | Unplanned downtime | Mechanical stops, jams, waiting on materials |
| 5 | Performance loss | Reduced speed from product or packaging mix |
| 6 | Quality yield | Scrap, rework, startup losses, hold product |
The explanation behind this table is critical: each step removes another layer of assumption. Plants that skip steps three through six almost always overestimate output.
Another best practice is to calculate capacity at four levels: equipment, line, department, and site. A cooker may support 8,000 pounds per hour, but if packaging only clears 6,500 pounds, packaging is the real capacity. Likewise, a filling line may handle more volume, but warehouse cooler space or blast chilling may limit daily release.
Applications vary by process:
- For beverage: assess batching, pasteurization, filling, labeling, and palletizing in sequence.
- For protein: assess raw receiving, trimming, marination, thermal processing, chilling, slicing, and packaging.
- For dairy: assess milk intake, separation, homogenization, fermentation, filling, and cold storage.
- For shelf-stable foods: assess cook, fill, retort, cool-down, incubation, and case packing.
- For plant-based products: assess hydration, high-shear mixing, texturization, forming, cooking, and packaging.
Case work often reveals that the cheapest capacity increase is hidden in controls or sequencing. One example from the industry involved a manufacturer planning a multi-million-dollar expansion for only a modest output gain, only to discover that programming logic and operational sequencing, not major equipment shortage, were constraining throughput. After reworking controls and line logic, capacity improved without the original capital burden. That type of diagnostic discipline is one reason manufacturers seek integration partners that combine process engineering with automation and project execution.
Managing Seasonal Swings in Peak and Slow Periods
Seasonality is a defining issue in U.S. food manufacturing. Beverage demand often climbs before summer. Baking ingredients rise ahead of holidays. Sauces and proteins can surge before grilling season. Dairy and school-related products may shift with academic calendars. Co-packers frequently experience promotions tied to retailer resets or regional launches.
Capacity planning for peak and off-peak periods requires more than a bigger forecast. It requires scenario-based decisions on inventory, labor, packaging procurement, utility loads, and sometimes outsourcing. Plants near major freight corridors such as I-35 in Texas, I-95 in the Southeast, and the Inland Empire in California must also account for transportation constraints during peak shipping periods.
| Planning Area | Peak Season Action | Off-Peak Action |
|---|---|---|
| Forecasting | Weekly review with sales and customers | Refresh base demand and assumptions |
| Inventory | Prebuild stable SKUs where possible | Reduce aged stock and clean item master |
| Labor | Add overtime, temps, or extra shifts | Cross-train and schedule vacations |
| Maintenance | Protect critical uptime windows | Complete major PMs and rebuilds |
| Suppliers | Lock ingredients and packaging early | Negotiate lead times and service levels |
| Warehousing | Secure overflow cold or dry space | Re-slot and optimize storage flows |
The table shows that slow periods are not idle periods. They are the right time for preventive maintenance, line trials, training, facility work, and system upgrades. Plants that treat off-peak time as strategic preparation usually outperform during the next demand spike.
In buying terms, this is also when flexible equipment and modular layouts pay off. Portable tanks, scalable CIP skids, spare filler heads, dual-use utilities, and configurable automation can help plants serve both peak volume and high-mix, lower-volume periods. Manufacturers evaluating processing hardware can explore process equipment options with an eye toward flexibility rather than just maximum nameplate speed.
The area chart highlights a realistic seasonal pattern for many mixed-category U.S. plants: a rise into summer, stabilization in late summer, and renewed demand in holiday-related periods. The exact shape varies by category, but the planning logic remains the same.
Typical Capacity Utilization Targets in Food Manufacturing
Utilization benchmarks must be interpreted carefully. Running at 95% utilization may sound efficient, but it often leaves too little room for maintenance, schedule changes, trial runs, or customer volatility. In food manufacturing, a healthier target usually depends on process type, SKU complexity, and perishability.
| Segment | Typical Sustainable Utilization | Notes |
|---|---|---|
| Beverage filling | 70% to 85% | Depends on SKU count, package sizes, and sanitation time |
| Protein processing | 75% to 88% | Labor and chill capacity often matter as much as core equipment |
| Dairy | 72% to 86% | Cold storage and product shelf life shape planning |
| Sauces and dressings | 68% to 82% | Changeovers and viscosity differences affect actual rates |
| Retort and shelf-stable foods | 70% to 84% | Thermal cycle times create fixed constraints |
| Contract manufacturing | 65% to 80% | Need extra room for customer mix and launch volatility |
These benchmarks are useful because they reflect sustainable operations, not theoretical maximums. Plants with complex sanitation or frequent pack format changes may intentionally target the lower end. Highly standardized facilities with stable demand and strong maintenance practices may operate at the upper end. The right target is the one that supports service, quality, and profitability together.
Benchmarking should also include utilities. A line operating at 80% may still be overloading steam boilers, refrigeration, compressed air, or wastewater handling. This is especially common in older facilities in legacy industrial zones where the process line has been upgraded multiple times but site infrastructure has not kept pace.
This bar chart compares likely capacity expansion pressure across major food and beverage categories. RTD beverages, protein, and prepared foods remain particularly active because they combine growth, promotional variability, and ongoing need for operational flexibility.
Improving OEE and Line Performance Without Adding Equipment
OEE, or overall equipment effectiveness, is one of the best tools for unlocking capacity before spending capital. It combines availability, performance, and quality into a single operating metric. In food plants, OEE improvements often come from better changeovers, fewer micro-stops, tighter startup procedures, stronger preventive maintenance, smarter controls, and more disciplined production scheduling.
Many facilities assume they need more equipment when they actually need better synchronization. A filler may wait on depalletizing. A cooker may wait on packaging. A retort may sit idle because of operator handoff timing. A marination system may be constrained by downstream chilling or case packing. When OEE is reviewed line by line and shift by shift, these hidden losses become visible.
Common no-new-equipment gains include:
- Reducing changeover time with standardized parts staging
- Improving CIP sequence logic to cut nonproductive windows
- Rebalancing staffing at the real bottleneck instead of evenly across the line
- Optimizing recipe order to reduce allergen or flavor washdowns
- Using better downtime coding to identify chronic micro-losses
- Reprogramming PLC logic to remove avoidable wait states
This is where technological capability becomes essential. DPS supports projects that blend process engineering with controls, PLC programming, automation, and SCADA integration. Those capabilities matter because capacity is often limited by how systems communicate, not just by how fast individual assets can run. The company also works across utilities such as CIP, steam, compressed air, refrigeration, water treatment, and energy systems, which are frequently the hidden ceiling on throughput.
Manufacturing capability matters as well. In both food and beverage environments, projects may include tanks, custom CIP systems, marination tumblers, cooking vessels, blending and batching systems, fermentation vessels, pasteurization systems, retort integration, and utility infrastructure. Capacity planning becomes far more accurate when the engineering team understands how those assets operate together in the field, not only on paper.
For proof-oriented buyers, the most useful question is not “What is the equipment speed?” but “What output improvement can be achieved through debottlenecking before new equipment is purchased?” Real project examples often show meaningful gains through logic, flow, and layout changes.
Workforce Capacity Planning for Skills, Shifts, and Flexibility
Labor is a core part of plant capacity. Two facilities with the same equipment can produce very different output depending on operator skill, maintenance coverage, sanitation execution, and supervisory consistency. Workforce capacity planning should therefore include headcount, skill depth, cross-training, absenteeism risk, onboarding speed, and schedule flexibility.
| Workforce Factor | Risk if Weak | Planning Response |
|---|---|---|
| Operator cross-training | Bottlenecks during absences or vacations | Create multi-skill certification paths |
| Maintenance shift coverage | Longer downtime recovery | Align technicians with peak run windows |
| Sanitation staffing | Delayed startup and quality risk | Use validated standard work and audits |
| Supervisor span of control | Inconsistent execution across lines | Balance oversight by complexity and shift |
| Temporary labor dependence | Higher training burden and variable speed | Reserve temps for noncritical tasks when possible |
| Overtime reliance | Fatigue, turnover, and quality drift | Use overtime as a bridge, not the base plan |
The table explains why labor planning should be treated as a capacity lever, not just an HR issue. A packaging line with enough machinery but inconsistent staffing does not have secure capacity.
For many U.S. plants, the winning approach is a mix of stable core labor and flexible surge options. That may include staggered start times, weekend crews, relief operators, or cross-trained mechanics who can support both process and packaging assets. Plants in competitive labor markets such as Southern California, Dallas-Fort Worth, or central Florida must be even more deliberate about retention and training because replacement cycles directly affect line performance.
Service capability also matters here. DPS supports clients with capital planning, feasibility studies, owner’s representation, project management, general contracting where licensed, turnkey installation, and system integration. That broader service model helps workforce planning because line changes, utility modifications, controls updates, and schedule impacts can be managed as one coordinated project rather than fragmented work packages.
Manufacturers interested in how integrated execution translates to plant results can explore project examples and case work showing how planning, engineering, and implementation connect in practice.
Digital Tools for MES, ERP, and Advanced Planning
Technology is now central to capacity planning. ERP systems provide demand, inventory, purchasing, and order visibility. MES platforms capture production data, downtime, yield, and genealogy. Advanced planning systems help model finite capacity, constraints, and scenario scheduling. Together, they give plants a more truthful picture of what can be made and when.
The most important point is integration. If ERP says demand is rising, but MES shows persistent downtime and the maintenance system shows overdue work orders, leadership gets a much more realistic picture of expansion readiness. By 2026, more U.S. food manufacturers are expected to connect these layers with stronger analytics, energy monitoring, and sustainability reporting.
Future trends shaping 2026 capacity planning include:
- More AI-assisted forecasting for SKU-level demand and promotion effects
- Greater use of digital twins to test line changes before construction
- Energy-aware scheduling as electricity and steam costs become a larger planning input
- More traceability and compliance integration for FDA, USDA, SQF, and BRC requirements
- Sustainability-driven water reuse, heat recovery, and utility optimization projects
- Higher interest in modular expansion designs to reduce project risk
| System Type | Main Function | Capacity Planning Benefit |
|---|---|---|
| ERP | Orders, inventory, purchasing, finance | Improves forecast translation into supply needs |
| MES | Production tracking and downtime capture | Provides real effective capacity data |
| SCADA | Real-time process visualization | Reveals utility and process constraints |
| APS | Finite scheduling and scenario planning | Balances lines, labor, and due dates |
| CMMS | Maintenance planning | Protects uptime and planned downtime windows |
| Energy management | Utility consumption and optimization | Supports sustainable and cost-aware capacity use |
The comparison chart illustrates a common buying reality: integrated partners usually create more value in planning-heavy capacity projects than fragmented supplier networks, especially when utilities, controls, process equipment, and construction must all work together on a live food site.
For companies selecting a partner, local presence still matters even when service is national. A project team that can support work in North Carolina, Texas, California, the Midwest, and Canada while coordinating local trades and compliance requirements has an advantage in speed and accountability. That is particularly important for multi-site manufacturers standardizing capacity planning across networks.
Frequently Asked Questions
What is the first step in food plant capacity planning?
Start with demand by SKU and customer, then compare it to actual line output data, not rated equipment speed. This quickly reveals whether the problem is demand, equipment, labor, scheduling, utilities, or storage.
How often should a U.S. food plant update its capacity plan?
At minimum, quarterly. High-growth or high-mix plants may need monthly updates, especially before summer beverage season, holiday demand, major retailer resets, or co-pack contract renewals.
What is a good utilization target?
Many food plants operate best between 70% and 85% sustainable utilization, depending on process complexity. The goal is to leave enough room for maintenance, changeovers, and demand swings while still generating strong asset productivity.
Should we buy new equipment or improve OEE first?
Usually improve OEE first. Many plants can unlock meaningful throughput through controls optimization, changeover reduction, maintenance discipline, and better scheduling before making major capital purchases.
How do seasonal products affect capacity planning?
They require prebuild decisions, supplier coordination, temporary labor plans, and warehouse strategies. Off-peak periods should be used for maintenance, training, and line improvement work.
Why do utility systems matter so much?
Because boilers, refrigeration, chilled water, compressed air, wastewater, and CIP systems often become the real bottleneck. A faster line adds little value if the supporting infrastructure cannot keep up.
What industries benefit most from formal capacity planning?
Nearly all, but especially RTD beverage, protein, dairy, sauces, prepared foods, co-packing, aseptic, and retort operations where demand volatility and process complexity are high.
How do we choose a capacity planning partner?
Look for a team that understands process engineering, automation, utilities, construction, compliance, and financial return. A partner should be able to challenge assumptions, quantify bottlenecks, and phase investments intelligently.
What should be included in a 2026-ready capacity plan?
Demand scenarios, actual line data, labor flexibility, utility loading, energy use, sustainability goals, food safety compliance, digital system integration, and a phased capital roadmap.
Where does DPS fit in this process?
DPS supports food and beverage manufacturers across North America with engineering, capital planning, owner’s representation, proprietary equipment, installation, controls integration, and project execution. The focus is on profitable, well-sequenced projects rather than overspending on the wrong fix.
In summary, food plant capacity planning is not just about making more product. It is about making the right investments at the right time, using reliable data, and aligning plant capability with market opportunity. For U.S. manufacturers facing growth, labor pressure, compliance demands, and rising utility costs, that discipline is becoming a competitive necessity.
[/trp_language]
Complete Company Portfolio

About the Author: Disruptive Process Solutions (DPS)
The DPS team combines process engineering expertise with real-world food and beverage manufacturing experience. Our content focuses on process optimization, production efficiency, facility improvements, and practical solutions that help manufacturers operate more effectively in a rapidly evolving industry.
Share

