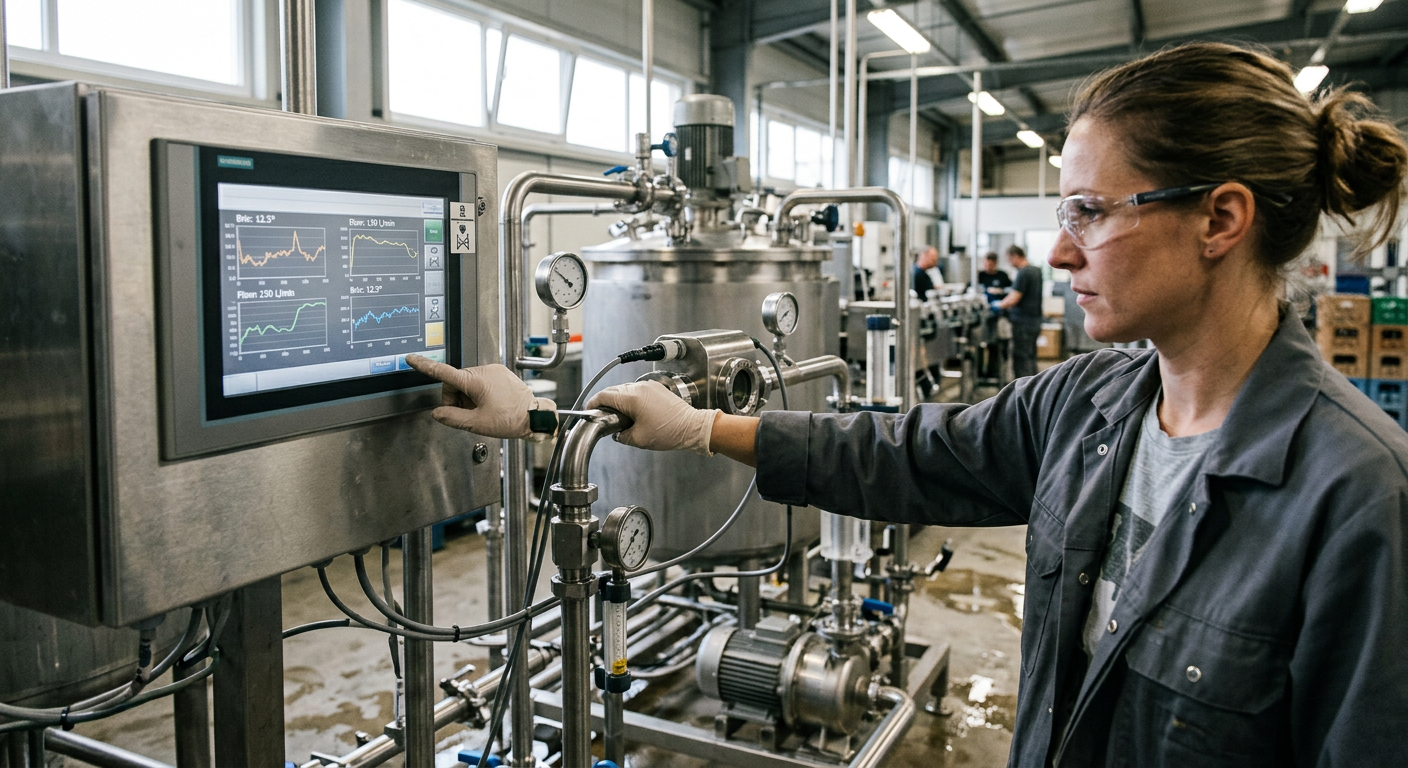
Food Manufacturing Total Cost of Ownership: 6 Hidden Costs Every Buyer Misses
[trp_language language=”en_US”]
Total Ownership Costs in U.S. Food Manufacturing
Buying food processing equipment on price alone is one of the most expensive mistakes a manufacturer can make. In the United States, the real financial impact of a new mixer, retort, pasteurizer, CIP skid, packaging line, utility upgrade, or full processing system is measured by total cost of ownership, not the initial quote. A machine that looks cheaper on day one may cost far more over ten to fifteen years once energy use, sanitation labor, spare parts, downtime, validation, training, and eventual disposal are added.
For processors operating in major food hubs such as Chicago, Fresno, Los Angeles, Dallas-Fort Worth, Atlanta, the Research Triangle, the Midwest protein corridor, or port-driven import and export regions like Houston, Savannah, Long Beach, and Newark, TCO matters because margins are shaped by throughput, utility rates, labor availability, and regulatory pressure. Whether you produce dairy beverages, sauces, proteins, prepared foods, fermented products, shelf-stable meals, or aseptic products, a better capital decision starts with a better ownership-cost model.
Quick Answer

Total cost of ownership in food manufacturing is the full lifetime cost of equipment or a process system, including purchase price, installation, utilities, preventive maintenance, spare parts, sanitation impacts, downtime, compliance work, operator training, upgrades, and end-of-life removal. In the United States, buyers often underestimate TCO by focusing only on capital expenditure and ignoring the hidden operating costs that determine real ROI. The most reliable buying decision is the one that compares vendors and system designs over the complete life of the asset, usually 7 to 20 years depending on the application.
In practical terms, if Equipment A costs $900,000 and Equipment B costs $1,050,000, Equipment B may still be the better investment if it reduces energy use, shortens CIP cycles, cuts downtime, and simplifies compliance documentation. That is especially true in sectors with strict FDA, USDA, SQF, or BRC requirements and in facilities where each lost production hour can mean thousands of dollars in missed output.
| Decision Factor | Low-Price View | TCO View | Why It Matters | Typical U.S. Impact | Buyer Question |
|---|---|---|---|---|---|
| Purchase price | Main focus | Starting point only | Low sticker price can hide high lifetime cost | Capital budgets often distort comparisons | What is the full 10-year cost? |
| Energy use | Often ignored | Modeled annually | Utilities compound every year | High in steam, refrigeration, and compressed air systems | What is usage per production unit? |
| Maintenance | Reactive estimate | Planned lifecycle cost | Parts and labor affect uptime | Important in remote or multi-shift plants | What are annual PM and parts costs? |
| Downtime | Undervalued | Quantified by throughput loss | Lost sales often exceed repair costs | Critical in co-packing and seasonal demand | How many hours of downtime are expected? |
| Compliance | Seen as overhead | Included in ownership model | Validation and documentation cost money | Important for FDA, USDA, SQF, BRC audits | What paperwork and testing are required? |
| End-of-life | Deferred | Budgeted | Removal and disposal are real cash events | Important in brownfield plants | What will replacement or removal cost? |
The table above shows why purchase price alone is too narrow. In food plants, the machine is only one part of the financial equation. The ownership model must include how the equipment behaves inside your specific process, labor model, sanitation routine, plant utilities, and compliance environment.
What Is Total Cost of Ownership in Food Manufacturing

Total cost of ownership, often shortened to TCO, is a lifecycle accounting framework used to evaluate the true cost of a food manufacturing asset from planning through decommissioning. It goes beyond capex and captures opex, risk, and operational performance. In food and beverage, this framework is more demanding than in many other industries because hygienic design, utility consumption, product changeovers, validation requirements, and uptime reliability materially affect profitability.
A complete TCO model for a U.S. plant usually includes the following categories: equipment purchase; freight; customs or port handling if imported through gateways like Long Beach or Savannah; installation; electrical, plumbing, structural, refrigeration, and controls integration; startup and commissioning; operator training; cleaning and sanitation burden; annual utility cost; preventive and corrective maintenance; replacement parts; software support; calibration and validation; downtime risk; performance degradation; retrofit needs; and end-of-life removal.
Different product categories experience TCO differently. A dairy processor in Wisconsin may focus on CIP time, thermal efficiency, and aseptic validation. A protein processor in Arkansas or Nebraska may place heavier weight on washdown durability, corrosion resistance, and high-throughput uptime. A beverage plant in California or Texas may prioritize water recovery, CO2 efficiency, syrup-room automation, and utility scalability. A co-packer near major interstates or ports may care most about flexibility, quick changeover, and first-pass yield.
| Asset Type | Typical Life | Key TCO Driver | Hidden Risk | Best KPI | Common Buyer Mistake |
|---|---|---|---|---|---|
| CIP system | 10-15 years | Water, chemicals, cycle time | Under-sized recovery design | Cost per clean cycle | Buying for tank count only |
| Pasteurizer/UHT | 12-20 years | Thermal efficiency | Fouling and downtime | Energy per gallon | Ignoring product variability |
| Retort system | 15-20 years | Validation and throughput | Process deviation cost | Saleable output per shift | Focusing on vessel price |
| Mixing/blending line | 10-15 years | Yield and batch time | Inconsistent Brix or viscosity | Batch completion time | Ignoring automation level |
| Refrigeration utility | 15-25 years | Energy load | Poor control integration | kWh per ton of cooling | Not modeling seasonal swings |
| Packaging line | 8-15 years | Downtime and changeover | Operator dependency | OEE | Using ideal speed instead of actual speed |
The point of the table is that each asset class has a different TCO signature. A strong buying decision recognizes which cost drivers dominate for that specific process and then compares options accordingly.
The chart above reflects a realistic market trend: more U.S. processors are shifting from quote-based buying toward lifecycle decision-making as utility prices, labor shortages, and compliance complexity increase. By 2026, this trend is expected to accelerate further as sustainability reporting and digital performance monitoring become more standard in capital planning.
Hidden Cost 1 – Energy Consumption Over Equipment Life

Energy is one of the most underestimated ownership costs in food plants. The problem is not only electricity. It includes steam, natural gas, compressed air, chilled water, glycol, hot water generation, refrigeration load, and even ventilation impacts. Over a ten-year period, a utility-intensive asset can consume a meaningful multiple of its purchase price.
In the United States, energy cost exposure varies by region. California plants often face higher electricity rates and strict water-energy scrutiny. Gulf Coast processors may manage lower energy costs but face climate-related cooling loads. Midwest facilities may emphasize steam efficiency in cold seasons and refrigeration efficiency in protein and dairy operations. Plants in the Southeast often evaluate utility expansion costs for growth corridors around Raleigh, Charlotte, Atlanta, and Nashville.
Buyers should request measured or modeled consumption under real production conditions, not just nameplate motor load. Ask vendors for energy per gallon, per pound, per batch, or per CIP cycle. Include startup/shutdown losses, idle consumption, and sanitation cycles. For thermal systems, inspect heat recovery options. For pumps and motors, ask about VFDs. For compressed air devices, calculate leakage sensitivity and pressure requirements. For refrigeration, study control logic and seasonal load profiles.
| Equipment/System | Common Utility Driver | What Buyers Miss | 10-Year TCO Effect | Best Improvement Lever | Evaluation Metric |
|---|---|---|---|---|---|
| HTST pasteurizer | Steam and cooling | Heat recovery efficiency | Very high | Regeneration optimization | BTU per gallon |
| CIP skid | Water, chemicals, heating | Cycle duration | High | Recovery tanks and automation | Cost per clean |
| Air compressor | Electricity | Leak-driven waste | High | Pressure optimization | kWh per cfm |
| Refrigeration system | Electricity | Control strategy | Very high | Load staging and insulation | kWh per ton cooling |
| Retort | Steam and water | Vent and cooling losses | Moderate to high | Batch sequencing | Utility cost per cycle |
| Mixing vessel | Electricity and heating | Agitator oversizing | Moderate | Process-specific design | Energy per batch |
This table shows that utility cost must be tied to process behavior. Two systems with similar throughput may create very different utility bills depending on controls, heat recovery, and operating discipline.
Hidden Cost 2 – Maintenance and Spare Parts
Maintenance cost is often underestimated because the quote rarely reflects annual wear parts, technician callouts, calibration intervals, software licensing, or lead times for critical components. In food manufacturing, hygienic environments also accelerate wear on seals, gaskets, sensors, valves, and bearings due to caustic cleaning, thermal cycling, and high-moisture washdown conditions.
Imported equipment can create spare-parts risk if components must ship through Long Beach, Newark, or Houston and then clear inland logistics before reaching a plant in Iowa, Georgia, or North Carolina. Even high-quality systems can become expensive if critical parts are hard to source domestically. A lower-cost machine with proprietary parts may lock the buyer into expensive support terms.
Good TCO practice includes a maintenance map before purchase: preventive maintenance hours, recommended spare-parts inventory, expected annual parts replacement, local technician access, response time, and controls support availability. A machine with common U.S.-available motors, valves, PLC hardware, and instrumentation often produces lower lifecycle risk than a cheaper machine with uncommon components.
Buyers should also evaluate design-for-maintenance. Can seals be replaced without major disassembly? Is access safe and fast? Are change parts standardized? Is troubleshooting aided by SCADA or alarming? Is there remote support? These details directly influence labor cost and uptime.
Hidden Cost 3 – Downtime and Production Loss
Downtime is frequently the largest hidden cost in the entire ownership model. Many buyers assume maintenance cost is the main penalty of unreliable equipment, but the bigger issue is lost production, missed shipments, overtime recovery, product waste, and customer-service damage. In co-packing, private label, and seasonal categories, one failed shift can have consequences far beyond repair labor.
For example, if a beverage line in the Dallas-Fort Worth region loses six hours during a peak week, the cost may include labor standing idle, syrup loss, utility waste, missed truck appointments, and delayed retailer replenishment. In protein processing near Omaha or poultry operations in Georgia, downtime may back up upstream product flow and cause discard risk. In aseptic or retort applications, a process upset can trigger hold-and-release burdens or full product loss.
Downtime should be modeled in three ways: frequency, duration, and business impact. A short stop every day can cost more annually than one long stop every quarter. TCO models should calculate lost gross margin per hour, not only lost units. Include sanitation reset time, restart scrap, maintenance labor, and logistics penalties.
The bar chart illustrates a realistic pattern in the U.S. market: aseptic, protein, and beverage operations usually show the highest TCO sensitivity to downtime because of validation, perishability, throughput demands, and customer-service pressure. For these industries, reliability engineering is not optional; it is financial strategy.
| Downtime Element | Direct Cost | Indirect Cost | Often Missed By Buyers | How to Quantify | Mitigation Tactic |
|---|---|---|---|---|---|
| Unplanned stoppage | Repair labor | Missed production | Lost margin per hour | Hourly throughput value | Redundancy and PM |
| Slow restart | Operator time | Schedule disruption | Startup scrap | Scrap plus labor | Automated recovery logic |
| Product hold | QA testing | Customer delays | Inventory freeze cost | Days on hold x value | Validation discipline |
| Changeover error | Extra labor | Reduced OEE | Recurring micro-losses | Minutes lost per shift | SMED design |
| Utility failure | Emergency service | Multi-line impact | Shared-system vulnerability | Plantwide loss per hour | Critical utility resilience |
| Part delay | Freight premium | Extended outage | Lead-time exposure | Outage hours x margin | Stock critical spares |
This table demonstrates that downtime cost is broader than mechanical failure. It includes process recovery, quality consequences, and network effects across the plant.
Hidden Cost 4 – Regulatory Compliance and Validation
Food manufacturers in the United States operate in one of the most compliance-intensive capital environments. Depending on the product and plant, equipment decisions may trigger FDA expectations, USDA inspection requirements, Preventive Controls obligations, sanitary design reviews, documentation packages, calibration protocols, thermal process validation, FAT and SAT records, allergen controls, and third-party audit alignment for SQF or BRC.
These costs are often excluded from the original equipment quote. Yet compliance work can materially affect project budget, schedule, and startup timing. A cheaper system may become much more expensive if it lacks proper material traceability, weld documentation, hygienic detailing, instrument calibration support, or recipe and batch record functionality. This is especially important in aseptic, dairy, ready-to-drink beverage, retort, and high-risk RTE applications.
Validation cost should be included as both an upfront and ongoing ownership item. Upfront costs include documentation, commissioning protocols, testing support, and quality review. Ongoing costs include revalidation after modifications, calibration maintenance, audit preparation, and digital record retention. Plants shipping nationally from states like Texas, North Carolina, California, Pennsylvania, or Illinois benefit when systems are designed from the beginning to support audit readiness.
When evaluating vendors, ask whether the design supports sanitary access, drainability, cleanability, and documentation depth. Also ask who owns the commissioning package, sequence testing, and startup record completion. These are not administrative details; they are cost drivers.
Hidden Cost 5 – Training and Change Management
Even the best system underperforms if operators, maintenance teams, sanitation crews, supervisors, and QA staff are not prepared to use it correctly. Training is a hidden cost because it affects labor efficiency, startup speed, error rates, sanitation consistency, and production stability. Change management matters even more in plants transitioning from manual or semi-automatic processes to integrated automation.
In labor-constrained U.S. regions, including high-growth manufacturing corridors in the Southeast and Southwest, turnover risk makes training quality even more important. A system that depends on one expert operator may look efficient during acceptance testing but become unstable months later when staffing changes. TCO should include initial training, refresher training, SOP development, multilingual support if needed, maintenance onboarding, and supervisory reporting tools.
Buyers should estimate the financial effect of the learning curve: slower line speed, higher scrap, longer CIP cycles, or more maintenance calls during the first six months. Systems with intuitive HMIs, well-structured alarming, clear recipes, and consistent controls architecture usually lower training cost over time. This is one reason integrated project planning matters more than buying isolated pieces of equipment.
The area chart reflects a practical industry shift: by 2026, more U.S. food and beverage manufacturers are expected to prioritize systems that reduce dependence on tribal knowledge through automation, recipe control, SCADA visibility, and structured training support.
Hidden Cost 6 – Decommissioning and Disposal
End-of-life cost is rarely discussed during procurement, but it should be part of the initial business case. Decommissioning includes disconnecting utilities, demolition, rigging, line clearance, floor and drain repairs, environmental handling, disposal fees, scrap recovery, and production disruption during removal. In older facilities, especially brownfield sites in legacy manufacturing areas around the Midwest and Northeast, decommissioning can be surprisingly expensive.
Some assets also carry hidden replacement-interface costs. When an old tank, cooker, filler, or utility skid is removed, pipe elevations, controls architecture, structural supports, and room layouts may need modification. If these requirements are not scoped early, the buyer may underestimate the true project cost and schedule risk.
A better approach is to model net end-of-life cost: removal cost minus salvage value plus site restoration plus replacement integration. This matters for both owned assets and leased spaces, where landlord conditions may affect demolition scope. Sustainable disposal practices are also gaining importance, particularly in corporate ESG reporting and local waste-reduction initiatives.
TCO Calculation Framework and Decision Model
A practical TCO model should be simple enough to use but detailed enough to drive decisions. In most U.S. food manufacturing projects, the best framework has three layers: acquisition cost, operating cost, and risk-adjusted cost. Acquisition covers equipment, freight, installation, utilities, controls, startup, and documentation. Operating covers energy, labor, maintenance, sanitation, quality, and consumables. Risk-adjusted cost covers downtime, compliance exposure, obsolescence, and end-of-life.
A basic formula looks like this:
TCO = Initial Capital + Installation + Annual Operating Cost over Asset Life + Downtime Cost + Compliance Cost + Training Cost + End-of-Life Cost – Residual Value
Many buyers also apply discounted cash flow or net present value to compare options with different timing of costs. That matters when a higher-priced system creates lower annual utility use and less downtime.
| TCO Category | Include in Model | Example Data Source | Frequency | Common Error | Recommended Owner |
|---|---|---|---|---|---|
| Capital purchase | Equipment, freight, taxes | Vendor quote | One time | Ignoring accessories | Procurement |
| Project integration | Install, utilities, controls | Project estimate | One time | Underestimating site work | Engineering |
| Operating cost | Energy, labor, sanitation | Plant benchmarks | Annual | Using ideal instead of actual load | Operations |
| Maintenance | PM, parts, service | OEM data and history | Annual | No spare-parts strategy | Maintenance |
| Risk cost | Downtime, quality events | OEE and margin data | Annual | Ignoring business impact | Plant leadership |
| End-of-life | Removal, disposal, salvage | Contractor budget | One time | Leaving out restoration | Capital team |
The table above shows that TCO is cross-functional. Procurement, engineering, operations, maintenance, QA, and finance all need to contribute. If one department builds the model alone, major costs are usually missed.
Below is a simplified decision example for two hypothetical systems:
| Cost Item | System A | System B | 5-Year Difference | Which Is Better | Reason |
|---|---|---|---|---|---|
| Purchase and install | $1,000,000 | $1,140,000 | -$140,000 for A | A upfront | Lower initial capex |
| Energy | $420,000 | $280,000 | $140,000 for B | B | Higher efficiency |
| Maintenance and parts | $190,000 | $135,000 | $55,000 for B | B | Standardized components |
| Downtime loss | $500,000 | $180,000 | $320,000 for B | B | Higher reliability |
| Compliance and training | $95,000 | $60,000 | $35,000 for B | B | Better documentation and HMI |
| Total 5-year TCO | $2,205,000 | $1,795,000 | $410,000 for B | B overall | Lower lifetime cost |
This kind of table makes buying decisions easier for executive teams because it converts technical features into financial outcomes. It also creates a stronger basis for vendor negotiation and capital approval.
The comparison chart highlights a common result in U.S. projects: integrated suppliers or engineering-led partners often outperform low-price vendors on lifecycle value, particularly where uptime, compliance, and integration quality drive profitability.
As 2026 approaches, several trends will shape TCO decisions. First, digital monitoring will make actual lifecycle performance easier to track through SCADA, historian data, predictive maintenance, and energy dashboards. Second, policy and customer pressure around water, energy, refrigerants, and waste reduction will make sustainability a direct cost issue rather than a branding issue. Third, labor constraints will increase the value of automation, recipe control, remote support, and simplified operator interfaces. Fourth, flexible manufacturing will matter more as brands push shorter runs, more SKUs, and faster changeovers. Buyers who build these trends into present-day TCO models will make better investments.
When comparing local suppliers and project partners, do not only ask who can ship equipment fastest or quote cheapest. Ask who understands your product, your sanitation reality, your utility backbone, your audit environment, and your expansion path. In U.S. food manufacturing regions from California’s Central Valley to the Carolinas, from Texas beverage corridors to Midwestern protein plants, the best financial outcome usually comes from aligning process design with business strategy.
If you are evaluating capital projects, it also helps to review a partner’s approach to project planning and execution. You can learn more about a firm’s background on its company overview page, explore broader engineering and project services, review selected process equipment capabilities, or look at relevant project case examples to understand how lifecycle value is created in real facilities.
Our Company
Disruptive Process Solutions works with food and beverage manufacturers across the United States and Canada as an engineering-led capital project partner focused on profitable outcomes, not just installed assets. The company is based in Cary, North Carolina, with a West Coast presence in Lake Forest, California, and supports projects ranging from targeted line improvements to complete process-system integration.
From a technological capabilities standpoint, DPS supports structural, mechanical, plumbing, electrical, process, and controls engineering, including PLC programming, automation architecture, SCADA visibility, batch logic, and energy-management considerations. That technical depth matters in TCO-driven projects because ownership cost is often determined by controls integration, utility performance, alarm design, data visibility, and the ability to reduce operator dependence over time.
From a manufacturing capabilities standpoint, DPS supports a broad product mix across both food and beverage. Beverage applications include brewing, spirits, wine, kombucha, soft drinks, functional beverages, dairy-based beverages, and aseptic systems. Food applications include proteins, prepared foods, sauces, dairy processing, retort and shelf-stable products, plant-based processing, and co-packing environments. The company also manufactures selected process equipment such as tanks, CIP systems, marination tumblers, and cooking vessels, which can improve design alignment in projects where utility integration and hygienic functionality affect lifecycle cost.
From a service capabilities standpoint, DPS provides process engineering and design, capital planning, feasibility work, owner’s representation, project and program management, general contracting where licensed, equipment supply, installation, integration, commissioning, and execution oversight under its Design Build Manage model. That full-scope approach is especially useful when buyers want a more accurate TCO picture before funds are committed, because project success depends not only on equipment selection but also on installation quality, startup discipline, compliance readiness, and operational handoff.
For manufacturers trying to avoid expensive ownership surprises, that kind of integrated approach can help reveal lifecycle costs earlier and support better capital deployment.
FAQ
What is the biggest hidden cost in food equipment ownership?
In many U.S. plants, downtime is the largest hidden cost because lost production, missed shipments, and recovery inefficiencies often exceed the direct repair expense.
How many years should a TCO model cover?
Most buyers use 5, 10, or 15 years depending on asset life, maintenance intensity, and how quickly the process may become obsolete.
Should TCO include utilities and sanitation?
Yes. Water, steam, chemicals, compressed air, refrigeration, and sanitation labor can materially change which option is truly lower cost over time.
How does regulatory compliance affect TCO?
Compliance affects documentation, validation, calibration, startup time, rework risk, and audit readiness. These costs should be budgeted from the beginning.
Why do imported systems sometimes have higher TCO?
Not because imported equipment is inherently worse, but because parts availability, technician access, lead times, and documentation gaps can increase lifecycle cost in U.S. operations.
What data should I request from vendors?
Request energy consumption under actual load, recommended spare parts, maintenance intervals, expected uptime, documentation package scope, training plan, and critical component lead times.
How is TCO different for food versus beverage?
The framework is similar, but the cost drivers differ. Beverage often emphasizes utility efficiency, syrup and blending control, and line uptime. Food may emphasize washdown durability, product yield, cook or thermal consistency, and sanitary access.
Can a more expensive system still have better ROI?
Absolutely. If it reduces downtime, energy use, labor dependence, and compliance burden, the higher-priced system can produce significantly lower lifecycle cost and better payback.
What is a good first step before buying?
Build a plant-specific TCO worksheet using real throughput, utility rates, labor assumptions, sanitation procedures, and downtime values rather than generic vendor assumptions.
What will matter most by 2026?
Expect lifecycle buying to be influenced even more by automation, predictive maintenance, utility efficiency, water stewardship, refrigerant policy, traceability expectations, and flexible manufacturing for shorter runs.
[/trp_language]
Complete Company Portfolio

About the Author: Disruptive Process Solutions (DPS)
The DPS team combines process engineering expertise with real-world food and beverage manufacturing experience. Our content focuses on process optimization, production efficiency, facility improvements, and practical solutions that help manufacturers operate more effectively in a rapidly evolving industry.
Share

