2026 Food Plant Automation Strategy: A 5-Layer Framework for US Facilities
[trp_language language=”en_US”]
United States Food Plant Automation Strategy for 2026
Food and beverage manufacturers in the United States are entering 2026 under pressure to improve throughput, labor efficiency, traceability, quality consistency, and capital productivity at the same time. Rising labor costs, stricter food safety expectations, retailer data demands, and the need for resilient supply chains are pushing facilities to modernize far beyond single-machine upgrades. The most effective path is not random digitization. It is a structured, layered automation strategy that starts on the plant floor and scales to enterprise visibility.
This article outlines a practical five-layer framework for U.S. facilities, from equipment-level sensing and controls up to ERP-connected decision support. It is designed for processors in meat, dairy, prepared foods, sauces, aseptic products, brewing, spirits, RTD beverages, and co-packing operations across major production regions such as the Midwest, Texas, California’s Central Valley, the Carolinas, and logistics corridors around Chicago, Dallas-Fort Worth, Atlanta, Memphis, Houston, and the Port of Los Angeles.
Quick Answer

The best 2026 food plant automation strategy for the United States is a five-layer architecture:
- Layer 1 builds a reliable controls and sensing foundation at the machine and utility level.
- Layer 2 turns live machine data into OEE, downtime, alarms, and operator-facing visual management.
- Layer 3 connects production systems to MES for recipes, genealogy, electronic batch records, and analytics.
- Layer 4 applies AI to predictive maintenance, process optimization, and quality risk detection.
- Layer 5 connects plant operations to ERP for enterprise-wide scheduling, inventory, costing, and executive visibility.
Plants that move through these layers in sequence typically reduce unplanned downtime, improve yield, shorten changeovers, strengthen compliance readiness, and make better capital decisions. For most U.S. food facilities, the fastest return comes from Layer 1 and Layer 2, while the highest long-term enterprise value comes from Layers 3 through 5.
| Layer | Primary Goal | Main Technologies | Typical KPI Impact | Best Fit | Expected ROI Window |
|---|---|---|---|---|---|
| 1 | Reliable machine data and control | PLC, VFD, sensors, valves, HMIs | Uptime, safety, repeatability | Brownfield and greenfield plants | 6 to 18 months |
| 2 | Real-time OEE and visual management | SCADA, dashboards, downtime tracking | Availability, performance, labor use | Lines with frequent stops | 4 to 12 months |
| 3 | Production orchestration and traceability | MES, batch control, historian | Yield, genealogy, compliance speed | Multi-SKU and regulated sites | 12 to 24 months |
| 4 | Predictive maintenance and quality | AI models, vibration, vision, anomaly detection | Downtime reduction, defect prevention | High-volume assets | 12 to 30 months |
| 5 | Enterprise visibility and financial alignment | ERP integration, APS, costing, inventory sync | Schedule adherence, margin control | Multi-site operations | 12 to 36 months |
| All Layers | Connected operations | Cybersecurity, networking, standards | Scalability and governance | Every facility | Continuous |
This summary table shows why sequencing matters. Plants that skip directly to AI or enterprise dashboards without clean machine-level data usually get weak adoption and unreliable results.
The line chart reflects a realistic growth trajectory in automation investment as processors respond to labor scarcity, nearshoring, retailer service expectations, and the need to improve plant economics in major manufacturing hubs from Wisconsin and Iowa to California and North Carolina.
Layer 1: Equipment-Level Sensing & Control Foundation

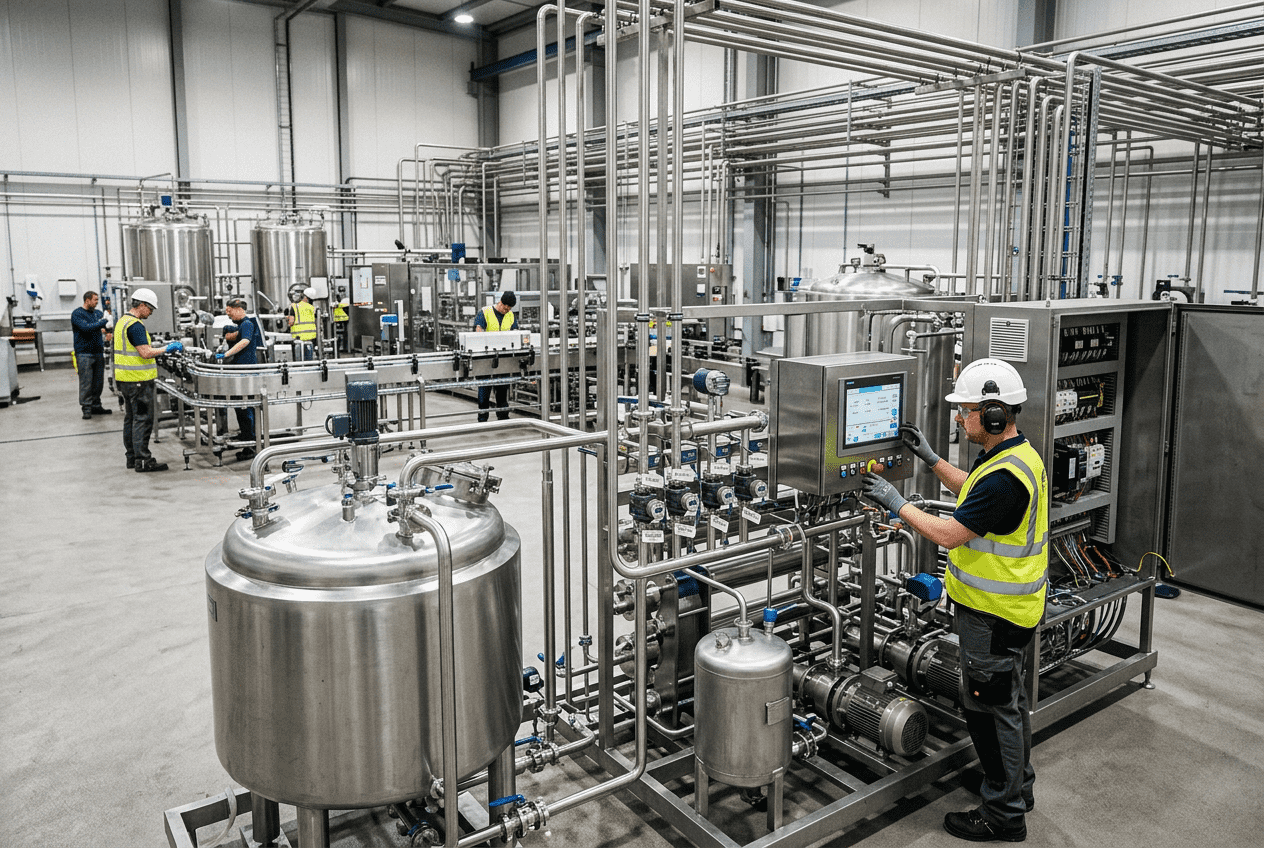
Layer 1 is where automation strategy becomes real. It includes PLC architecture, I/O design, field instrumentation, motor control, valve clusters, recipe-capable sequencing, and a clean controls network. In many U.S. food plants, this layer is partially modernized. A packaging line may have current PLCs, while upstream batching, utility skids, or CIP loops still rely on legacy controls or manual checks.
The objective is simple: every critical asset should produce trustworthy, timestamped operational data while maintaining stable and repeatable control. This includes mixers, cookers, pasteurizers, retorts, fillers, conveyors, pumps, compressors, boilers, glycol systems, chillers, water treatment, and CIP systems. For protein processors in the Midwest, refrigeration and sanitation events may be the top priority. For beverage plants around Charlotte, Southern California, or Texas, syrup rooms, blending accuracy, carbonation, and filler performance often come first.
At this layer, engineering discipline matters more than software hype. Standardize panel builds, PLC naming conventions, alarm philosophy, tag structures, and network segmentation. Define instrumentation classes for pressure, flow, conductivity, temperature, Brix, level, pH, turbidity, vibration, and energy metering. If utilities are unstable, no analytics stack on top will be reliable.
| Asset Type | Recommended Sensors | Control Priority | Typical Failure Risk | Data Sampling Need | Food Sector Example |
|---|---|---|---|---|---|
| Pasteurizer or UHT skid | Temperature, flow, pressure, conductivity | Critical | Product loss or compliance deviation | High | Dairy, juice, RTD tea |
| CIP system | Conductivity, temperature, level, flow | Critical | Sanitation failure | High | Dairy, sauces, brewing |
| Fermentation tank | Temperature, pressure, level | High | Batch inconsistency | Medium | Beer, kombucha, yeast products |
| Retort or thermal process line | Temperature, pressure, timing, valve position | Critical | Food safety exposure | High | Shelf-stable meals |
| Conveyorized packaging line | Photoeye, motor load, speed feedback | High | Micro-stops and jams | Medium | Prepared foods, snacks |
| Compressed air or glycol utility | Pressure, temperature, energy, vibration | Medium | Hidden utility inefficiency | Medium | All food and beverage plants |
This table helps engineering teams prioritize sensors based on process criticality rather than buying devices simply because they are available. In food manufacturing, the most valuable signals are the ones tied to quality release, sanitation, uptime, and utility cost.
U.S. facilities also need Layer 1 to support regulatory and customer requirements. USDA-inspected meat plants, FDA-regulated aseptic lines, and SQF-certified co-packers all benefit from automated data capture that reduces handwritten records and strengthens audit readiness. For plants shipping through export channels tied to Savannah, Newark, Long Beach, or Houston, traceable process verification can also support customer confidence and dispute resolution.
When selecting controls architecture, owners should favor open protocols and maintainability. Ethernet/IP, Profinet, Modbus TCP, OPC UA, and secure historian connectors are more scalable than isolated proprietary islands. Brownfield sites should also review spare parts risk. If the plant still relies on end-of-life PLC families, 2026 is the right time to address obsolescence before growth projects stack more complexity on fragile infrastructure.
Layer 2: Real-Time OEE Measurement & Visual Management

Once machine-level data is dependable, the next priority is turning it into operational visibility. Layer 2 focuses on OEE, downtime reason capture, line status, alarm escalation, shift dashboards, and visual management for operators, supervisors, maintenance teams, and plant managers.
Many U.S. food plants still estimate downtime from shift notes or maintenance logs. That approach hides the real loss structure. A line may appear capacity-constrained when the true issue is a series of 90-second filler stops, labeler starwheel jams, ingredient waiting, sanitation holds, or inconsistent upstream temperature control. Real-time OEE exposes these patterns.
The best OEE systems are not just executive scoreboards. They are plant-floor tools. Large displays above the line, Andon signals, downtime prompts at HMIs, mobile alerts to maintenance leads, and shift-end loss reviews create behavior change. In poultry, dairy, brewing, and prepared foods, visual management often delivers rapid gains because it makes recurring problems impossible to ignore.
| OEE Dimension | What It Measures | Common Losses | Data Source | Operator Action | Management Use |
|---|---|---|---|---|---|
| Availability | Run time versus planned time | Breakdowns, sanitation delay, changeover overrun | PLC status, line state, work order timing | Escalate downtime reason | Maintenance and staffing focus |
| Performance | Actual rate versus ideal rate | Micro-stops, slow speed, feeding issues | Encoder, count, cycle data | Correct line balance | Capacity planning |
| Quality | Good units versus total units | Rework, fill variance, damaged packs | Inspection and reject signals | Adjust process and handling | Yield and cost control |
| Changeover Time | Elapsed setup time | Tooling delays, missing materials | Production schedule and machine state | Follow standardized checklist | SKU rationalization |
| Sanitation Readiness | Time to release after cleaning | CIP variance, swab delays | CIP logs, QA release | Complete verification steps | Schedule reliability |
| Labor Utilization | Output relative to staffed labor hours | Waiting, rework, poor coordination | Labor input and production counts | Reassign support roles | Cost and staffing model |
This OEE table is useful because it shows that performance losses are often cross-functional. Engineering, production, maintenance, QA, and sanitation all influence the numbers.
The bar chart illustrates where real-time OEE demand is strongest. Protein, prepared foods, and dairy often lead because they combine high line utilization with tight quality and sanitation requirements.
For U.S. operators, Layer 2 should also include role-specific dashboards. A plant manager in Chicago may want line-by-line OEE and labor productivity. A maintenance supervisor in Fresno may need top fault codes by asset family. A corporate operations team in Atlanta may want daily throughput, yield, and changeover trends across multiple states. The underlying data should be shared, but the views should be specific.
Plants considering this layer should also evaluate automation integration and engineering services that can connect controls, SCADA, and reporting without disrupting production. The key is not just screen design. It is defining line states, event rules, ideal rates, downtime taxonomies, and escalation workflows that match how the facility actually runs.
Layer 3: MES Integration & Production Analytics
Layer 3 is where a plant transitions from visibility to orchestration. A manufacturing execution system connects orders, recipes, material consumption, batch records, operator actions, QA checkpoints, and genealogy. This is the layer that matters most for complex SKU environments, co-packers, regulated processes, and multi-step production where manual paperwork creates delay and ambiguity.
In the United States, MES adoption is accelerating in facilities that must respond quickly to customer audits, retailer scorecards, or frequent changeovers. A co-packer near Dallas serving multiple beverage brands needs stronger lot traceability than a single-SKU commodity line. A dairy or aseptic site shipping nationwide may need electronic records to support release confidence and recall readiness. A prepared foods plant supplying club stores may need faster line clearance validation and material reconciliation.
MES functionality can include:
- Electronic batch records
- Recipe and formulation governance
- Material issue and consumption tracking
- Lot genealogy from receiving to finished goods
- Work instruction control
- Quality checkpoints and hold release
- Production scheduling execution
- Integration to warehouse and ERP systems
It is also the layer where production analytics becomes more meaningful. Instead of only knowing that a filler ran slowly, teams can see whether the root cause was syrup timing, upstream blend availability, film variation, sanitation delays, or operator training gaps.
| MES Capability | Operational Benefit | Compliance Benefit | Typical Users | Priority for Food Plants | Data Integration Need |
|---|---|---|---|---|---|
| Electronic batch records | Faster review and less paperwork | Audit-ready documentation | Production, QA | High | PLC, historian, QA system |
| Recipe control | Lower formulation error | Controlled changes | Process engineering, operators | High | PLC, scale, flowmeter |
| Genealogy | Faster traceability | Recall support | QA, supply chain | Critical | ERP, barcode, MES |
| Quality workflows | Fewer release delays | Enforced checks | QA, sanitation | High | LIMS, MES |
| Production dispatching | Better schedule execution | Controlled order flow | Supervisors, planners | Medium | ERP, MES |
| Performance analytics | Better loss elimination | Documented process history | Management, CI teams | High | SCADA, historian, MES |
The table above shows why MES is usually justified by a mix of operational and compliance benefits. Plants should not treat it as a software purchase only. It is a process design project.
For manufacturers seeking end-to-end plant execution, it helps to work with a partner that understands process engineering, controls, utilities, and installation together. That matters when MES has to align with real-world asset behavior in blending rooms, retorts, cook systems, fermentation cellars, CIP skids, and packaging halls. DPS approaches these projects from both the controls and process side, not just from the IT side, which is important in plants where line performance depends on utility stability and process sequencing.
Facilities exploring broader capital modernization can review project case examples to see how execution strategy, not just technology choice, affects schedule, startup speed, and operational payoff.
Layer 4: AI-Driven Predictive Maintenance & Quality
Layer 4 is where advanced analytics starts creating proactive advantage. In 2026, the strongest AI applications in U.S. food plants will not be generic chat interfaces. They will be focused models that predict failures, flag abnormal conditions, optimize process windows, and detect quality risk earlier than manual review.
Predictive maintenance is often the first win. Vibration, temperature, current draw, runtime patterns, and fault frequency can be used to forecast bearing wear, pump cavitation, conveyor motor degradation, compressor instability, or filler component fatigue. For a plant running high-volume production near Memphis, Indianapolis, or the Inland Empire, preventing even a few major shutdowns can justify the investment quickly.
On the quality side, AI can support fill-level checks, seal integrity review, vision-based defect screening, fermentation trend analysis, and multivariable process monitoring. In dairy and beverage plants, models can correlate upstream conditions such as Brix, temperature, residence time, and differential pressure with downstream reject patterns. In protein and prepared foods, AI can identify cooking variance, packaging defects, or sanitation-driven performance drift.
The area chart reflects a realistic transition occurring across the U.S. market: plants are moving from reactive maintenance toward predictive programs, especially where labor shortages make skilled troubleshooting harder to sustain.
Still, Layer 4 has prerequisites. AI is only useful when the plant has:
- Consistent asset naming and event history
- Reliable sensor data and time synchronization
- Enough failure or process history to train models
- Clearly defined business use cases
- Personnel who trust and act on the outputs
For this reason, many processors should begin with narrow pilots: one filler, one retort battery, one compressor room, one fermentation cellar, or one packaging defect category. A pilot should be judged by avoided downtime, reduced scrap, lower maintenance overtime, or faster root-cause detection.
From a technology standpoint, this is also where a company’s engineering depth matters. DPS brings controls, SCADA, PLC programming, utility integration, and process knowledge together, which makes it better suited for AI use cases tied to real equipment behavior rather than purely theoretical analytics. In food and beverage environments, context matters: a vibration signal means little if you do not understand when a pump is in CIP service, product transfer, recirculation, or idle standby.
Layer 5: ERP-Connected Enterprise Visibility
The final layer connects production reality to business decisions. ERP-linked automation allows companies to synchronize schedules, inventory, lot movements, labor assumptions, maintenance activity, purchasing triggers, and actual production outcomes. It closes the gap between what planners think the plant can do and what the plant is actually doing.
For multi-site U.S. manufacturers, this is increasingly important. A company with facilities in North Carolina, Texas, California, and Illinois cannot rely on spreadsheets if it wants accurate service-level commitments, margin visibility, and coordinated capital planning. ERP-connected visibility helps answer questions like:
- Which site should run which SKU next week?
- What is the true cost of a changeover-heavy product family?
- Which lines are consuming overtime without improving shipped volume?
- How much working capital is tied up in WIP and packaging inventory?
- What asset constraints are limiting promised orders?
Layer 5 is also where sustainability and policy trends gain practical force. More retailers and enterprise customers are asking suppliers for energy, water, waste, and traceability metrics. State-level environmental pressures in California, utility pricing in Texas, wastewater constraints in parts of the Midwest, and ESG reporting needs for larger organizations are all increasing demand for plant-to-enterprise data consistency.
| Enterprise Use Case | ERP Connection | Plant Data Needed | Business Result | Best for | Decision Horizon |
|---|---|---|---|---|---|
| Finite scheduling | Orders and capacity | Actual run rates, downtime, changeover | Better OTIF performance | Multi-line plants | Daily to weekly |
| Inventory accuracy | Materials and finished goods | Consumption, yield, lot movements | Lower write-offs | High-SKU sites | Daily |
| Standard versus actual costing | Finance and production | Labor, runtime, scrap, utilities | Margin clarity | Enterprise operators | Monthly |
| Maintenance planning | CMMS or ERP maintenance module | Runtime, condition data, faults | Lower breakdown risk | Asset-intensive sites | Weekly to monthly |
| Procurement signals | Purchasing and MRP | Usage, schedule, line constraints | Lower stockout risk | Ingredient-sensitive plants | Weekly |
| Executive visibility | BI and financial reporting | OEE, yield, service level, cost | Better capital allocation | Multi-site leadership teams | Monthly to quarterly |
This table shows why Layer 5 should not be treated as a finance-only initiative. The value comes from aligning actual plant performance with commercial and operational decisions.
The comparison chart highlights a common reality in food manufacturing: software value increases when paired with strong process, controls, installation, and startup execution capability.
Technical Specifications and Engineering Requirements
For a 2026 automation strategy to succeed, plants need hard engineering standards, not just vision statements. The following requirements are common across successful U.S. food and beverage projects:
| Engineering Category | Recommended Requirement | Reason | Typical Risk if Ignored | Best Practice | Priority |
|---|---|---|---|---|---|
| Controls architecture | Standard PLC platform by asset class | Easier support and spares | High maintenance complexity | Limit platform variation | Critical |
| Networking | Segmented industrial network with managed switches | Security and reliability | Broadcast issues and cyber exposure | OT network design review | Critical |
| Data model | Unified tag naming and asset hierarchy | Clean analytics and MES mapping | Broken reports and poor AI readiness | ISA-style conventions | High |
| Cybersecurity | Role-based access, backups, patch policy | Reduced ransomware and downtime risk | Production disruption | OT security governance | Critical |
| Instrumentation | Food-grade, washdown-suitable devices | Reliability in wet sanitation zones | Frequent sensor failure | NEMA/IP and hygienic review | High |
| Validation and testing | FAT, SAT, I/O checkout, recipe verification | Safer startup | Late-stage commissioning failure | Structured test protocols | Critical |
The technical standard table should be translated into a project playbook before procurement begins. That avoids incompatibility between skid vendors, utility packages, line builders, and corporate systems.
U.S. processors should also plan around site realities. Older East Coast plants may have space and utility limitations. Gulf Coast sites may need hurricane resilience and backup power strategies. California facilities may face water and energy constraints. Midwestern meat and dairy sites often require rugged sanitation-ready hardware and careful refrigeration integration.
For projects involving tank farms, pasteurization, blending, fermentation, distillation, retorts, CIP, or utility expansions, manufacturers benefit from partners that can engineer across structural, mechanical, plumbing, electrical, process, and controls disciplines. DPS combines those technical capabilities with turnkey installation and commissioning, which helps reduce the common gap between engineered intent and field execution. Manufacturers can also review process equipment capabilities when evaluating how custom tanks, CIP systems, tumblers, or cooking vessels fit into broader automation plans.
Implementation Roadmap and Project Best Practices
The best automation strategies are staged, measurable, and tied to production economics. For most U.S. food facilities, a phased roadmap works better than a single massive digital transformation announcement.
| Phase | Duration | Main Activities | Primary Deliverables | Risk to Manage | Success Metric |
|---|---|---|---|---|---|
| 1. Assessment | 4 to 8 weeks | Asset audit, controls review, KPI baseline | Current-state map and business case | Incomplete field data | Prioritized opportunity list |
| 2. Foundation design | 6 to 12 weeks | Standards, architecture, budget, scope | Control narrative and implementation plan | Vendor misalignment | Approved design package |
| 3. Pilot deployment | 8 to 16 weeks | Install on one line or system | Working pilot with dashboards | Poor operator adoption | Verified KPI improvement |
| 4. Scale-up | 3 to 12 months | Replicate by line, utility, or site | Standardized rollout | Change fatigue | Cross-site consistency |
| 5. MES and ERP linkage | 4 to 12 months | Integrate recipes, lots, and orders | Connected execution workflows | Master data quality issues | Traceability and planning gains |
| 6. AI optimization | Ongoing | Model training, use-case expansion | Predictive alerts and quality insights | Weak data governance | Avoided downtime and scrap |
This roadmap is effective because it gives plants an early proof point while preserving long-term architecture. It also prevents teams from overbuying software before plant data and workflows are ready.
Best practices for implementation include:
- Start with the business problem, not the tool.
- Baseline current OEE, yield, labor, and downtime before changes begin.
- Design around sanitation, washdown, and utility realities.
- Include operators and maintenance technicians in screen and alarm design.
- Standardize line-state definitions before reporting rollout.
- Use commissioning and training plans that reflect actual shift conditions.
- Protect production with cutover windows and rollback plans.
- Measure ROI in throughput, labor efficiency, scrap, utility cost, and avoided capital.
A well-run project also considers whether capital can be avoided through controls improvement before equipment expansion. That is one of the most overlooked opportunities in U.S. manufacturing. Sometimes the bottleneck is not physical capacity but logic, sequencing, scheduling discipline, or utility stability. The right engineering partner should be willing to say that directly.
Our Company
Disruptive Process Solutions supports food and beverage manufacturers across the United States and Canada with a model built around engineering, building, and managing profitable capital projects. Rather than acting as a narrow vendor, the company operates as an execution-focused partner for processors that need strong technical depth, honest guidance, and fast decision-making.
From a technology perspective, DPS works across process controls, PLC programming, SCADA, automation integration, utility systems, and production infrastructure. That includes the kind of interdisciplinary work required for modern facilities where process equipment, controls, data capture, and utilities must function as one system. This is especially valuable in sectors such as brewing, spirits, dairy, aseptic processing, protein, prepared foods, and co-packing.
From a manufacturing capability standpoint, DPS supports complete processing environments including blending, batching, pasteurization, sterilization, retort, fermentation, distillation, carbonation, grinding, mixing, forming, marination, cooking, and CIP. The company also provides proprietary equipment such as tanks, custom CIP systems, marination tumblers, and cooking vessels, helping clients align equipment design with the broader plant strategy.
From a service capability standpoint, DPS provides process engineering and design, capital planning, feasibility work, owner’s representation, project and program management, general contracting support where licensed, installation management, and turnkey system integration. That combination is useful for manufacturers expanding in high-growth corridors or upgrading legacy sites where coordination between local trades, equipment suppliers, and operations teams is often the difference between a profitable startup and an expensive delay.
Companies evaluating strategic modernization can learn more about the DPS team and approach, especially if they want a partner that balances technical rigor with commercial practicality.
FAQ
What is the best first step for a food plant starting automation in 2026?
Begin with a plant assessment of controls, data availability, downtime patterns, and utility constraints. Most sites should first standardize Layer 1 and then implement Layer 2 on their highest-value line.
How much of the framework is relevant for small or mid-sized U.S. processors?
All five layers are relevant, but they do not need to be deployed at once. A mid-sized sauce plant, brewery, or protein processor may start with controls and OEE, then add MES for traceability as customer complexity grows.
Is OEE enough without MES?
No. OEE is powerful for performance visibility, but MES is needed when genealogy, recipe enforcement, electronic batch records, and production orchestration become critical.
When does AI make sense in a food facility?
AI makes sense after the plant has stable controls, reliable data, and a clear use case such as predicting pump failures, reducing filler defects, or identifying abnormal process conditions.
What are the biggest 2026 trends in U.S. food plant automation?
Key trends include labor-saving automation, electronic traceability, AI-based maintenance, cybersecurity for OT networks, water and energy monitoring, and tighter ERP-to-plant data integration.
How should plants evaluate suppliers or integrators?
Look for food-specific process knowledge, controls capability, field execution experience, compliance familiarity, startup support, and the ability to connect capital planning with operational ROI.
What industries benefit most from this five-layer model?
Dairy, protein, prepared foods, brewing, spirits, sauces, RTD beverages, aseptic products, and co-packing operations all benefit because they face a mix of throughput, quality, and traceability pressure.
Can a plant modernize without replacing all equipment?
Yes. Many U.S. facilities gain major improvement by upgrading controls, sensors, logic, utility integration, and reporting on existing assets before replacing full lines.
How does sustainability fit into the automation strategy?
Automation helps measure energy, water, steam, compressed air, and waste more accurately. In 2026, this matters for utility cost control, customer reporting, and facility resilience.
Why is a layered approach better than buying isolated tools?
Because each layer depends on the one below it. Without a controls foundation, OEE is unreliable. Without operational structure, MES becomes messy. Without good data, AI underperforms. Without integration, ERP visibility is incomplete.
For U.S. food and beverage manufacturers, the winning 2026 strategy is not about installing the most software. It is about building an automation stack that reflects how plants actually run, how products actually move, and how capital actually earns return. When the five layers are implemented with discipline, facilities gain not only better data, but better decisions.
[/trp_language]
Complete Company Portfolio

About the Author: Disruptive Process Solutions (DPS)
The DPS team combines process engineering expertise with real-world food and beverage manufacturing experience. Our content focuses on process optimization, production efficiency, facility improvements, and practical solutions that help manufacturers operate more effectively in a rapidly evolving industry.
Share

