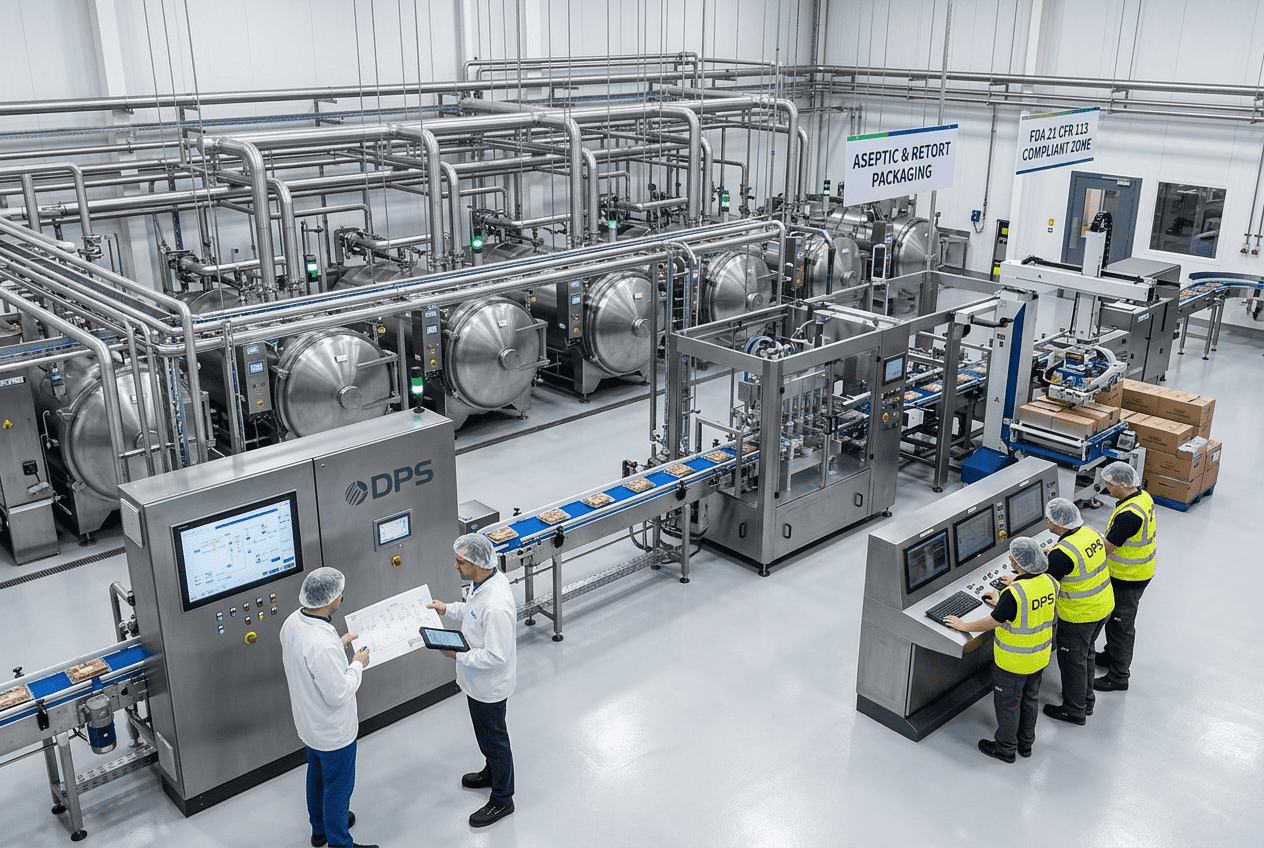
Food Facility Mass Balance Calculations: Engineering Methods for Production Efficiency
[trp_language language=”en_US”]
Food Plant Mass Balance Methods in the United States
Mass balance calculations are one of the most practical engineering tools for improving production efficiency in food and beverage facilities across the United States. Whether a plant is processing poultry in Arkansas, sauces in Illinois, dairy in Wisconsin, beverages in California, or co-packed shelf-stable meals near Houston, the same principle applies: every pound, gallon, or kilogram entering a system must either leave the system, accumulate in it, or be lost in a measurable way. When this discipline is applied correctly, manufacturers gain tighter yield control, better scheduling accuracy, cleaner utility planning, stronger compliance records, and more profitable capital decisions.
For U.S. manufacturers facing narrow margins, labor volatility, ingredient price swings, and sustainability pressure, mass balance is no longer just a process engineering exercise. It is a business management tool. Production leaders use it to understand shrink, accounting teams use it to reconcile inventory, operations managers use it to plan line loading, and project teams use it to size equipment, tanks, heat exchangers, pumps, and CIP systems. In high-throughput regions such as the Midwest dairy corridor, the Southeast poultry belt, and beverage hubs around Atlanta, Dallas, and Los Angeles, accurate mass balance work often separates reliable plants from facilities that constantly chase unexplained losses.
This guide explains the engineering methods behind food facility mass balance calculations, how to quantify inputs and outputs, how to track moisture and solids, how to perform equipment-level balances, what software tools are useful, and how balance models connect to production scheduling. It also outlines common errors to avoid, buying advice for U.S. manufacturers, representative applications by product type, and where a full-scope engineering partner can help.
Quick Answer

A food plant mass balance is the structured calculation of all material entering and leaving a process over time. In practical terms, it answers questions such as:
- How much raw material is required to produce a target volume?
- Where do moisture losses occur during cooking, drying, concentration, or freezing?
- How much finished product, rework, byproduct, waste, and hold-up exist at each step?
- What tank, pump, filler, evaporator, or retort capacity is actually needed?
- Why do ERP inventory records differ from floor-level production reality?
For most U.S. food plants, the basic equation is:
Input = Output + Accumulation + Loss
On a steady-state line with no meaningful accumulation, that often simplifies to:
Input = Saleable Product + Byproduct + Waste + Emissions + Unrecovered Hold-Up
The most valuable mass balance models in food manufacturing are not theoretical. They are built around real measurements: load cells, magnetic flowmeters, Coriolis meters, Brix readings, moisture tests, protein and fat analyses, packaging counts, CIP return volumes, trim collection, and cleanout losses. Plants that consistently quantify these items can improve yield, reduce giveaway, support HACCP and traceability records, and make better investment decisions.
In the United States market, the strongest results usually come when mass balance is integrated into process design, automation, utility planning, and daily operations rather than treated as a one-time spreadsheet exercise.
Mass Balance Fundamentals for Food Plants

Mass balance begins by defining the system boundary. That boundary may be an entire facility, one production line, a single unit operation, or a campaign window such as one shift or one SKU run. In a sauce plant in New Jersey, the boundary may be the blend kitchen from ingredient staging to filler. In a meat plant near Kansas City, it may be the marination tumbler through thermal processing and packaging. In a brewery near Portland, it may be brewhouse to bright tank. The right boundary depends on the problem being solved.
Three fundamentals matter most:
- Clear basis of time. Balances should be tied to a specific period such as pounds per hour, gallons per batch, or cases per shift.
- Consistent units. Do not mix wet weight, dry weight, volume, and package counts without conversion rules.
- Measured composition. Water, fat, protein, sugar, salt, alcohol, and total solids must be tracked where composition changes materially affect results.
Food systems are more complex than simple chemical transfer systems because ingredients are often biological, variable, and seasonally inconsistent. Tomato solids from California may differ by harvest week. Poultry yield changes with bird size, temperature, and deboning performance. Dairy solids fluctuate with incoming milk composition. Fruit puree Brix can drift based on supplier and storage conditions. Because of that, mass balance in food plants always benefits from routine sampling and statistically grounded reconciliation.
The table below shows the core mass balance framework used in many U.S. facilities.
| Balance Level | Typical Scope | Primary Inputs | Primary Outputs | Key Measurements | Main Business Value |
|---|---|---|---|---|---|
| Facility balance | Entire plant by day or week | Raw ingredients, packaging, process water | Finished goods, waste, wastewater, byproduct | Receiving data, inventory, shipping | Financial reconciliation and plant yield |
| Line balance | One line or cell | Intermediate product, packaging components | Packed product, scrap, rework | Line counters, scales, reject data | Line efficiency and giveaway control |
| Batch balance | Kettle, mix tank, or reactor batch | Formula ingredients | Filled quantity, hold-up, cleanout | Load cells, batch sheets | Recipe accuracy and scheduling |
| Unit operation balance | Dryer, fryer, retort, evaporator | Feed stream | Product, vapor, purge, reject | Moisture, temperature, flow | Process optimization |
| Utility-linked balance | CIP, steam, chilled water, RO | Water, chemicals, energy-linked mass | Return flow, drain, evaporation | Conductivity, tank level, meters | Utility sizing and sustainability |
| Campaign balance | Multi-shift SKU run | Bulk ingredients and packaging lots | Saleable lots, rework, leftover WIP | ERP and floor records | Traceability and margin analysis |
This framework is useful because it connects engineering to operations. A plant may have a good facility-level balance but poor unit-level balance, which means the total numbers seem acceptable while one cooker, filler, or freezer is quietly creating losses.
The line chart reflects a realistic industry trend: more U.S. plants are moving from manual spreadsheets to digital mass balance and yield tracking as part of automation, compliance, and sustainability programs.
Input-Output Quantification Methods

Input-output quantification is where many plants either gain confidence or lose it. Good balances depend on disciplined measurement at receiving, batching, transfer, processing, packaging, and waste handling. In food and beverage applications, the preferred method depends on the product and process condition.
Common quantification methods include truck scales for bulk receiving, floor scales for super sacks and minor ingredients, load cells under tanks, magnetic or Coriolis flowmeters for liquids, positive displacement flow for viscous streams, package count verification, metal detector reject counts, and laboratory composition tests. In aseptic beverage and dairy systems, inline Brix, density, conductivity, and mass flow can materially improve calculation quality. In protein operations, trim bins, bone yield, purge loss, and cook loss must be tracked separately.
Plants should also distinguish between direct measurement and inferred measurement. Direct measurement comes from calibrated devices. Inferred measurement comes from formula assumptions, density conversions, standard package weights, or average loss factors. Direct measurements are generally superior, but inferred values remain necessary where measurement points are limited.
The following table compares common quantification methods used in U.S. food plants.
| Method | Best For | Accuracy Strength | Common Limitation | Typical U.S. Application | Practical Advice |
|---|---|---|---|---|---|
| Truck or floor scales | Bulk receiving and waste bins | High for total mass | No composition detail | Protein, grain, sugar, dairy | Link scale tickets to lot traceability |
| Tank load cells | Batches and storage vessels | High for batch additions | Mounting and vibration issues | Sauces, dairy, beverages | Use for formula verification and depletion |
| Coriolis flowmeters | Liquids with density variation | Very high | Higher capital cost | RTD beverages, dairy, syrups | Strong choice for critical transfer points |
| Magnetic flowmeters | Conductive liquids | Good volumetric accuracy | Requires density conversion | CIP, water, juices, brines | Pair with density or solids testing |
| Package count and checkweighing | Finished goods verification | Strong at line end | Misses upstream loss detail | Frozen foods, snacks, cups, bottles | Use with reject and rework tracking |
| Lab moisture and solids tests | Composition-changing processes | Critical for true yield | Sampling lag | Baking, drying, concentration | Set routine sampling frequency by SKU |
For a buying decision, U.S. plants should prioritize measurement at bottlenecks and high-value loss points rather than trying to instrument everything at once. A line filling premium beverage concentrates in Southern California may justify Coriolis meters at multiple transfer points. A bakery in Ohio may get excellent results first by improving dough batch scaling, oven moisture testing, and package-weight verification.
Industry by industry, quantification priorities differ:
- Dairy: solids-not-fat, cream separation efficiency, standardization, filler giveaway
- Protein: trim, purge, marinade uptake, cook loss, bone and offal accounting
- Beverage: Brix, blend ratios, carbonation losses, syrup room transfer accuracy
- Prepared foods: kettle yield, particulate-to-sauce ratio, retort shrink, package count
- Aseptic systems: sterile start-up loss, product push-out, hold-up and recovery
Moisture and Solids Accounting
Moisture and solids accounting is the most important advanced topic in food mass balance because many large apparent yield losses are actually water movement. Cooking, chilling, drying, evaporation, concentration, freezing, thawing, fermentation, and storage all affect water distribution. If a plant tracks only wet weight, it may misread process performance.
Consider a kettle sauce operation in Chicago. If 10,000 pounds of ingredients enter a batch and only 9,250 pounds are filled, the instinct may be to report a 7.5% yield loss. But if steam-off during cook is expected, and solids concentration rises to the target, the true material performance may be normal. Similarly, in a poultry line around Springdale, Arkansas, marinade uptake may increase weight before cooking, followed by expected cook loss and chill pickup. Without moisture accounting, operators can misdiagnose normal physics as process waste.
Two related balances are often needed:
- Total mass balance for all product and water movement
- Dry solids balance for true ingredient retention
Dry solids balance is especially useful for evaporators, dryers, breweries, tomato processing, yogurt, confectionery, and sauces. It helps answer whether solids are being lost or merely concentrated.
| Process Type | Typical Moisture Change | What to Track | Important Test | Frequent Risk | Operational Benefit |
|---|---|---|---|---|---|
| Cooking or baking | Moisture reduction | Cook loss, vapor release | Final moisture | Overcooking and low yield | Better oven or kettle control |
| Marination | Moisture uptake | Pickup percentage | Before and after weight | Uneven absorption | Consistent label and margin control |
| Evaporation | Water removal | Feed solids and concentrate solids | Brix or total solids | Incorrect concentration endpoint | Energy and throughput optimization |
| Drying | Significant water removal | Feed rate and final moisture | Moisture by sample lot | Product overdrying | Yield improvement |
| Freezing and thawing | Drip or purge loss | Weight before and after thaw | Purge measurement | Hidden downstream shrink | Inventory accuracy |
| Fermentation | CO2 release and composition change | Extract, alcohol, vent losses | Gravity and ABV | Unexplained cellar variance | Better batch predictability |
From a product perspective, moisture and solids accounting is essential for dairy powders, plant proteins, prepared meals, sauces, soups, brews, spirits, juices, yogurt, cheese, canned foods, meat snacks, and bakery items. It is also important for labeling compliance and standard-of-identity targets.
For U.S. manufacturers looking ahead to 2026, sustainability reporting is increasing the importance of water-linked mass balance. Plants are under pressure to document water intensity, product yield, wastewater loading, and recoverable byproduct streams. Accurate solids accounting helps reduce both overuse of utilities and organic loading to treatment systems.
The area chart shows how plants are increasingly moving beyond simple wet-weight reporting toward composition-aware yield management.
Process Equipment-Level Balances
Equipment-level balances are where mass balance becomes actionable for engineering and maintenance teams. Rather than only asking what the plant lost in a week, equipment-level analysis asks what happened at each tank, filler, freezer, dryer, tumbler, or retort. This is usually where the biggest improvement opportunities appear.
Typical balance targets include:
- Mix tanks and kettles: addition accuracy, dead volume, heel, transfer loss
- Pumps and transfer lines: line fill, push-out recovery, pigging effectiveness
- Evaporators and dryers: inlet mass, vapor removal, solids recovery
- Retorts and thermal systems: basket loading, drain loss, package rejects
- Fillers: startup loss, changeover loss, giveaway, reject rate
- CIP systems: product-to-drain loss before wash initiation
For example, a UHT beverage system near Fresno may lose meaningful product during sterile startup, interface transitions, and end-of-run push-out. A prepared foods facility near Minneapolis may lose margin in kettle heel and particulate stratification. A distillery in Kentucky may have fermenter-to-still transfer variance that appears small per batch but becomes major over a year.
The table below shows a practical equipment-level balance view.
| Equipment | Main Inputs | Main Outputs | Typical Hidden Loss | How to Measure | Improvement Priority |
|---|---|---|---|---|---|
| Blend tank | Ingredients, water, rework | Batch to filler, heel | Tank residue | Load cells and transfer reconciliation | High in viscous systems |
| Marination tumbler | Protein and marinade | Picked-up product, purge | Uneven uptake | Pre/post weight and pickup testing | High in poultry and pork |
| Oven or cooker | Raw product | Cooked product, vapor | Excess moisture loss | Moisture and weight checks | High in prepared foods |
| Filler | Bulk product and packaging | Packed units, rejects | Overfill giveaway | Checkweigher and reject count | Critical for margin |
| Evaporator | Feed liquor | Concentrate and vapor | Solids carryover | Feed/concentrate solids testing | Critical for dairy and juice |
| CIP return system | Water, chemical, product residue | Return flow, drain | Recoverable product to waste | Conductivity, volume, interface timing | Strong sustainability impact |
When performing equipment balances, plants should map product hold-up volumes and interface losses. This is especially relevant for long transfer lines, manifold-heavy systems, and multi-SKU beverage or dairy plants. In many cases, small per-changeover losses justify line pigging, improved push-out sequencing, recipe cutoff optimization, or revised valve automation.
These calculations also support buying advice. If a U.S. manufacturer is choosing between a larger tank and a smaller, more responsive one, or between a basic filler and an advanced servo filler, mass balance data can clarify the economic tradeoff. The cheapest equipment on paper may create the most costly yield loss in practice.
Software Tools for Mass Balance
Software tools for mass balance range from simple spreadsheets to integrated plant-wide systems. The right choice depends on plant complexity, staffing, automation maturity, and the decision that needs support. Smaller facilities may begin with structured Excel templates and laboratory data imports. Larger facilities often use MES, historian platforms, SCADA-linked dashboards, ERP reconciliation tools, and specialized process modeling packages.
In the United States, many projects now link mass balance to automation data collection. Flowmeters, tank levels, valve states, batch events, and line counts can feed a historian or SCADA layer. This reduces manual data entry and allows engineers to analyze losses by shift, SKU, or operator window. A good software setup does not need to be overly complex, but it must enforce unit consistency, version control, and exception visibility.
Useful software categories include:
- Spreadsheet-based mass balance templates for early studies and feasibility work
- ERP-integrated inventory reconciliation for production accounting
- MES and batch reporting systems for shift-level variance tracking
- SCADA and historian tools for real-time equipment and utility data
- Digital twin or process simulation tools for capital planning
The table below compares software approaches.
| Software Type | Best Use Case | Strength | Weakness | Typical User | Recommended Stage |
|---|---|---|---|---|---|
| Excel or Google Sheets | Pilot calculations and quick studies | Low cost and flexible | Manual errors and weak governance | Process engineer | Early analysis |
| ERP reconciliation tools | Inventory and lot accounting | Strong business integration | Limited real-time process detail | Operations finance | Daily and monthly close |
| MES platforms | Shift and batch performance | Good operational visibility | Setup effort | Production manager | Ongoing line management |
| SCADA/historian systems | Real-time process monitoring | Strong data capture | Needs instrumentation discipline | Controls and engineering teams | Automated facilities |
| Process simulation software | Capital projects and what-if scenarios | Powerful for design studies | Requires expert modeling | Engineering consultants | Expansion and redesign |
| Custom dashboards | Executive KPI reporting | Fast decision support | Depends on source data quality | Plant leadership | Multi-site oversight |
When companies evaluate software, they should ask whether the platform can separate planned evaporation from true loss, reconcile batch and continuous process data, and connect floor data to scheduling and procurement. Plants near major trade and logistics hubs such as Chicago, Savannah, Long Beach, and Dallas often run more complex supplier and production networks, making digital reconciliation especially valuable.
A full-scope engineering partner can help decide whether to build a simple, maintainable system or a highly integrated one. For example, food and beverage engineering services that combine process, controls, and project management can align instrumentation, software logic, and reporting structure so the balance model serves operations rather than becoming an isolated engineering file.
Integration with Production Scheduling
The connection between mass balance and production scheduling is often underestimated. Yet scheduling accuracy depends on realistic assumptions about batch yield, changeover loss, line starvation, intermediate storage, and cleanout recovery. If the mass balance is wrong, the schedule will also be wrong.
Suppose a beverage co-packer near Charlotte schedules three RTD runs back to back using nominal yields. If startup loss, syrup room residuals, and changeover interfaces are not included, the plant may miss case targets, short ingredients, or overload downstream warehousing. In a prepared foods plant in Indiana, failure to account for cook shrink and hold times can produce mismatches between upstream mixing and downstream tray sealing. In dairy, standardization and filler giveaway can throw off daily milk utilization planning.
The following scheduling variables should be tied directly to balance models:
- Batch size versus net fill yield
- Campaign changeover loss per SKU
- Intermediate tank heel and minimum working volume
- Expected evaporation or cook loss by recipe family
- Rework generation and permitted reintroduction rates
- CIP duration, chemical volume, and product push-out timing
Good integration supports procurement, labor planning, warehouse allocation, and utility use. It also improves customer service because promise dates become more reliable. For co-packers and contract manufacturers in particular, mass balance-informed scheduling helps prevent margin erosion on low-yield SKUs.
The bar chart illustrates where demand is strongest today. Protein, beverage, and dairy operations often have the fastest payback because yield movement is highly material to profitability.
Plants considering new capacity should also use mass balance in capital planning. Tank farms, syrup rooms, boiler capacity, cooling towers, compressed air, wastewater pretreatment, and packaging line rates all depend on realistic material flow assumptions. A planning partner that understands both food processing and business economics can translate those assumptions into practical facility decisions. More details on project approaches and examples can be explored through selected food and beverage project case studies.
Common Calculation Errors to Avoid
Many balance models fail not because the math is complex, but because the assumptions are poor. The most common errors in U.S. food plants are avoidable with better structure and cross-functional review.
Typical errors include using inconsistent units, confusing gross and net weight, ignoring startup and shutdown losses, assuming constant density, failing to separate evaporation from waste, overlooking rework loops, neglecting WIP accumulation, and relying on outdated formulation data. Another common issue is treating package count as equivalent to saleable mass even when overfill or underfill exists.
The table below summarizes recurring mistakes and how to correct them.
| Common Error | What Happens | Where It Appears | Likely Cause | Correction Method | Business Impact if Ignored |
|---|---|---|---|---|---|
| Mixed units | Wrong totals and conversions | Spreadsheets and handoffs | No standard basis | Set one master unit system | Bad capacity planning |
| Ignoring moisture change | False loss reports | Cooking and drying | Wet-weight only tracking | Add solids balance and moisture tests | Unnecessary process changes |
| Skipping startup loss | Understated required ingredients | Filling and aseptic lines | Nominal yield assumptions | Track startup by SKU | Schedule misses |
| No rework accounting | Double counting or hidden variance | Sauces, bakery, prepared foods | Poor lot tracking | Create rework ledger by batch | Inventory distortion |
| Unmeasured hold-up | Phantom shrink | Long piping and tanks | No line volume map | Document hold-up and recovery | Lower apparent yield |
| Outdated composition data | Inaccurate solids and yield assumptions | Seasonal ingredients | Static specifications | Refresh lab sampling plan | Poor purchasing and costing |
Two practical buying tips emerge from these errors. First, do not invest in software before standardizing the plant’s data definitions. Second, do not invest in hardware without a clear list of which loss points are worth measuring. Smart capital follows the highest-value questions.
By 2026, regulatory and customer expectations in the United States are likely to put greater emphasis on digital traceability, water stewardship, and verifiable production reporting. Plants that correct these basic calculation errors now will be better prepared for evolving customer audits and sustainability scorecards.
This comparison chart reflects why many manufacturers prefer integrated project delivery over isolated equipment procurement when mass balance accuracy is central to project success.
Our Company
Disruptive Process Solutions serves manufacturers across the United States and Canada with a business-first approach to food and beverage capital projects. Rather than treating mass balance as a narrow design exercise, the company applies it as part of broader process performance, profitability, and execution planning. That approach is especially relevant for manufacturers expanding capacity, relocating lines, improving yield, or building complex greenfield operations.
Technological capabilities. DPS supports process, controls, mechanical, structural, electrical, and plumbing engineering for food and beverage systems. This makes mass balance work more useful because material calculations can be tied directly to automation logic, utility loads, vessel sizing, line routing, and process control strategy. For beverage and aseptic facilities, that may involve blending systems, inline Brix monitoring, pasteurization, UHT, carbonation, water treatment, and SCADA-linked reporting. For food applications, it may include mixing, grinding, cooking, emulsification, retort processing, dairy systems, plant protein lines, and sanitary utility integration. Additional background on the firm can be found on the about our company page.
Manufacturing capabilities. DPS also brings equipment manufacturing experience to projects, including tanks, CIP systems, tumblers, and cooking vessels. That matters in mass balance-driven projects because fabricated equipment can be aligned with real hold-up volume targets, drainability needs, recovery expectations, and sanitation requirements rather than selected only from generic catalog options. For manufacturers evaluating vessel layout, transfer optimization, or custom process skids, the in-house perspective helps bridge the gap between engineering assumptions and shop-floor reality. More information about available systems and fabricated solutions is available under process equipment solutions.
Service capabilities. DPS operates through a design-build-manage model that can support capital planning, feasibility, owner’s representation, project management, general contracting functions, installation oversight, system integration, and commissioning. For a mass balance initiative, that means one team can connect the front-end study to field execution. In practical terms, a client may begin with a production bottleneck review, discover the real issue is a controls or transfer constraint rather than equipment size, and then implement the fix with coordinated engineering and construction support. That is often the difference between theoretical improvement and measurable plant results.
This integrated model is particularly useful for U.S. manufacturers in beverage co-packing, dairy expansion, protein processing, aseptic systems, and prepared foods, where project success depends on more than a standalone spreadsheet. It depends on how design, installation, controls, utility infrastructure, and schedule discipline all work together.
FAQ
What is the main purpose of mass balance in a food plant?
The main purpose is to account for all material entering and leaving a process so a manufacturer can understand yield, waste, byproduct, moisture movement, inventory accuracy, and equipment sizing.
Which industries benefit most from food mass balance calculations?
Dairy, beverage, protein, prepared foods, sauces, bakery, aseptic processing, distillation, fermentation, and co-packing operations all benefit strongly. The highest-value applications are usually where ingredient cost or shrink is significant.
How often should a plant update its mass balance?
Core balance assumptions should be reviewed at least quarterly, while high-value production balances are often monitored daily or by batch. Composition-heavy systems may need more frequent moisture or solids verification.
Can a plant use spreadsheets, or is specialized software required?
Spreadsheets are acceptable for early-stage studies and smaller operations. As complexity grows, integrated MES, ERP, historian, or SCADA-linked tools usually provide better control and lower manual error.
What local factors matter in the United States?
Ingredient variability by region, freight routes, utility costs, wastewater requirements, labor availability, and access to major logistics hubs such as Chicago, Houston, Savannah, Los Angeles, and New York all influence how balance models should be built and used.
How does mass balance help buying decisions?
It shows the true production impact of equipment choices by quantifying yield loss, hold-up, changeover waste, utility use, and line capacity. This often prevents overbuilding or buying equipment that looks inexpensive but performs poorly.
What are the biggest warning signs that a plant needs better mass balance work?
Frequent inventory discrepancies, unexplained yield loss, recurring schedule misses, high giveaway, inconsistent batch output, poor rework visibility, and disagreement between plant and finance numbers are major signs.
How does mass balance support sustainability goals for 2026 and beyond?
It helps quantify water use, wastewater loading, recoverable product, product-to-drain loss, and utility-linked material movement. Those metrics are becoming more important for customer reporting, ESG programs, and cost reduction.
Can mass balance be applied during expansion or greenfield design?
Yes. In fact, it is most powerful during planning because it guides tank sizing, line rates, utility capacity, storage design, and scheduling assumptions before capital is committed.
What should a manufacturer do first?
Start by identifying one high-value line or product family, define clear boundaries, standardize units, measure true input and output points, and validate moisture or solids movement. Once that model is reliable, expand plant-wide.
For food and beverage manufacturers in the United States, mass balance is one of the clearest paths to stronger production efficiency. It sharpens engineering, stabilizes scheduling, improves buying decisions, and creates a better foundation for profitability, compliance, and sustainable growth.
[/trp_language]
Complete Company Portfolio

About the Author: Disruptive Process Solutions (DPS)
The DPS team combines process engineering expertise with real-world food and beverage manufacturing experience. Our content focuses on process optimization, production efficiency, facility improvements, and practical solutions that help manufacturers operate more effectively in a rapidly evolving industry.
Share

