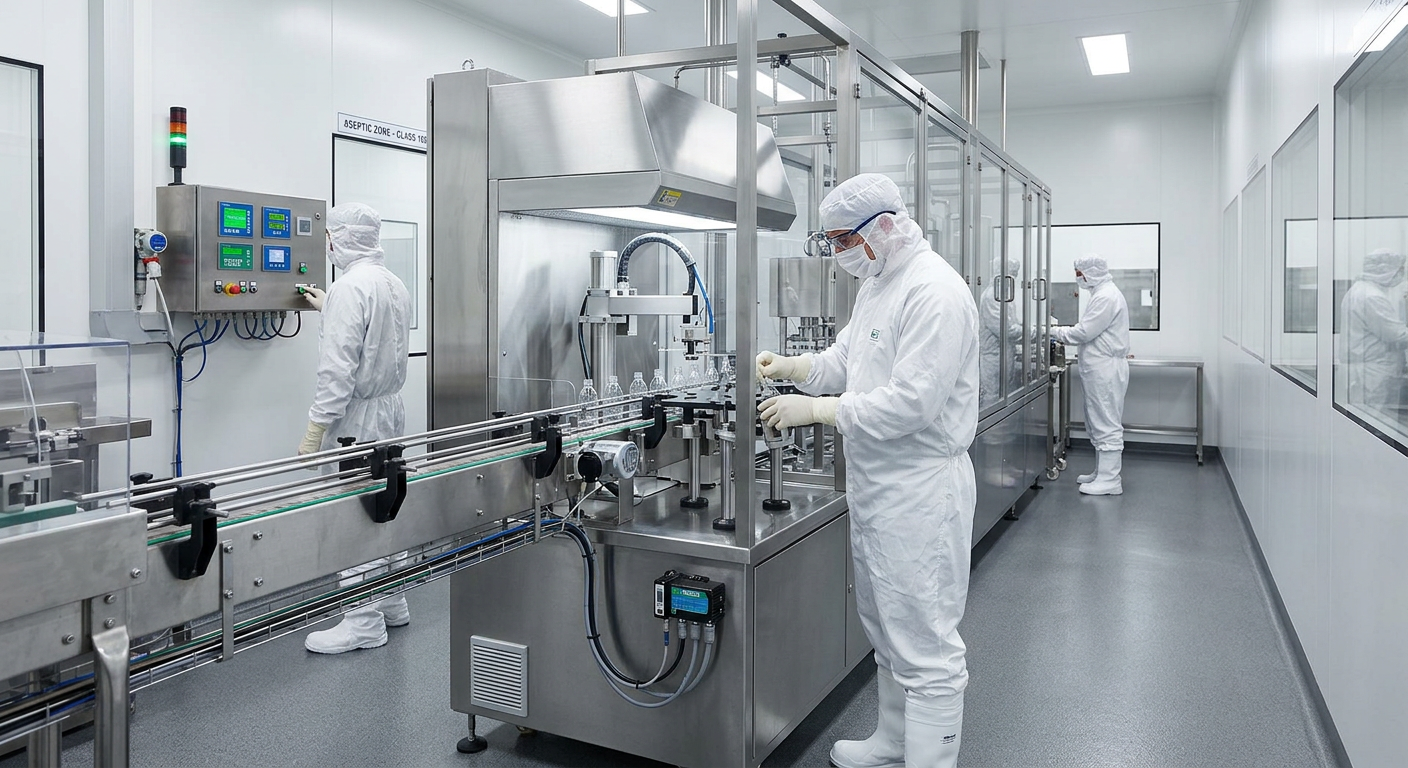
Food Facility Yield Improvement in 2026: Data-Driven Strategies for Margin Protection
[trp_language language=”en_US”]
2026 Yield Roadmap for U.S. Food Processing Facilities
For food manufacturers in the United States, yield improvement is no longer a narrow operations metric. In 2026, it is a margin protection strategy tied directly to raw material inflation, labor availability, retailer price pressure, sustainability goals, and capital efficiency. Plants that can reduce giveaway, capture hidden loss, stabilize recipes, and recover usable byproducts are positioned to outperform competitors even when commodity prices swing or freight lanes tighten through hubs such as Chicago, Dallas, Atlanta, Los Angeles, and the Port of Savannah.
This guide explains how U.S. food facilities can improve yield using data-driven methods, practical process control, automation, disciplined mass balance, and smarter capital planning. It is written for processors of proteins, prepared foods, sauces, dairy, shelf-stable products, and co-packed products that need measurable gains rather than vague efficiency goals.
Quick Answer

The quickest path to better yield in a U.S. food plant in 2026 is to focus on five actions in order:
- Measure yield by step, shift, SKU, and line instead of only at the finished-goods level.
- Use statistical process control to detect drift in moisture, trim loss, overfill, cook loss, Brix, viscosity, and package weight before loss compounds.
- Build a mass balance model that reconciles incoming raw materials, work in process, rework, waste, byproduct, and sellable output daily.
- Standardize recipes, batch execution, and equipment settings so operators are not solving the same problem differently each shift.
- Target capital projects that attack bottlenecks, not just capacity, because many yield issues are caused by controls logic, handling damage, poor CIP design, weak dosing accuracy, or inconsistent thermal processing.
In practical terms, a U.S. food facility can often unlock 1% to 5% yield gain without adding a new building. On high-volume operations, that may equal hundreds of thousands or millions of dollars annually. The biggest opportunities usually appear in protein deboning and portioning, sauce batching, dairy solids recovery, retort and thermal loss management, filling accuracy, and packaging giveaway.
| Yield Opportunity | Typical Loss Source | Common U.S. Plant Example | Potential Gain | Data Needed | Priority |
|---|---|---|---|---|---|
| Overfill reduction | Loose filler settings | Dressings and sauces in Midwest plants | 0.5% to 2.0% | Checkweigher history | High |
| Cook loss control | Temperature variability | Protein lines in Arkansas and Georgia | 1.0% to 3.0% | Time and temperature profiles | High |
| Trim and handling loss | Poor transfer design | Prepared foods in Texas | 0.5% to 1.5% | Line observation and weight studies | High |
| Batch recipe accuracy | Manual ingredient dosing | Sauce plants in California | 0.5% to 2.5% | Batch records and scale data | High |
| Rework optimization | Uncontrolled reuse rates | Bakery and dairy systems in Wisconsin | 0.5% to 1.5% | Rework logs | Medium |
| Byproduct monetization | Disposal of recoverable solids | Seafood and protein processors near Gulf ports | Variable | Waste composition and volumes | Medium |
The table above shows why yield work should start with measurement and economics together. Not every loss deserves the same level of engineering effort, but every major loss stream should be visible.
2026 Yield Improvement Roadmap for Food Facilities

A strong 2026 roadmap should combine direct operational actions with a broader market view. U.S. processors face higher expectations from retail, foodservice, and private-label customers for consistency, price discipline, traceability, and sustainability. At the same time, policy and buyer pressure are pushing plants to document food waste reduction, water efficiency, and energy performance. Yield sits at the center of all three.
Across the market, the most successful plants are shifting from reactive troubleshooting to structured yield programs. That means connecting procurement, production, QA, maintenance, automation, finance, and plant leadership around a common scorecard. For example, a poultry processor near Atlanta may focus on marinade pickup, tumble consistency, and cook yield; a dairy processor in Idaho may target solids capture and fill accuracy; a co-packer in New Jersey may prioritize formulation control, allergen changeovers, and rework discipline.
By product type, the roadmap differs slightly:
- Proteins: cut optimization, portion control, marination uptake, cook/chill control, drip loss, bone and trim recovery.
- Prepared foods: batching accuracy, transfer loss, depositor precision, freeze-thaw stability, overportioning.
- Sauces and dressings: Brix and viscosity control, blend accuracy, tank heel recovery, line pigging, filler giveaway.
- Dairy: solids recovery, separator efficiency, homogenization consistency, CIP-induced product loss, packaging accuracy.
- Aseptic and shelf-stable: start-up and shutdown losses, sterilization setpoint control, hold tube accuracy, package reject reduction.
Buying advice for 2026 is simple: do not purchase equipment purely on nameplate throughput. Buy around total delivered yield, recipe precision, hygienic design, cleanability, startup loss reduction, data accessibility, and operator repeatability. A faster line that creates uncontrolled giveaway is not a profitable upgrade.
The chart illustrates a realistic growth trend in U.S. investment toward yield-focused upgrades. The increase is being driven by ingredient volatility, automation adoption, and corporate sustainability targets.
| Roadmap Stage | Primary Goal | Responsible Team | Typical Duration | Main KPI | Expected Outcome |
|---|---|---|---|---|---|
| Baseline assessment | Find largest loss points | Operations and finance | 2 to 4 weeks | True yield by SKU | Visibility |
| Data validation | Confirm scale and sensor accuracy | QA and maintenance | 1 to 3 weeks | Measurement error rate | Trusted data |
| SPC deployment | Detect process drift early | Operations and controls | 4 to 8 weeks | Variance reduction | Stable process |
| Loss mapping | Assign value to waste streams | Plant leadership | 2 to 6 weeks | Loss cost per shift | Clear priorities |
| Equipment/controls fixes | Remove root bottlenecks | Engineering | 1 to 6 months | Yield gain | Higher throughput and margin |
| Continuous improvement | Lock in gains and scale | All departments | Ongoing | Rolling 90-day yield | Sustained performance |
This roadmap works best when it is applied facility-wide but executed by line. Plants in regions with high freight or labor cost, such as Southern California, the Northeast corridor, or major export corridors near Houston, often see even stronger returns because every pound saved has a higher delivered value.
Statistical Process Control for Yield

Statistical process control, or SPC, is one of the fastest ways to prevent silent yield erosion. Many U.S. plants record weights, temperatures, and formulation values, but fewer use control limits and trend rules to stop drift before it becomes scrap, giveaway, or rework.
Yield-focused SPC should monitor variables that directly influence sellable output. The exact list varies by industry, but common examples include:
- Incoming raw material moisture and fat levels
- Trim percentages by operator or shift
- Cook temperature, dwell time, and post-cook weight
- Brine or marinade pickup
- Brix, pH, viscosity, and in-line concentration
- Filler head performance and package net weight
- Reject rates at sealers, cappers, labelers, and metal detection points
For a protein facility in Missouri or North Carolina, an SPC chart can reveal whether cook loss rises during second shift because smokehouse loading patterns differ. In a beverage-adjacent sauce plant near Fresno, an SPC approach can show how small Brix drift increases overuse of sweetener and impacts viscosity, fill weight, and label claims downstream.
The biggest mistake is treating SPC as a quality-only tool. In 2026, it should be treated as a profit control system. The goal is not merely staying within specification; it is operating as close to target as possible without creating compliance risk.
The bar chart shows where yield control demand is strongest by industry segment. Proteins, sauces, and co-packing often rank high because they combine volatile input costs with large exposure to overfill, handling loss, and recipe variability.
| SPC Metric | Where Used | Why It Matters | Warning Sign | Action Trigger | Yield Impact |
|---|---|---|---|---|---|
| Net package weight | Filling lines | Controls giveaway | Mean drifting upward | Adjust filler and verify checkweigher | Immediate |
| Cook loss % | Protein and prepared foods | Protects sellable weight | Range widening | Review loading and thermal profile | High |
| Brix | Syrups and sauces | Protects formula cost | Downward or upward trend | Recalibrate dosing and flowmeters | Medium to high |
| Viscosity | Dressings and dairy | Affects fill and texture | Outliers by batch | Check shear and hold times | Medium |
| Marinade pickup | Poultry and meat | Determines margin and compliance | Shift-to-shift bias | Review tumbler settings and dwell | High |
| Reject rate | Packaging | Signals hidden product loss | Step-change after changeover | Inspect setup and maintenance | Medium |
SPC is especially effective when it is tied into operator dashboards, alarms, and corrective action workflows. If charts live only in spreadsheets reviewed at the end of the week, the value is limited.
Mass Balance and Loss Tracking
Mass balance is the discipline that turns scattered production data into a reliable picture of where product is actually going. For many U.S. plants, the lack of a daily mass balance is the main reason yield losses stay hidden. When raw intake, work-in-process inventory, rework, finished output, byproduct, washdown loss, and disposal are not reconciled, the business may think it has a labor issue when it really has a transfer-loss issue or a packaging overfill issue.
A strong mass balance program usually starts at receiving and ends at shipped finished goods. It includes truck scales where practical, floor scales at batching points, tank level verification, production count reconciliation, and coded waste streams. The most useful systems assign loss categories such as startup loss, shutdown loss, trim loss, overfill, spills, QC hold, rejected packaging, and unrecoverable product in CIP.
This is highly relevant for facilities handling multiple product families or allergen changeovers. A co-packer in Chicago or Philadelphia may run short batches with frequent transitions, which makes line heel, flush volume, and startup product especially costly. A seafood processor near Seattle may see different losses in thawing, glazing, trimming, and packaging that are invisible if only final case output is tracked.
The area chart reflects the trend shift from manual reporting to integrated, real-time loss tracking. In 2026, this shift is accelerating because labor is tight and plants want fewer blind spots during changeovers and sanitation events.
| Loss Category | Definition | Best Measurement Method | Common Cause | Financial Visibility | Recovery Potential |
|---|---|---|---|---|---|
| Startup loss | Product made before stable conditions | Time-stamped first good unit | Slow ramp-up | Often underestimated | High |
| Shutdown loss | Remaining product at line stop | Heel weight and flush volume | Poor line evacuation | Medium | High |
| Transfer loss | Product retained in piping or tanks | Mass balance by tank movement | Line design issues | Low unless tracked | High |
| Overfill | Product beyond target package weight | Checkweigher data | Wide filler variation | High | High |
| Rework | Usable product returned to process | Batch and lot coding | Specification drift | Variable | Medium |
| Waste disposal | Lost product sent to drain or bins | Waste weight and COD estimates | Spills or cleaning losses | High with disposal fees | Medium |
The value of this table is that it links each loss type to a measurement method. Plants improve faster when every loss category has an owner and a calculation rule.
Waste Reduction and Byproduct Recovery
Waste reduction in 2026 is about much more than landfill diversion. In food manufacturing, the best programs convert waste streams into margin streams. That can mean edible product recovery, secondary ingredient use, animal feed channels, rendering, ingredient concentration, water reuse where permitted, or packaging redesign that reduces product trapped in the container.
By industry, opportunities vary:
- Protein: trim classification, fat recovery, bone/meal channels, drip capture, optimized deboning yields.
- Dairy: whey utilization, solids capture, separator tuning, recovery from startup and flush events.
- Sauces and liquid foods: pigging systems, tank bottom recovery, controlled rework inclusion, improved CIP sequencing.
- Prepared foods: portion scrap reuse where compliant, batter/breading management, controlled freezing and thawing losses.
Policy trends also matter. More U.S. manufacturers are setting internal waste-reduction targets because large retailers and enterprise customers increasingly request environmental metrics. Plants serving national distribution through Memphis, Jacksonville, or Inland Empire logistics networks may see stronger customer interest in food waste reporting because those customers are consolidating sustainability scorecards across their supplier base.
Good byproduct recovery begins with characterization. A plant must know whether the stream is edible, inedible but sellable, contaminated, temperature-sensitive, seasonal, or too diluted to recover economically. Recovery is a design problem as much as an operations problem. Pump selection, piping slope, line pigging, tank outlet geometry, filtration, and storage conditions all influence whether the stream can be captured profitably.
| Waste Stream | Typical Facility Type | Current Disposal Path | Recovery Option | Operational Need | Margin Effect |
|---|---|---|---|---|---|
| Protein trim | Meat and poultry | Low-value waste | Grade segregation or further processing | Sorting and cold handling | High |
| Tank heel | Sauces and dressings | Drain or flush | Pigging or heel recovery tank | Piping redesign | High |
| Whey/solids | Dairy | Wastewater load | Concentration or ingredient use | Separation technology | High |
| Off-spec liquid | Beverage-adjacent food lines | Disposal | Controlled rework stream | Traceability controls | Medium |
| Breader fines | Prepared foods | Solid waste | Reuse within controlled limits | QA rules and sieving | Medium |
| Washdown product residue | Many facilities | Wastewater | Sequenced recovery before CIP | Automation timing | Medium |
In most cases, the easiest wins come from line evacuation, better sequencing, and improved classification of what is truly waste versus what is recoverable.
Recipe Optimization and Giveaway Control
Recipe optimization is where product economics, customer expectations, and plant reality come together. Many yield losses are caused not by dramatic equipment failures but by small formulation cushions added over time to avoid complaints. Extra sweetener, excess protein inclusion, too much sauce deposition, and generous fill targets can become normalized, especially in multi-shift plants.
The right approach is not reckless tightening. It is disciplined control around declared label claims, sensory targets, process capability, and regulatory requirements. Plants should first determine whether giveaway is occurring in ingredients, moisture, portioning, or net weight. Then they should identify whether the root cause is poor metering accuracy, process variation, operator habit, or specification design.
Examples include:
- Reducing excess sauce application in frozen prepared meals while holding visual coverage targets.
- Tightening net weight at a dairy cup filler in the Northeast while remaining safely above legal minimums.
- Balancing protein and water addition in marinated poultry to meet customer specs without overusing ingredients.
- Using in-line Brix monitoring to prevent overconcentration in sweet sauces or glazes.
Buying advice here is critical for U.S. manufacturers evaluating new systems. Seek equipment that supports repeatability: accurate load cells, in-line concentration measurement, recipe management, automated valve logic, integrated checkweighers, and historian-ready data. Avoid systems that rely on operator judgment for key economic decisions when the process could be automated.
This comparison chart shows how yield performance generally improves as plants move from manual methods to integrated recipe and process control systems. The jump is especially meaningful in plants with many SKUs or ingredient cost volatility.
| Control Point | Risk if Unmanaged | Recommended Tool | Best Use Case | Monitoring Frequency | Expected Benefit |
|---|---|---|---|---|---|
| Ingredient dosing | Overuse of high-cost inputs | Loss-in-weight or load-cell batching | Sauces, dairy, prepared foods | Every batch | Lower formula cost |
| Net weight target | Package giveaway | Checkweigher feedback loop | Filling and packaging | Continuous | Rapid savings |
| Moisture retention | Inconsistent finished yield | SPC with thermal controls | Protein and baked products | Continuous | Stable output |
| Rework rate | Quality drift and hidden loss | Recipe limits in MES/SCADA | Co-packing and batch systems | Per lot | Predictable product quality |
| Portion size | Overportioning | Vision or weighing systems | Prepared meals and protein portions | Continuous | Margin protection |
| Viscosity target | Fill inconsistency | In-line sensors and batch control | Dressings and liquid foods | Per batch / continuous | Lower variation |
The table emphasizes a key point: giveaway control is not only a packaging topic. It often begins upstream in formulation, thermal process, or material handling.
Technology Solutions for Yield Gains
Technology investment in 2026 should focus on measurable yield gain, not only modernization for its own sake. The most effective technologies are the ones that close the gap between design intent and real plant behavior.
Core technologies for U.S. food facilities include:
- Advanced weighing and dosing systems
- PLC upgrades and logic refinement
- SCADA and historian integration
- In-line Brix, density, conductivity, moisture, and temperature sensing
- Automated recipe and batch management
- Checkweigher feedback loops
- Pigging systems for viscous products
- Improved CIP design that reduces product-to-drain losses
- Vision systems for portion and packaging verification
This is also where engineering partners matter. DPS service capabilities are relevant because yield projects often cross process design, utilities, controls, installation, compliance, and project management. A successful improvement may require process engineering, owner-side planning, controls integration, local trade coordination, and commissioning discipline rather than one piece of equipment alone.
On the technological side, DPS works across process, mechanical, plumbing, electrical, and controls disciplines, including PLC programming, automation, and SCADA. That matters when a plant discovers the real bottleneck is logic, sequencing, or line integration rather than machine speed. For yield, this can mean better batch control, more stable thermal profiles, more accurate dosing, improved startup logic, and tighter CIP/end-of-run transitions.
On the manufacturing side, U.S. food plants often benefit when custom tanks, CIP skids, cooking vessels, or marination systems are designed around the actual product and facility constraints. Through its own equipment offering, DPS equipment solutions can support storage, processing, and cleaning needs where standard off-the-shelf equipment would leave yield on the table due to poor fit, dead legs, recovery limitations, or oversized utility demand.
Future technology trends for 2026 and beyond include AI-assisted recipe adjustment, predictive maintenance tied to yield loss events, digital twins for process changes, energy-aware thermal optimization, and better traceability between raw material lots and final yield performance. Plants preparing for enterprise-scale growth should choose systems that can scale from one line to a multi-site data architecture.
Benchmarking and Continuous Improvement
Benchmarking matters because a plant can improve and still remain uncompetitive. U.S. manufacturers should benchmark against internal history, sister sites, peer facilities, and industry norms where available. The right benchmark set includes yield by product family, labor hours per unit, raw material loss by category, overfill cost, OEE interaction, waste disposal cost, and recovery revenue.
Start with a 90-day baseline. Then review weekly by line and monthly by facility. Separate controllable loss from structural loss. For example, thaw loss in seafood may be influenced by incoming raw conditions, while package overfill is usually highly controllable. A protein plant near Omaha and a prepared foods plant in Phoenix may need different targets, but both should use common definitions so leadership can compare performance fairly.
Continuous improvement works best when paired with a capital screen. If repeated Kaizen events point to the same design weakness, such as poor pipe routing, tank geometry, or inaccurate metering, it may be time for a scoped engineering project rather than another operator retraining cycle.
Case studies across the U.S. repeatedly show that yield gains often come from solving the true system bottleneck. In some plants, the answer is line pigging or filler feedback. In others, it is reprogramming PLC logic, changing transfer design, or right-sizing utilities. This is why capital planning should connect engineering, operations, and commercial goals from the beginning.
A disciplined partner can help here. Selected project examples from DPS show how operational understanding and capital execution can work together. For manufacturers evaluating large upgrades or relocations, benchmarking should include not only equipment cost but startup curve, utility consumption, maintainability, and first-year profitability.
When local sourcing decisions are needed, processors should compare regional fabricators, controls integrators, utility contractors, and OEMs by sanitary design experience, documentation quality, startup support, and responsiveness. Facilities near Raleigh, Chicago, Minneapolis, Houston, and Southern California often have strong supplier ecosystems, but the best local supplier is the one that fits the plant’s process risk and timeline, not simply the closest ZIP code.
Our Company
Disruptive Process Solutions, commonly known as DPS, serves food and beverage manufacturers across the United States and Canada with a business-first approach to engineering and capital execution. Learn more about DPS if your facility is evaluating yield-improvement projects, process upgrades, expansions, relocations, or integrated utility and automation work.
Rather than acting only as a conventional contractor, DPS approaches projects through its Design Build Manage model. In practice, that means the company helps define the right solution, coordinates construction and installation, and manages execution with strong accountability. For food plants, this is valuable when yield improvements involve multiple systems at once such as batching, thermal processing, packaging, utilities, controls, and sanitation design.
DPS supports a wide range of manufacturing environments in North America, including protein processing, prepared foods, sauces and dressings, dairy, aseptic systems, retort processing, co-packing, and beverage-adjacent operations. Its service capabilities span capital planning, feasibility, owner’s representation, project management, equipment integration, installation, commissioning, and compliance-aware execution for FDA, USDA, SQF, and BRC environments.
From a technological standpoint, DPS brings process engineering, automation, PLC programming, SCADA integration, and utility coordination into one project view. From a manufacturing standpoint, the company works with equipment and systems such as tanks, CIP systems, cooking vessels, marination equipment, blending and batching platforms, thermal systems, and full plant utilities. For processors under pressure to improve yield quickly, that combined capability can reduce the gap between identifying a loss and implementing the right permanent fix.
DPS is especially relevant for clients that value honest planning, rapid decision making, and profit-focused project execution. In yield work, this matters because the best answer is not always more equipment. Sometimes it is a controls change, a redesign of product flow, or a targeted utility upgrade that delivers a stronger return with less capital.
FAQ
What is a good yield improvement target for a U.S. food facility in 2026?
For many facilities, a realistic near-term target is 1% to 3% total yield improvement, with larger gains possible in high-variation processes. The best target depends on product mix, current measurement quality, and how much giveaway or hidden loss exists today.
Which industries usually see the fastest payback?
Protein processing, sauces, dressings, dairy, and co-packing operations often see fast payback because raw materials are expensive and variation directly affects sellable output. Packaging overfill alone can fund further improvements.
Should we start with software or equipment?
Start with data and root cause. If losses are caused by poor visibility, measurement, or controls, software and integration may come first. If the root cause is physical hold-up, transfer damage, or inaccurate metering, equipment changes may be needed. Many plants require both.
How often should mass balance be reviewed?
Daily review is ideal for high-volume facilities. At minimum, plants should reconcile mass balance by shift or by production day for their highest-value lines. Weekly-only review is usually too slow to capture real operational causes.
How do sustainability goals connect to yield?
Every pound of product lost represents wasted ingredients, water, energy, labor, packaging, and disposal cost. Better yield improves profitability and environmental performance at the same time, which is why sustainability reporting increasingly overlaps with yield programs.
What technologies are most important for 2026?
Integrated recipe control, in-line sensing, historian-connected SPC, checkweigher feedback, smarter CIP sequencing, AI-assisted diagnostics, and scalable automation platforms are among the most important technologies. The highest-value choice depends on the plant’s biggest loss category.
Can yield be improved without a major expansion?
Yes. Many plants gain measurable yield through better controls logic, tighter batching, improved thermal consistency, line evacuation, and reduced giveaway without adding square footage. A focused engineering assessment often finds savings before a major capital expansion is necessary.
What should buyers look for in a project partner?
Look for a partner that understands food processing economics, sanitary design, utilities, controls, commissioning, and project execution. The partner should be able to quantify the expected yield gain and challenge assumptions when a lower-cost fix can outperform a large equipment purchase.
In 2026, the U.S. plants that protect margin best will be the ones that treat yield as a strategic operating system, not a single KPI. With disciplined SPC, reliable mass balance, smarter recipe control, waste recovery, and well-targeted capital decisions, food facilities can turn operational precision into lasting financial advantage.
[/trp_language]
Complete Company Portfolio

About the Author: Disruptive Process Solutions (DPS)
The DPS team combines process engineering expertise with real-world food and beverage manufacturing experience. Our content focuses on process optimization, production efficiency, facility improvements, and practical solutions that help manufacturers operate more effectively in a rapidly evolving industry.
Share

