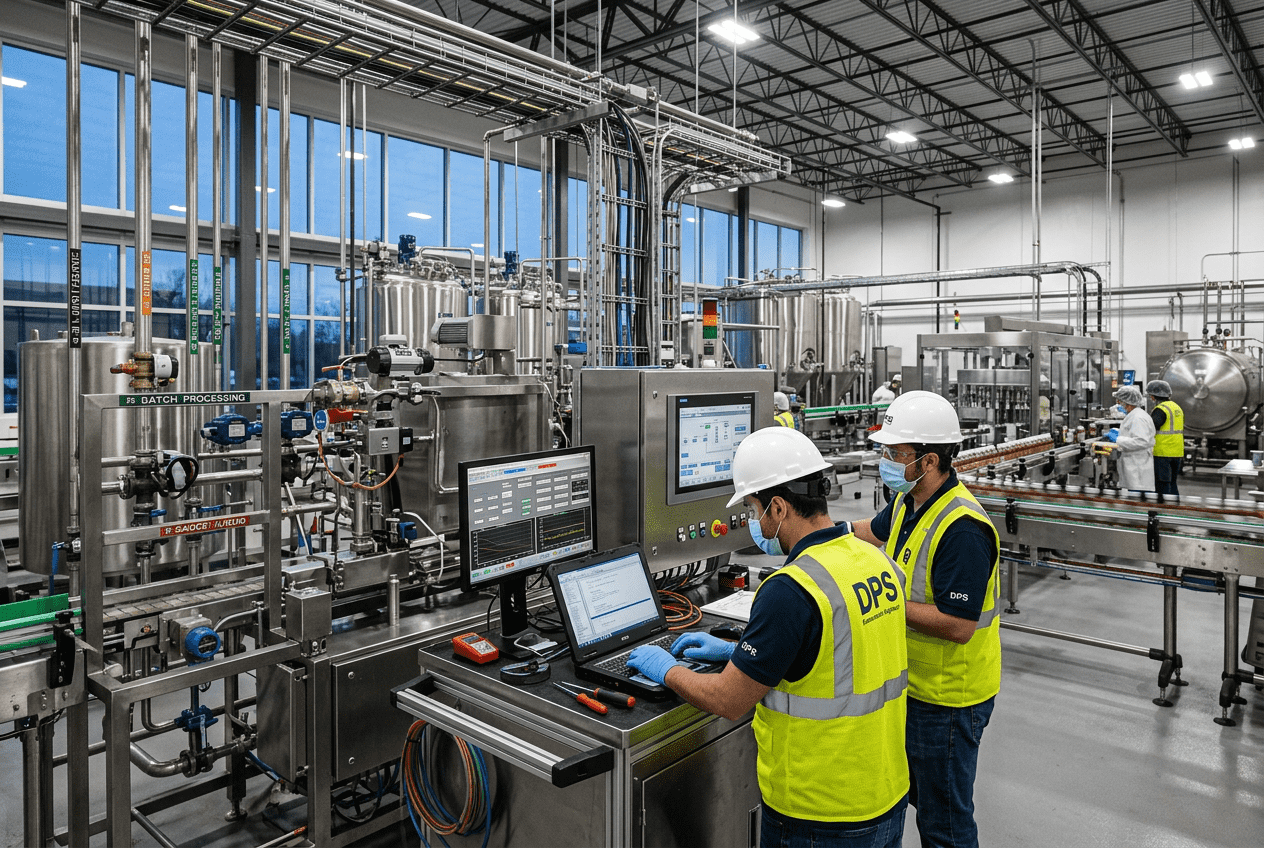
2026 Predictive Maintenance for Food Plants: IP69K Sensor Strategy Guide
[trp_language language=”en_US”]
2026 Predictive Maintenance Strategy for Food Plants in the United States
Food and beverage manufacturers in the United States are under pressure to reduce downtime, improve food safety, control labor costs, and extend asset life. In plants from the dairy corridors of Wisconsin to protein facilities in Texas, beverage co-packers in California, and prepared foods operations in the Southeast, predictive maintenance is shifting from a pilot concept to an operating requirement. The most effective programs do not begin with buying sensors for every machine. They begin with asset criticality, sanitary design, data quality, and a response path that turns alerts into action.
This guide explains how to build a practical predictive maintenance strategy for washdown-heavy food plants, with emphasis on IP69K vibration sensing for bearings, thermal imaging for electrical and motor health, oil and acoustic monitoring for gearboxes, and CMMS integration that automatically generates work orders. It also addresses 2026 trends in AI diagnostics, labor availability, sustainability reporting, and maintenance standardization across multi-site U.S. manufacturing networks.
Immediate Takeaway

The quickest and most reliable path to predictive maintenance in a U.S. food plant is to prioritize assets by Risk Priority Number, install IP69K-rated vibration sensors on the most critical rotating equipment, add thermal imaging for electrical and motor circuits, use oil analysis and acoustic monitoring for gearboxes and enclosed drives, and connect all alerts to the CMMS so technicians receive automatically triggered, priority-based work orders.
For most facilities, the best first targets are filler lines, high-speed packaging systems, pumps supporting pasteurization or CIP, refrigeration compressors, conveyors feeding critical production steps, and gearbox-driven assets in wet or caustic washdown zones. Plants near major logistics hubs such as Chicago, Dallas-Fort Worth, Atlanta, Houston, and the Ports of Los Angeles/Long Beach often feel downtime more severely because missed production immediately affects truck windows, warehouse scheduling, and customer fill rates. In those operations, predictive maintenance can pay back quickly by preventing a single major outage.
Buying advice is straightforward. Do not start with the cheapest wireless sensors or the broadest software package. Start with the asset classes that create the highest production risk, then match sensing technology to actual failure modes. Bearings need vibration and temperature trending. Motors and MCCs benefit from thermal scans and load-aware alarms. Gearboxes require lubricant health and acoustic signatures. The software layer matters only if maintenance planners can trust it and act on it.
The line chart above reflects a realistic adoption pattern seen across U.S. food and beverage manufacturing. Growth is being driven by labor constraints, insurance scrutiny around electrical reliability, and the need to maintain throughput with fewer skilled technicians. By 2026, plants that standardize detection and response are likely to outperform sites that still rely mainly on calendar-based PMs and operator-reported failures.
Asset Criticality Audit: RPN Ranking Across the Plant

Every predictive maintenance program should start with a criticality audit. In food manufacturing, the ideal method is a practical Risk Priority Number framework that combines severity, occurrence, and detectability. Severity measures production, food safety, environmental, and customer impact if the asset fails. Occurrence reflects the likelihood of failure based on operating duty, age, and conditions. Detectability evaluates how likely the plant is to catch the issue before functional failure.
A disciplined RPN exercise prevents overspending on low-impact assets while under-protecting bottlenecks. It also aligns operations, maintenance, quality, and engineering around the same language. For example, a brine pump in a protein plant may be mechanically simple but operationally critical if its failure halts an entire marination process. Likewise, a packaging conveyor may appear secondary until a study shows it starves a filler line worth tens of thousands of dollars per hour.
| Asset | Typical Area | Severity (1-10) | Occurrence (1-10) | Detectability (1-10) | RPN | Priority |
|---|---|---|---|---|---|---|
| High-speed filler motor and gearbox | Beverage packaging | 10 | 6 | 6 | 360 | Immediate monitoring |
| Pasteurizer circulation pump | Dairy/beverage thermal process | 10 | 5 | 5 | 250 | Immediate monitoring |
| Refrigeration compressor | Cold storage/utilities | 9 | 5 | 5 | 225 | High |
| CIP supply pump | Sanitation/utilities | 8 | 5 | 5 | 200 | High |
| Air compressor package | Plant utilities | 8 | 4 | 5 | 160 | Target in phase 2 |
| Primary process conveyor drive | Prepared foods/protein | 7 | 5 | 4 | 140 | Target in phase 2 |
| Secondary packaging conveyor | End-of-line | 5 | 4 | 4 | 80 | Standard PM |
| Warehouse exhaust fan | Facility support | 3 | 4 | 4 | 48 | Low |
This sample table shows why ranking matters. Plants often assume large utility assets deserve the first sensors, but the true answer depends on bottleneck economics and sanitation risk. If a filler line in New Jersey or a cook line in Arkansas is the primary revenue generator, its support assets can rise to the top of the list even when they are smaller machines.
During the audit, group assets by product family and failure mode. Include motors, pumps, reducers, conveyors, compressors, fans, agitators, homogenizers, fillers, depalletizers, case packers, boilers, refrigeration skids, and critical utility systems. Then classify each area as dry, wet, chemical washdown, hot, cold, or hygienic zone because those conditions influence sensor housing, cable routing, communication design, and maintenance access.
The bar chart highlights where demand is strongest in the U.S. market. Beverage packaging and protein processing lead because they combine high throughput, frequent washdown, and expensive unplanned downtime. Dairy follows closely because thermal process continuity and hygiene standards make failure detection especially valuable.
IP69K Vibration Monitoring for Bearing Wear

In washdown food plants, bearing-related failures are among the fastest ways to lose line uptime. Bearings fail from misalignment, lubrication breakdown, moisture intrusion, over-tensioned belts, shaft imbalance, and product or chemical contamination. Traditional route-based vibration analysis remains useful, but permanently installed IP69K vibration sensors are increasingly preferred for critical assets in wet production areas because they maintain visibility between technician rounds.
IP69K matters because many food plants use high-pressure, high-temperature washdown procedures. Standard industrial enclosures may survive dust or light splashing but degrade when exposed to daily sanitation with caustic foam, hot rinses, and aggressive cleaning protocols. Sensor housings, connectors, and cable glands should be designed for hygienic environments, not merely general manufacturing.
| Application | Failure Mode | Recommended Sensor Placement | Signal Type | Typical Alarm Basis | Food Plant Benefit |
|---|---|---|---|---|---|
| Pump bearings | Cavitation, bearing wear | Drive end and non-drive end | Velocity + temperature | RMS trend and temperature rise | Protects process flow and CIP reliability |
| Conveyor drive motors | Misalignment, imbalance | Motor frame and gearbox input | Acceleration + velocity | Spectral peaks and overall vibration | Prevents line starvation and jams |
| Fillers/cappers | Bearing fatigue | Main rotating assembly | Acceleration enveloping | Bearing fault frequency trend | Reduces costly packaging downtime |
| Agitators/mixers | Shaft looseness | Upper and lower bearing points | Velocity + waveform | Baseline deviation | Supports batch consistency |
| Refrigeration compressors | Bearing and rotor issues | Compressor housing points | Wideband vibration | Multi-band thresholds | Protects cold-chain continuity |
| High-speed case packers | Mechanical looseness | Critical bearing blocks | Acceleration | AI anomaly score + trend rate | Improves OEE at end-of-line |
The table above shows why one sensor type is not enough for every asset. In many U.S. facilities, a combination of acceleration, velocity, and surface temperature produces the best early-warning package. For simpler conveyors, overall vibration and temperature may be enough. For high-speed packaging or refrigeration compressors, spectral analysis and bearing fault frequencies deliver better insight.
Buying advice for vibration sensing should focus on survivability, mounting quality, communications, battery strategy for wireless units, and software that can distinguish process noise from mechanical deterioration. Plants in humid Gulf Coast regions such as Houston or New Orleans should pay particular attention to corrosion resistance. Facilities in upper Midwest climates may prioritize cold-start performance and sealed connectors that survive condensation cycles.
Common product types include wired continuous-monitoring nodes, wireless battery-powered sensors, hybrid devices with local edge processing, and gateway-based systems that feed SCADA, historians, or cloud analytics. Wired systems often provide stronger data density and lower latency. Wireless systems can reduce installation cost and are attractive for brownfield retrofits. The right answer depends on cable access, sanitation routing, asset criticality, and whether the site can support secure industrial networking.
Thermal Imaging for Motors, Panels, and Electrical Reliability
Thermal imaging is one of the most overlooked tools in food plant reliability because many teams treat it as an annual safety exercise instead of a continuous maintenance input. In reality, thermal data can reveal overloaded motors, loose terminations, phase imbalance, contactor degradation, failing breakers, blocked ventilation, refractory or insulation loss, steam trap issues, and uneven heating or cooling conditions around process equipment.
For electrical systems, thermal imaging is especially valuable in MCCs, VFD cabinets, panelboards, disconnects, bus connections, compressor starters, and utility distribution equipment. For rotating equipment, it helps verify whether motor surface temperatures and bearing zones are trending outside normal operating envelopes. In washdown plants, selecting the right housing and placement is essential if fixed thermal devices are used near process areas.
| Inspection Target | What Thermal Imaging Finds | Best Method | Typical Frequency | Risk if Ignored | Action Trigger |
|---|---|---|---|---|---|
| MCC buckets | Loose lugs, overloaded circuits | Handheld or fixed camera | Monthly or continuous | Arc event or motor trip | Temperature delta above baseline |
| VFD panels | Cooling failure, component stress | Fixed camera or IR window | Monthly | Unexpected drive shutdown | Hotspot at fan, bus, or module |
| Motor housings | Overload, bearing drag | Handheld route + sensor verification | Weekly | Insulation damage | Rising case temperature trend |
| Steam systems | Trap failure, insulation loss | Handheld thermal survey | Quarterly | Energy waste and process instability | Unexpected hot/cold differential |
| Boiler auxiliaries | Burner and draft abnormalities | Fixed or route-based imaging | Monthly | Efficiency loss or outage | Pattern change versus baseline |
| Refrigeration panels | Electrical loading problems | IR window inspection | Monthly | Cold-room downtime | Phase-to-phase temperature difference |
This table demonstrates how thermal imaging supports both reliability and energy management. In 2026, sustainability reporting and utility cost control will push more food manufacturers to use thermal trends not only to prevent failure but also to detect inefficiency. Steam leaks, overloaded motors, and refrigeration panel issues all show up as cost signals before they become catastrophic events.
Thermal imaging is particularly useful in plants with dense electrical infrastructure, such as beverage facilities around Charlotte, Phoenix, and Southern California, where high-speed packaging and utility concentration create thermal stress. It is also valuable in older legacy plants in the Midwest and Northeast where electrical rooms have been expanded repeatedly over decades. There, thermal baselines can reveal inherited weaknesses that are not visible on paper drawings.
Oil Analysis and Acoustic Monitoring for Gearboxes
Gearboxes remain central to mixers, conveyors, fillers, palletizers, depalletizers, and process transfer equipment. Yet many plants still rely on oil changes by calendar and audible technician judgment. A better approach combines periodic oil analysis with acoustic monitoring, especially on enclosed gear drives where surface vibration alone may not show the earliest damage patterns.
Oil analysis identifies wear metals, oxidation, viscosity drift, water contamination, additive depletion, and particle levels. Acoustic monitoring detects friction changes, micro-pitting, lubrication starvation, and the beginning of tooth distress. Together, these methods help plants intervene before gearbox temperatures rise enough to be obvious to operators.
| Gearbox Type | Common Location | Primary Failure Indicator | Recommended Monitoring | Sampling Interval | Maintenance Response |
|---|---|---|---|---|---|
| Helical inline | Packaging conveyors | Particle increase | Oil sample + vibration | Quarterly | Inspect alignment and lubricant |
| Worm gearbox | Slow-speed handling | Temperature and wear debris | Oil sample + thermal check | Quarterly | Verify load and oil condition |
| Right-angle bevel | Mixing and transfer | Acoustic spike | Acoustic + oil analysis | Monthly/quarterly | Inspect gear mesh and bearings |
| Planetary gearbox | High-torque fillers | Fine wear metals | Oil analysis + AI anomaly trend | Bi-monthly | Schedule controlled teardown |
| Reducer on palletizer | End-of-line | Lubrication starvation noise | Acoustic route monitoring | Monthly | Relubricate or repair seals |
| Sanitary washdown gearbox | Wet process areas | Water contamination | Oil analysis with moisture check | Monthly | Seal inspection and oil change |
The key lesson is that not all gearbox risk looks the same. Washdown gearboxes in poultry, seafood, and ready-to-eat areas are especially vulnerable to seal damage and water ingress. In these applications, oil condition can deteriorate long before external vibration appears severe. Acoustic data is valuable because it can detect changes in friction and impact behavior that precede conventional temperature alarms.
Food plants with export-sensitive throughput, including facilities serving the Port of Savannah or Port of Houston, often benefit from gearbox monitoring because a single packaging bottleneck can affect shipment windows and inventory freshness. In these environments, predictive maintenance is directly tied to supply-chain resilience rather than just maintenance efficiency.
CMMS Integration and Auto-Generated Work Orders from AI Alerts
Detection without workflow is one of the most common reasons predictive maintenance programs stall. Plants may install sensors, generate dashboards, and even receive AI-based anomaly alerts, but if the CMMS is not configured to convert those alerts into prioritized work, technicians remain stuck in reactive mode. The real value comes when condition-based data automatically creates tasks with the right asset tag, location, recommended action, urgency, and planner review logic.
A good integration model includes threshold rules, alert escalation, failure-mode mapping, and work-order templates. For example, a bearing vibration increase on a filler motor may create an inspection work order at the first threshold, a lubrication or alignment work order at the second threshold, and a scheduled replacement work order if fault frequencies accelerate beyond an acceptable trend slope. The system should also suppress nuisance alerts during sanitation, product changeover, or non-production periods.
| Alert Source | Condition Detected | CMMS Action | Priority Level | Assigned Team | Expected Outcome |
|---|---|---|---|---|---|
| Vibration sensor | Bearing RMS exceeds warning band | Create inspection WO | Medium | Mechanical maintenance | Validate fault and plan repair |
| Vibration sensor | Fault frequency acceleration | Create planned replacement WO | High | Planner + mechanics | Replace during scheduled stop |
| Thermal camera | Panel hotspot above delta limit | Create electrical inspection WO | High | Electrical maintenance | Retorque/repair before trip event |
| Oil analysis | Water contamination detected | Create gearbox service WO | Medium | Mechanical maintenance | Restore lubricant integrity |
| Acoustic monitor | Lubrication starvation signature | Create lubrication WO | Medium | Lubrication technician | Prevent gear damage escalation |
| AI platform | Multi-sensor anomaly cluster | Create engineering review WO | Critical | Reliability engineer | Root cause and shutdown decision |
This workflow table shows how the CMMS becomes the execution engine. The best systems integrate with existing maintenance platforms instead of forcing a separate process. When alerts generate clean work orders, the plant can measure avoided downtime, wrench time, mean time between failures, and spares consumption with much better accuracy.
In 2026, more U.S. plants will use AI not as a replacement for maintenance expertise but as a triage layer. The AI layer should rank anomalies, compare them to historical baselines, and suggest probable failure modes. Final decisions still need plant context, especially in food plants where operating schedules, sanitation windows, allergen changeovers, and quality holds influence when maintenance can intervene.
The area chart illustrates the trend shift underway in the U.S. market. Predictive programs are taking share from reactive maintenance, particularly at larger multi-site operators. Plants that combine sensors with CMMS automation and planner discipline will move faster than those treating predictive maintenance as a technology trial.
Engineering Specifications and Performance Requirements
Engineering requirements determine whether the program survives first contact with a food plant environment. For wet zones, sensors should be specified for washdown duty, corrosion resistance, and seal integrity appropriate to chemical sanitation routines. Temperature range, mounting surface quality, connector type, cable jacket chemistry, ingress protection, wireless signal path, and cybersecurity all matter. For brownfield facilities, power availability and cable routing often drive the total installed cost more than the sensor hardware itself.
Plants should document a sensor standard by asset class, not just by brand. That standard should define acceptable sampling rates, alarm logic, historian retention, network architecture, calibration expectations, and how data will be presented to technicians. If the site intends to integrate alerts with SCADA or enterprise systems, naming conventions and asset hierarchy should be cleaned up before deployment.
| Requirement Category | Minimum Guidance | Why It Matters | Best Fit Assets | Procurement Note | Commissioning Check |
|---|---|---|---|---|---|
| Ingress and washdown rating | IP69K for wet/sanitary zones | Survives high-pressure cleaning | Pumps, conveyors, fillers | Verify full assembly rating | Inspect seals after wash cycle |
| Housing material | 316 stainless where needed | Resists corrosion | Protein, dairy, seafood lines | Avoid mixed-metal galvanic risk | Confirm finish and cleanability |
| Sampling performance | Suitable for bearing fault detection | Captures early-stage defects | High-speed rotating assets | Review bandwidth and analytics | Compare with baseline run data |
| Communications | Industrial wireless or wired gateway | Reliable data transport | Plantwide critical assets | Check site interference mapping | Validate signal strength and latency |
| Cybersecurity | Role-based access and segmented network | Protects OT systems | All connected devices | Align with site IT/OT policy | Document network approval |
| CMMS interoperability | API or standard integration capability | Turns alarms into work | All monitored assets | Test workflow before full rollout | Verify work-order triggers |
These requirements are especially important when plants are evaluating local suppliers and integrators. A low-cost device may look attractive until the site realizes its connectors are not sanitation-ready, its data export is weak, or its alarm logic cannot support actionable CMMS workflows.
This comparison chart is useful during supplier selection. It does not name brands because the better question is fit-for-purpose design. Wired IP69K systems usually lead in data depth and long-term stability. Wireless platforms often win on installation speed. Thermal plus oil/acoustic packages are powerful complements when the failure modes involve electrical heat or enclosed gearbox wear rather than simple bearing degradation.
When sourcing locally, manufacturers often prefer vendors or integrators that can support plants across regions such as the Carolinas, the Midwest, Texas, and California with consistent service standards. The supplier should understand USDA, FDA, SQF, and BRC expectations, not just instrumentation. That matters when mounting hardware, cable routing, panel modifications, or washdown-area penetrations intersect with hygienic design and compliance.
Deployment Roadmap and Proven Project Practices
A practical rollout begins with one line, one utility system, or one production family rather than the whole site. The best roadmap has four phases: audit and business case, pilot deployment, workflow integration, and scale-out. During the audit, define RPN rankings, baseline downtime costs, and success metrics. In the pilot, install a limited number of sensors on high-value assets and verify that the data quality supports actionable decisions. In workflow integration, connect alarms to the CMMS, planners, and spare-parts strategy. In scale-out, standardize mounting, dashboards, and maintenance response across the rest of the plant or network.
Project best practices include involving sanitation teams early, validating wireless signal quality during production and washdown, creating separate warning and action thresholds, and training technicians on how to interpret changes rather than chase every alarm. Governance matters. Someone should own alarm tuning, sensor health checks, and monthly review of avoided failures.
Case studies across U.S. food manufacturing repeatedly show the same lesson: the strongest gains come when predictive maintenance is embedded in operations planning. A beverage co-packer near Atlanta, for example, may use vibration alerts to shift a bearing replacement into a scheduled flavor changeover rather than lose an entire weekend run. A protein processor in Kansas may use gearbox oil condition data to coordinate repairs with sanitation windows and labor availability. A dairy plant in upstate New York may use thermal scanning on motor control equipment to prevent a utility shutdown during peak seasonal output.
Future trends for 2026 and beyond include stronger AI-assisted diagnosis, more edge analytics at the device level, expanded use of machine learning for anomaly scoring, and growing interest in energy-linked maintenance indicators. Policy and customer expectations will also matter more. As sustainability reporting becomes more common, manufacturers will increasingly connect predictive maintenance to energy reduction, refrigerant containment, compressed air efficiency, and reduced scrap from process interruptions.
For large capital programs, implementation should be coordinated with broader plant modernization. If a facility is already upgrading utilities, packaging lines, controls, or sanitary process equipment, predictive maintenance infrastructure can be designed in from the beginning instead of added later. That lowers total installed cost and improves standardization.
Manufacturers that want a stronger execution model often work with engineering partners that can bridge process understanding, field installation, and integration. A full-scope partner can align sensor strategy with line design, hygienic layout, controls architecture, and project sequencing rather than treating reliability as a standalone bolt-on.
Our Company
Disruptive Process Solutions supports food and beverage manufacturers across the United States and Canada with an approach built around practical capital performance, not generic equipment sales. The company works with processors, beverage producers, co-packers, dairy operations, protein plants, aseptic facilities, and specialty manufacturers that need smarter execution from concept through startup.
From a technological capability standpoint, DPS brings process, mechanical, electrical, structural, plumbing, and controls expertise into one delivery model. That matters for predictive maintenance because sensor deployment often touches motor control centers, PLC logic, SCADA visibility, utility systems, and process equipment design at the same time. Manufacturers exploring broader plant optimization can review the company’s engineering and project capabilities on its service solutions page.
From a manufacturing capability standpoint, DPS also supports custom equipment and system integration for food and beverage operations, including tanks, CIP systems, tumblers, and process vessels. That experience helps when predictive maintenance must be designed into new equipment packages or retrofitted into existing production assets. More detail on fabricated and integrated process hardware is available through the company’s equipment offerings.
From a service capability standpoint, DPS operates through a design-build-manage philosophy that fits manufacturers needing strategic planning, owner’s representation, project execution, installation oversight, and rapid field coordination. That is especially useful for multi-site operators or fast-moving projects in regions such as North Carolina, Texas, California, and the Midwest. Companies evaluating fit, background, and operating philosophy can learn more on the about our team page, while real-world project examples can be explored in these case studies.
In predictive maintenance projects, this breadth can be valuable because success depends on more than selecting sensors. Plants often need help with asset hierarchy, line criticality, utility coordination, control integration, field installation, and execution timing so production is not disrupted. A partner with food and beverage process knowledge can usually reach a better outcome than a sensor-only vendor.
FAQ
What is the best first step for predictive maintenance in a food plant?
Start with an asset criticality audit and RPN ranking. Do not begin by blanketing the site with sensors. Identify bottleneck assets, failure costs, sanitation conditions, and maintenance response capability first.
Why are IP69K sensors important in food manufacturing?
They are designed for harsh washdown environments common in food and beverage plants. In wet areas, lower-rated devices often fail early due to high-pressure cleaning, hot water, and chemical exposure.
Should a plant choose wired or wireless sensors?
It depends on asset criticality, data requirements, and installation constraints. Wired systems are often best for continuous high-resolution monitoring. Wireless systems are often best for brownfield retrofits and broader coverage at lower installation cost.
Where does thermal imaging add the most value?
MCCs, VFDs, electrical panels, motor housings, refrigeration controls, and boiler auxiliaries are strong candidates. Thermal imaging also helps detect energy losses and ventilation issues.
Is oil analysis still relevant if vibration sensors are installed?
Yes. Oil analysis reveals wear metals, water contamination, viscosity change, and additive depletion that vibration alone may not detect early, especially in enclosed or washdown-exposed gearboxes.
How does AI help without overwhelming the maintenance team?
AI is most useful when it ranks anomalies, filters nuisance conditions, and feeds a CMMS workflow with priority-based work orders. It should support maintenance judgment, not replace it.
What ROI should a U.S. food plant expect?
ROI varies by line criticality and current downtime. In many cases, avoiding a single major outage on a filler, compressor, refrigeration asset, or pasteurization support pump can justify the first phase of deployment.
How long does implementation usually take?
A pilot can often be completed in a few months if asset lists, maintenance workflows, and network approvals are ready. Full plant standardization takes longer, especially in multi-building or multi-site operations.
Which industries benefit most?
Beverage, dairy, protein, prepared foods, aseptic processing, and high-speed packaging operations typically see the strongest value because their downtime costs and sanitation demands are high.
What will matter most in 2026?
Plants that connect predictive sensing to CMMS execution, energy efficiency, sustainability goals, and standardized capital planning will gain the most. Technology alone will not be enough; workflow and engineering discipline will decide results.
[/trp_language]
Complete Company Portfolio

About the Author: Disruptive Process Solutions (DPS)
The DPS team combines process engineering expertise with real-world food and beverage manufacturing experience. Our content focuses on process optimization, production efficiency, facility improvements, and practical solutions that help manufacturers operate more effectively in a rapidly evolving industry.
Share

