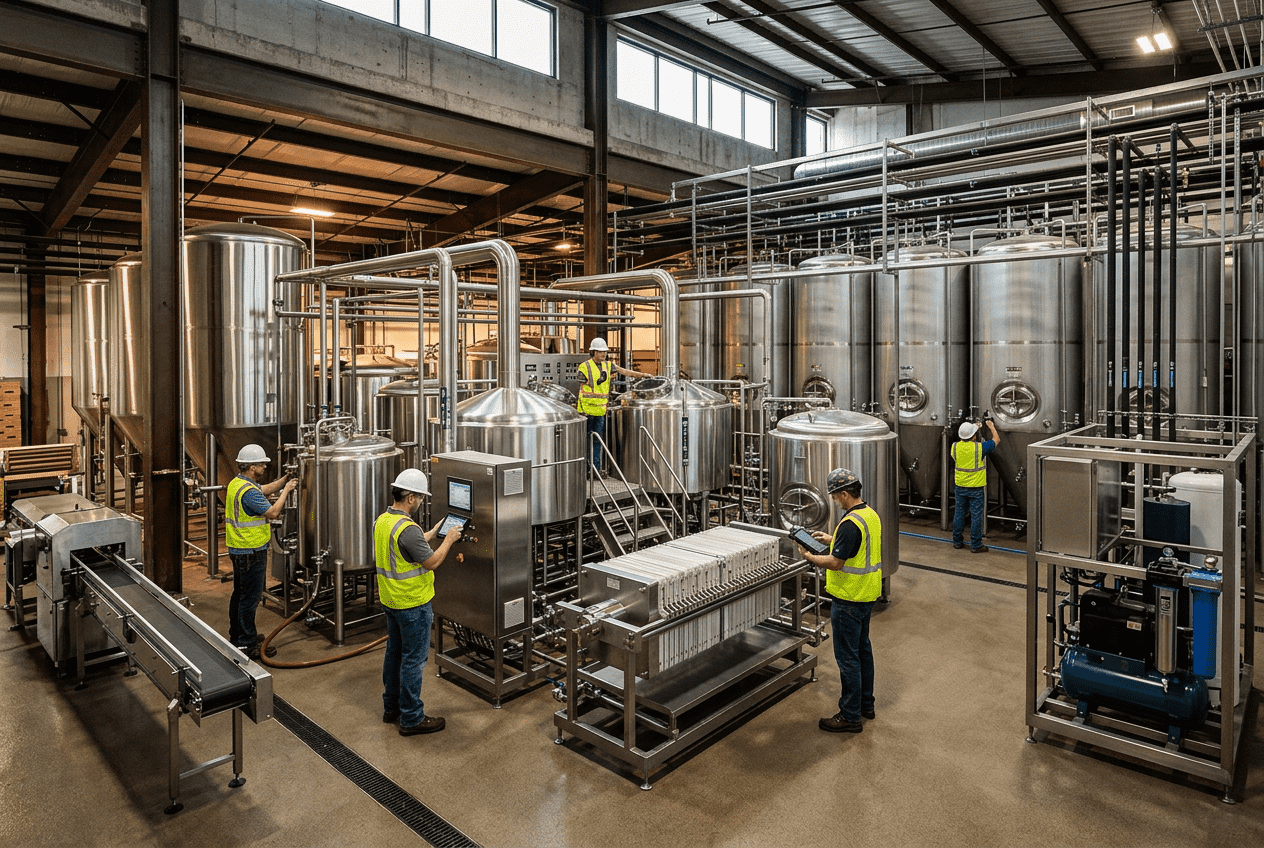
Beverage Manufacturing Capital Planning
[trp_language language=”en_US”]
Beverage manufacturers in the United States are under constant pressure to grow output, protect margins, improve reliability, and meet tighter sustainability and food safety expectations. Capital planning is where those goals are translated into projects, sequencing, budgets, and measurable business returns. In practice, strong beverage manufacturing capital planning aligns commercial demand with process capability, packaging throughput, utilities, labor, compliance, and resilience. It is not just a budgeting exercise. It is a disciplined method for deciding when to replace aging filling lines, when to expand syrup rooms, whether to add refrigeration capacity, how to stage wastewater upgrades, and which projects should move first.
Across major beverage hubs such as Chicago, Dallas, Atlanta, Los Angeles, Charlotte, and the New Jersey corridor near the Port of Newark, producers are reevaluating CapEx through a wider lens. They are no longer looking only at direct output gains. They are also asking how a project affects changeover time, sanitation performance, energy intensity, operator safety, utility constraints, warehouse flow, and future product mix. This is especially important in segments such as craft brewing, spirits, RTD cocktails, juice, dairy beverages, aseptic products, carbonated soft drinks, and functional beverages, where demand patterns can change quickly.
For manufacturers that need a practical partner, Disruptive Process Solutions approaches capital projects with a business-first mindset. Rather than forcing unnecessary spend, the company is known for identifying the true bottleneck, validating feasibility, and delivering projects through an integrated design-build-manage model. That approach is highly relevant in the United States market, where regional utility costs, local permitting, labor availability, and logistics access can materially alter the economics of a beverage expansion.
Quick Answer

Beverage manufacturing capital planning is the structured process of selecting, prioritizing, funding, and executing investments in production assets, process systems, packaging lines, utilities, automation, buildings, and compliance improvements. In the United States, it typically includes five core decisions: what the plant needs now, what demand will require later, which assets create the highest business value, what infrastructure must support those assets, and how projects should be phased to protect cash flow and operational continuity.
A strong capital plan for a beverage facility should answer the following questions directly:
- What is the real production bottleneck today: process, packaging, utilities, labor, or controls?
- What demand case is being funded: base, stretch, or strategic customer win?
- Which assets are near end of life and carry high downtime risk?
- Can water, steam, compressed air, glycol, refrigeration, and wastewater support growth?
- What is the expected payback, and what are the non-financial benefits?
- Should the investment be phased or executed at full scale?
When done well, beverage CapEx planning reduces reactive spending, avoids stranded capacity, and increases the odds that each project contributes to first-year profitability rather than creating hidden overhead.
What Is Beverage Manufacturing Capital Planning?

Beverage manufacturing capital planning is the long-range management of fixed-asset investment across process equipment, packaging machinery, utilities, plant infrastructure, controls, quality systems, and site improvements. In a beverage operation, these investments may include blending systems, bright tanks, unitanks, pasteurizers, fillers, cappers, conveyors, labelers, palletizers, CIP systems, boilers, cooling towers, ammonia or glycol systems, RO water systems, compressed air packages, wastewater treatment upgrades, and automation platforms.
The reason this discipline matters is that beverage plants are tightly interconnected. A new filler does not create value if depalletizing, syrup batching, tunnel pasteurization, case packing, chilled water, or air supply cannot support it. Likewise, adding fermentation tanks in a brewery does not guarantee sellable output if filtration, packaging windows, or cold storage become the next constraint. Capital planning therefore looks at the entire operating system rather than individual machines in isolation.
In the United States, capital planning also has to reflect local realities. A carbonated soft drink plant near Houston may have different steam economics and labor access than a co-packer in Southern California. A brewery in the Pacific Northwest may face different wastewater discharge requirements than a dairy beverage producer in the Midwest. Sites near logistics corridors such as I-85 in the Carolinas, the Inland Empire in California, or distribution nodes around Memphis and Columbus often make different packaging and warehouse investments than plants serving primarily local distribution.
For many producers, the process starts with feasibility and data collection. This is where a multidisciplinary engineering partner adds value. Through its services, DPS supports owners with capital planning, feasibility studies, owner’s representation, project management, general contracting coordination, system integration, and execution oversight. That structure is useful because beverage projects usually require alignment between process engineering, mechanical and plumbing design, electrical distribution, controls, structural support, sanitation, and commissioning.
| Capital Planning Element | Primary Question | Typical Beverage Examples | Common KPI | Risk if Ignored | Planning Horizon |
|---|---|---|---|---|---|
| Demand alignment | What volume must the site support? | RTD growth, seasonal spikes, new SKU launch | Cases per year | Underbuilt or stranded capacity | 1 to 5 years |
| Bottleneck analysis | What truly limits output? | Filler speed, CIP time, syrup room delay | OEE, line rate | Wrong project selection | Immediate to 2 years |
| Asset reliability | Which equipment is at end of life? | Old boiler, failing chiller, obsolete PLC | Downtime hours | Emergency spend | 1 to 3 years |
| Utility readiness | Can utilities support new equipment? | Water, steam, glycol, wastewater | Peak demand margin | Capacity shortfall | 1 to 10 years |
| Compliance and safety | What must be fixed regardless of ROI? | Guarding, hygienic zoning, pressure relief | Audit score | Incident or citation | Immediate |
| Strategic flexibility | Can the plant adapt to new products? | Aseptic fill, hot fill, carbonation change | Changeover time | Lost sales opportunities | 2 to 7 years |
The table above shows why capital planning is broader than maintenance replacement. It connects demand, risk, compliance, and flexibility into one investment framework.
Capital Planning Priorities for Beverage Production Facilities

Most beverage facilities should rank projects in a disciplined order instead of approving them on urgency alone. In many cases, the best sequence is to stabilize reliability first, remove the largest capacity bottleneck second, upgrade enabling utilities third, and then invest in strategic flexibility and cost optimization. This order is not universal, but it often prevents a plant from buying visible production assets before addressing hidden infrastructure limitations.
Priority setting should vary by product type:
- Breweries often focus on fermentation balance, cellar throughput, packaging uptime, and refrigeration load.
- Spirits facilities may prioritize mash handling, distillation throughput, proofing, storage, and explosion-safe electrical design.
- RTD beverage sites often need synchronized investments in batching, pasteurization, filling, can handling, and secondary packaging.
- Dairy beverage plants usually emphasize sanitary design, pasteurization integrity, refrigerated utilities, and wastewater capacity.
- Aseptic operations require a stronger focus on sterile boundaries, validation, controls, and packaging environment integrity.
DPS brings useful depth here because its team works across both beverage and food environments and supports processing systems ranging from fermentation and carbonation to pasteurization, sterilization, water treatment, and automation. On the technology side, that means the ability to connect process, utilities, controls, and plant systems rather than treating them as separate scopes. On the manufacturing side, DPS also designs and supplies selected proprietary process equipment, including tanks and CIP systems, which can simplify integration when speed and fit matter.
| Priority Tier | Project Type | Why It Ranks High | Example Trigger | Typical Benefit | Decision Note |
|---|---|---|---|---|---|
| Tier 1 | Safety and compliance correction | Mandatory for legal and operational continuity | SQF gap, unsafe access, arc flash issue | Risk reduction | Fund even without direct payback |
| Tier 2 | Reliability restoration | Reduces chronic downtime | Obsolete PLC, failing compressor | Higher uptime | Often best near-term ROI |
| Tier 3 | Bottleneck removal | Unlocks profitable throughput | Slow filler, CIP lag, packaging choke point | More sellable output | Validate full line balance first |
| Tier 4 | Utility expansion | Enables future process and packaging loads | Boiler, chilled water, wastewater nearing max | Growth readiness | Can be staged |
| Tier 5 | Strategic flexibility | Supports mix change and customer wins | Need for hot fill or new package size | Revenue optionality | Use scenario planning |
| Tier 6 | Cost optimization and sustainability | Improves margins over time | Water reuse, heat recovery, VFDs | Lower operating cost | Bundle with larger projects when possible |
This prioritization table is especially helpful for portfolio reviews because it separates projects that must happen from those that should happen if capital remains available.
The line chart reflects a realistic pattern for U.S. beverage manufacturing CapEx: steady expansion driven by automation, utility modernization, packaging flexibility, and sustainability-related projects.
Equipment Lifecycle Planning: From Filling Lines to Refrigeration Systems
Lifecycle planning is one of the most overlooked parts of beverage capital planning. Many plants continue operating aging assets until failure, especially if the equipment still “runs.” The problem is that technical life and economic life are not the same. A filler may still operate, but if parts are difficult to source, controls are obsolete, changeovers are slow, sanitation time is high, and micro-stoppages are constant, the asset may already be destroying margin.
Lifecycle planning should cover core production systems and enabling infrastructure together. In beverage plants, that usually includes:
- Blending and batching systems
- Fermentation or storage vessels
- Filtration and clarification equipment
- Pasteurizers, UHT, HTST, or flash systems
- Fillers, seamers, cappers, labelers, and packers
- CIP skids and hygienic valves
- Boilers, compressors, glycol systems, and refrigeration packages
- Electrical distribution, motor control centers, PLCs, SCADA, and historian tools
The right replacement decision often depends on four variables: downtime risk, cost to maintain, impact on performance, and compatibility with future product needs. For example, an outdated refrigeration system may not only be expensive to maintain; it may also limit tank turns and packaging schedules during peak summer demand. Likewise, an older filler may be acceptable for a narrow SKU set but become a severe constraint once slim cans, variety packs, or higher sanitation standards are introduced.
| Asset Class | Typical Lifecycle Warning Sign | Business Impact | Best Action | CapEx Timing | Comment |
|---|---|---|---|---|---|
| Filling line | Frequent jams and slow changeovers | Lost packaging hours | Upgrade or replace | 12 to 24 months | Verify upstream/downstream balance |
| Pasteurization system | Inconsistent temperature control | Quality and safety risk | Modernize controls or replace | Immediate to 18 months | Validation is critical |
| CIP system | Long cycles and poor repeatability | Reduced uptime and hygiene confidence | Redesign circuits and automation | 6 to 18 months | Often high hidden ROI |
| Boiler/steam plant | Low efficiency and outage risk | Production interruption | Rebuild or replace | 12 to 36 months | Consider redundancy needs |
| Refrigeration/glycol | Peak load shortfalls | Slow cooling and schedule constraints | Expand capacity | 6 to 24 months | Critical for brewery and dairy sites |
| Controls platform | Obsolete hardware/software | Support risk and low data visibility | Migration plan | 12 to 30 months | Pair with cybersecurity review |
The key message from the table is that lifecycle planning is not just about age. It is about the operational cost of continuing to defer action.
The bar chart shows where demand for capital projects is currently strongest: RTD, aseptic, and spirits-linked growth continue to drive utility, blending, and packaging investment.
Capacity Expansion Capital Planning: Phased vs Full-Scale Investment
One of the hardest choices in beverage capital planning is deciding whether to build for near-term demand or future scale. A phased investment model reduces initial cash outlay and may fit uncertain demand curves. A full-scale model can lower total installed cost, avoid disruption from repeat construction, and position the plant for major customer wins. The correct answer depends on market certainty, customer contracts, utility lead times, floor space, and the cost of being late.
In the United States, phased investments are common in co-packing, brewing, and emerging beverage categories where SKU volatility is high. Full-scale investment is more common when a site has anchor customers, clear regional distribution plans, or strategic access to major freight lanes and ports such as Savannah, Long Beach, Houston, or Newark.
DPS has direct experience supporting facilities designed to scale significantly over time, which is exactly where planning discipline matters. Instead of only sizing visible production equipment, the smarter approach is often to prepare the backbone infrastructure early: pad locations, utility corridors, electrical capacity, control architecture, and wastewater allowance. That prevents the second phase from becoming far more expensive than expected.
| Decision Factor | Phased Investment | Full-Scale Investment | Best Use Case | Main Risk | Planning Advice |
|---|---|---|---|---|---|
| Initial cash need | Lower | Higher | Uncertain demand outlook | Future phases cost more | Preserve expansion space |
| Speed to first production | Often faster | Can be slower | Urgent market entry | May lock in temporary compromises | Do not underbuild utilities |
| Total installed cost | Usually higher over time | Often lower overall | Stable high-growth plans | Overcapacity if demand misses | Run base and stretch cases |
| Operational disruption later | Higher during phase 2 | Lower after startup | Sites with room to expand | Future construction can hit uptime | Schedule tie-ins carefully |
| Strategic flexibility | High | Moderate | New product categories | Repeated engineering effort | Standardize modules |
| Financing fit | Better for constrained budgets | Better for long-term cost efficiency | Capital portfolio balancing | Wrong fit can hurt returns | Align with enterprise cash priorities |
This table is useful when presenting options to leadership because it makes the tradeoffs visible beyond simple sticker price.
Utility Infrastructure: Water, Steam, and Wastewater Capital Requirements
Utilities are where many beverage projects succeed or fail. Process and packaging teams may focus on production assets, but water treatment, steam, compressed air, electrical distribution, cooling, refrigeration, and wastewater are often the real gatekeepers of growth. In carbonated, brewed, dairy, and aseptic operations especially, utility shortfalls can create hidden bottlenecks long before a production line reaches nameplate speed.
Water and wastewater deserve special attention in the United States because municipal conditions vary dramatically by region. A plant in Arizona or Southern California may face water cost and scarcity pressures that change the economics of reuse systems. Facilities in the Midwest may have different discharge structures than sites in North Carolina or Georgia. Steam needs also vary by product mix, with hot-fill, pasteurization, sanitation, and thermal processing driving larger boiler and condensate requirements.
For utility-heavy projects, manufacturers should assess peak and average demand separately, identify single points of failure, and plan for 2026-era sustainability expectations. These include lower water intensity, heat recovery, energy monitoring, improved insulation, variable frequency drives, refrigeration optimization, and smarter control integration.
| Utility System | Typical Beverage Uses | Capital Drivers | Common Hidden Constraint | Future Trend Through 2026 | Planning Note |
|---|---|---|---|---|---|
| Process water | Ingredient water, CIP, rinsing | RO, filtration, storage, pumps | Pressure and peak flow mismatch | Reuse and monitoring | Match quality to application |
| Steam | Pasteurization, sanitation, heating | Boiler, feedwater, condensate return | Insufficient redundancy | Efficiency and emissions focus | Consider load diversity |
| Compressed air | Valves, packaging, controls | Compressors, dryers, receivers | Poor dew point and leaks | Energy optimization | Critical for instrument reliability |
| Glycol/refrigeration | Tank cooling, cold rooms, process cooling | Chillers, piping, pumps, vessels | Summer peak load deficit | Advanced controls and heat recovery | Model seasonal demand |
| Wastewater | Cleaning discharge, process losses | Equalization, pH control, pretreatment | Slug load events | Tighter local scrutiny | Coordinate with municipality early |
| Electrical power | All process and support systems | Service upgrade, MCCs, panels, backup | Transformer lead times | Resiliency and power quality | Start utility coordination early |
This table highlights a critical truth: utility CapEx is rarely optional if a site expects reliable expansion. It is often the enabling investment that makes process and packaging projects viable.
The area chart illustrates a realistic trend shift: a larger share of beverage capital portfolios is moving toward infrastructure, sustainability, and resilience rather than production machinery alone.
How to Build a Business Case Template for Beverage CapEx Proposals
A CapEx proposal should be easy for executives to compare across projects. The best business cases combine financial returns with operational logic and execution risk. Too many proposals focus narrowly on equipment cost and expected output without documenting assumptions, utility dependencies, labor effects, startup risk, sanitation implications, or sensitivity to demand.
A practical business case template for beverage manufacturing should include:
- Project objective and problem statement
- Current-state bottleneck or risk description
- Options considered, including do-nothing
- Scope definition with process, packaging, and utility impacts
- Capital cost, startup cost, and contingency
- Expected benefits: volume, uptime, labor, quality, energy, water, waste
- Payback, IRR, NPV, and sensitivity analysis
- Non-financial scoring: safety, ESG, customer service, resilience
- Execution timeline and outage needs
- Owner, stakeholders, and decision gates
Manufacturers often improve approval quality by using a standard scorecard. That allows a filler replacement in Ohio to be compared fairly with a wastewater upgrade in California or a syrup room expansion in Texas.
| Business Case Section | What to Include | Example Metric | Why It Matters | Common Mistake | Reviewer Question |
|---|---|---|---|---|---|
| Problem statement | Current constraint or risk | 12% packaging downtime | Creates decision urgency | Too vague | What pain is being solved? |
| Scope | Equipment, utilities, controls, building work | New filler plus air upgrade | Prevents underbudgeting | Ignoring enabling systems | What is included and excluded? |
| Cost estimate | CapEx, install, startup, contingency | $3.8M total installed cost | Supports funding decision | Using equipment price only | What is the all-in cost? |
| Benefit model | Volume, labor, quality, utility savings | +18M cans/year | Quantifies return | Unproven assumptions | What assumptions drive value? |
| Risk assessment | Schedule, supply chain, startup risk | 16-week transformer lead time | Improves realism | Ignoring outage windows | What can derail implementation? |
| Decision criteria | ROI and non-financial score | 2.9-year payback | Enables portfolio comparison | No standard ranking method | Why should this project rank now? |
The table above works well as a template foundation because it forces proposal authors to think beyond purchase price and document the full operating impact.
When organizations need support building stronger project cases, an integrated partner can help connect engineering assumptions to financial logic. That is one reason many manufacturers involve specialists early rather than after the budget is approved. From concepting through execution, DPS supports that bridge between technical feasibility and investment justification, while its equipment capabilities and integration knowledge help define realistic scope boundaries.
Non-Financial Criteria: ESG, Safety, and Resiliency in Capital Planning
Not every project should be funded only because it has the shortest payback. In beverage manufacturing, several categories deserve a formal non-financial score even when ROI appears modest. The most important are safety, quality protection, business continuity, customer service reliability, ESG performance, and resilience against utility, labor, or supply disruptions.
For example, a wastewater pretreatment project may not show the same payback as a packaging-speed upgrade, but it can protect the site’s operating license and community standing. A backup refrigeration loop may not maximize IRR, but it can prevent catastrophic product loss. A controls migration may not add visible capacity, yet it may eliminate serious cyber or obsolescence risk.
By 2026, more U.S. beverage producers will be expected to show progress on water intensity, energy performance, emissions visibility, and plant resilience. Major retailers, co-man customers, and private equity sponsors are increasingly asking for data on these issues. As a result, capital planning should explicitly score:
- Water reduction potential
- Energy reduction and heat recovery potential
- Waste minimization
- Operator ergonomics and machine safety
- Food safety and hygienic design improvement
- Backup capacity and redundancy
- Control-system supportability and cybersecurity posture
On the service side, this is where experienced owner’s representation and project management are valuable. Strong project teams keep non-financial priorities from being cut during value engineering. That discipline is central to how DPS structures project oversight and execution support for food and beverage manufacturers.
The comparison chart shows why many U.S. manufacturers prefer an integrated project model for complex beverage investments: it typically improves safety, scalability, and infrastructure coordination even if the equipment itself is not the cheapest line item.
Continuous Improvement: Dynamic Portfolio Reviews for Capital Projects
Capital planning should not happen once a year and then sit untouched. Beverage markets move too quickly for that. Ingredient costs change, customer demand changes, municipalities revise utility conditions, and equipment lead times shift. Best practice is to manage a living capital portfolio with quarterly or at least semiannual reviews.
A dynamic portfolio review should revisit:
- Demand forecast changes by category and customer
- Project estimate changes due to market pricing or lead times
- Utility and infrastructure constraints discovered after deeper study
- Operating data from completed projects
- New compliance, quality, or safety risks
- Strategic opportunities such as co-packing wins or product launches
This approach is especially useful for multi-site beverage companies in the United States. A project in the Southeast may suddenly outrank one in the Midwest if customer concentration shifts or if a utility upgrade creates a much faster path to volume. Portfolio discipline also helps organizations avoid chasing visible projects while ignoring less glamorous infrastructure needs.
Continuous improvement becomes stronger when lessons from completed work are fed back into future planning. Manufacturers should track not only whether projects were on time and on budget, but also whether the expected OEE, labor, water, or quality gains actually appeared. Real post-audit data makes future business cases more credible.
For companies seeking examples of how disciplined project execution translates to operating value, DPS shares practical experience through selected case studies. These kinds of examples matter because they show how smart capital planning often starts by identifying the real root cause rather than assuming new equipment is the only answer.
| Portfolio Review Metric | Why It Is Tracked | Review Frequency | Example Threshold | Action if Off Target | Owner |
|---|---|---|---|---|---|
| Project spend variance | Controls capital exposure | Monthly | >10% over forecast | Rebaseline or descope | Finance + PM |
| Schedule variance | Protects startup timing | Monthly | >4 weeks late | Escalate critical path | Project manager |
| Expected throughput gain | Validates business case | Post-startup | <90% of target | Root-cause review | Operations |
| Utility margin | Prevents hidden bottlenecks | Quarterly | <15% peak reserve | Advance infrastructure plan | Engineering |
| Safety/compliance score | Protects operating license | Quarterly | Audit decline | Prioritize corrective CapEx | QA/EHS |
| Portfolio strategic fit | Aligns capital with growth plan | Quarterly | Customer mix shift | Reshuffle rankings | Leadership team |
The portfolio review table shows how capital planning should remain tied to actual plant performance and strategic context, not just annual budget cycles.
In the current U.S. environment, local supplier and contractor strategy also matters. Plants in regions such as the Carolinas, Texas, the Midwest, and California often face different installation labor dynamics, code interpretations, and permitting timelines. That is why manufacturers benefit from a partner with broad North American reach but enough agility to coordinate local trades effectively. DPS operates that way, combining national beverage and food engineering experience with project-based execution tailored to site conditions.
FAQ
What is the biggest mistake in beverage manufacturing capital planning?
The most common mistake is buying visible production equipment before validating utilities, controls, sanitation, and downstream handling. Many projects underperform because the real bottleneck was elsewhere.
How far ahead should a U.S. beverage plant plan capital projects?
Most facilities should keep a 3-year actionable plan and a 5-year strategic view. Utility-intensive sites may need even longer horizons because power, wastewater, and boiler-related upgrades can have long lead times.
Should replacement projects always compete with growth projects on ROI alone?
No. Replacement projects often protect continuity, food safety, and maintenance risk. They should be evaluated with both financial and non-financial criteria.
What data should be collected before approving a capacity expansion?
At minimum: current OEE, changeover time, true bottleneck analysis, utility loading, labor model, customer demand scenarios, floor-space constraints, and startup outage requirements.
When is phased investment better than full-scale investment?
Phased investment is often better when demand uncertainty is high, capital is constrained, or product mix is likely to change. Full-scale investment is often better when demand is contract-backed and infrastructure can be built more economically once.
How important are wastewater and water systems in beverage CapEx?
They are critical. In many beverage facilities, wastewater discharge, process water quality, and peak flow conditions are the hidden constraints that determine whether growth is feasible.
What trends will shape beverage capital planning through 2026?
Expect stronger focus on automation, SCADA visibility, utility efficiency, water reuse, heat recovery, hygienic design, cybersecurity, equipment modularity, and resiliency against power and supply disruptions.
How can a manufacturer improve CapEx proposal quality quickly?
Use a standard business case template, require do-nothing and alternative options, include full installed cost and utility effects, and score projects for safety, ESG, resilience, and strategic fit along with ROI.
What types of beverage operations benefit most from integrated engineering support?
Co-packers, breweries, distilleries, dairy beverage plants, aseptic processors, and fast-growing RTD manufacturers typically benefit the most because their projects involve strong interdependence between process systems, packaging, utilities, and controls.
Why do manufacturers choose DPS for beverage capital planning and delivery?
Because the company combines technical engineering depth, practical installation and integration knowledge, and a transparent, profitability-focused approach. Rather than pushing unnecessary spend, DPS helps manufacturers identify the right investment, sequence it intelligently, and execute it with accountability.
[/trp_language]
Complete Company Portfolio

About the Author: Disruptive Process Solutions (DPS)
The DPS team combines process engineering expertise with real-world food and beverage manufacturing experience. Our content focuses on process optimization, production efficiency, facility improvements, and practical solutions that help manufacturers operate more effectively in a rapidly evolving industry.
Share

