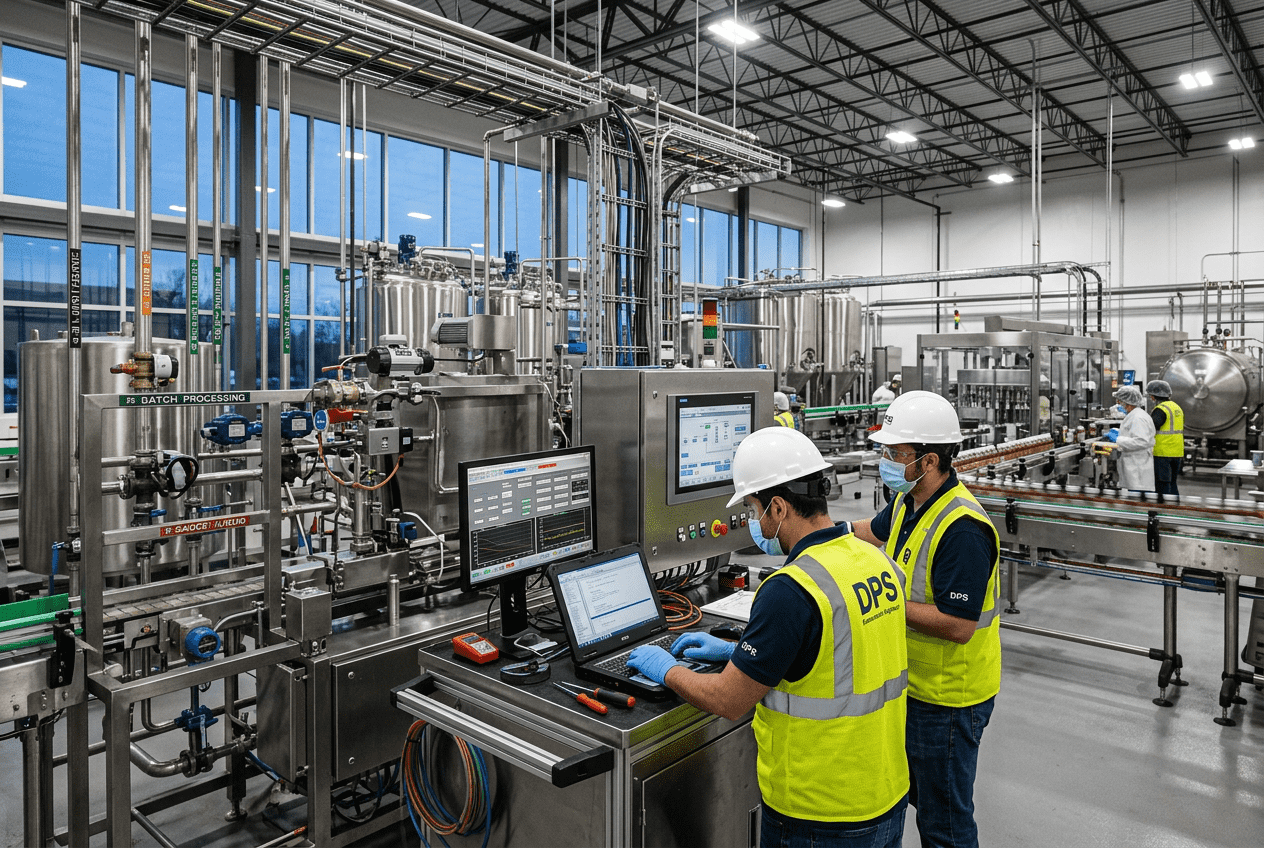
Beverage Plant Capacity Planning
[trp_language language=”en_US”]
Beverage Capacity Planning for U.S. Manufacturing Operations
Beverage plant capacity planning is the process of aligning equipment, labor, utilities, floor space, materials, and production schedules with actual and expected demand. In the United States, this means balancing seasonal peaks, retailer promotions, SKU growth, and food safety requirements while protecting margin. For beverage manufacturers, co-packers, breweries, distillers, juice processors, and ready-to-drink brands, strong capacity planning reduces overtime, avoids underused assets, improves service levels, and helps capital spending go to the real bottleneck instead of the most visible one.
Capacity planning is not only about adding a faster filler or a new tank. It includes upstream processing, syrup rooms, blending, pasteurization, utilities, CIP, packaging changeovers, warehouse flow, labor availability, and controls logic. Plants in major U.S. manufacturing and logistics corridors such as Chicago, Dallas-Fort Worth, Atlanta, Charlotte, Los Angeles, Houston, and New Jersey often face very different constraints based on freight access, utility rates, labor markets, and customer networks. Facilities shipping through the Ports of Los Angeles and Long Beach, the Port of Savannah, the Port of Houston, or inland rail hubs near Memphis and Kansas City must also plan around transportation volatility, packaging lead times, and import risk.
Quick Answer

Beverage plant capacity planning is the discipline of determining how much product a facility can reliably produce, package, and ship at the required quality and cost. The best plans look beyond nameplate speeds and use real operating data such as OEE, changeover time, labor availability, utility limits, warehouse constraints, and demand variability. In practice, a U.S. beverage plant should forecast demand by product family and channel, map every process bottleneck, compare available versus required capacity, test scenarios for peak season, and then decide whether to debottleneck, add shifts, outsource, or invest in capital equipment.
For buyers and operators, the smartest advice is simple: do not buy equipment before validating the true constraint. A filler may look slow, but the real issue may be line control logic, downstream accumulation, CIP duration, syrup room throughput, or package changeovers. That is one reason many manufacturers work with engineering partners that can evaluate processing, packaging, utilities, controls, and project economics together. Companies like Disruptive Process Solutions support this kind of integrated decision-making by tying capacity strategy to profitability rather than to equipment sales alone.
| Capacity Planning Element | What It Measures | Why It Matters | Typical U.S. Beverage Impact |
|---|---|---|---|
| Demand forecast | Expected cases, gallons, or runs | Sets baseline production requirements | Drives labor, materials, and shift scheduling |
| Line throughput | Actual units per hour | Reveals realistic output | Prevents overcommitting to customers |
| Changeover time | Minutes or hours lost between SKUs | Reduces available runtime | Critical for multi-SKU RTD and soft drink plants |
| Utility capacity | Steam, glycol, compressed air, water, power | Limits expansion even when equipment exists | Common constraint in aging facilities |
| Labor and shifts | Available operators, mechanics, sanitation | Affects sustainable output | Important in tight labor markets |
| Warehouse and shipping | Finished goods storage and dock flow | Supports order fulfillment | Essential during promotions and seasonal spikes |
The table above shows why beverage capacity planning must be cross-functional. Even if one area appears to have excess capacity, the plant performs only as well as its weakest link. A complete planning model should therefore evaluate process, packaging, labor, maintenance, utilities, and outbound logistics at the same time.
What Is Beverage Plant Capacity Planning?

Beverage plant capacity planning is the structured analysis used to determine whether a facility can meet market demand with existing assets or whether it needs changes in scheduling, staffing, outsourcing, controls, utilities, or capital equipment. In beverage operations, the term often covers both process capacity and packaging capacity. Process capacity refers to the plant’s ability to receive, blend, ferment, filter, pasteurize, carbonate, hold, and transfer product. Packaging capacity refers to filling, capping, seaming, labeling, cartoning, palletizing, and shipping.
In the U.S. market, capacity planning is increasingly important because beverage producers are dealing with faster product cycles, more channels, and more package formats. A single plant may run cans, PET, glass, bag-in-box, kegs, pouches, or aseptic formats across alcoholic and non-alcoholic SKUs. Each format affects sanitation, line speed, change parts, labor, warehouse layout, and quality verification. A facility making kombucha, functional beverages, dairy-based drinks, juices, carbonated soft drinks, and spirits-based RTDs cannot rely on one average production number. It needs capacity models by family, by line, by shift, and by season.
Well-run capacity planning also protects capital efficiency. Many operators assume the answer to growth is a bigger line, but the better solution may be system integration, a revised production sequence, improved CIP design, automation upgrades, or better material flow. This is where specialized engineering and execution teams become valuable. Through its engineering and project services, DPS works with manufacturers on processing design, utility integration, capital planning, installation, and execution management so expansion decisions are tied to real plant performance.
Capacity planning should answer six core questions:
- What demand must the plant serve by month, SKU family, package type, and customer channel?
- What is the plant’s demonstrated, not theoretical, throughput?
- Where are the bottlenecks across process, packaging, utilities, labor, and logistics?
- How much headroom exists under normal and peak conditions?
- What is the lowest-cost path to close any gap?
- What risks could make the plan fail?
| Capacity Type | Definition | Example in Beverage Plants | Common Constraint |
|---|---|---|---|
| Design capacity | Maximum theoretical output | 600 bottles per minute filler nameplate | Rarely achieved in daily operation |
| Effective capacity | Output after planned losses | Adjusted for sanitation and changeovers | Scheduling complexity |
| Actual capacity | True output based on performance data | Cases produced over a quarter | Downtime and quality losses |
| Process capacity | Upstream liquid production ability | Blending, pasteurization, tank turns | CIP and hold times |
| Packaging capacity | Downstream pack-out ability | Filling, labeling, palletizing | Changeovers and micro-stops |
| Network capacity | Plant plus co-packer and logistics support | Using outside packers during summer peaks | Freight and quality alignment |
This framework matters because many capital projects fail when managers compare demand to design capacity instead of to actual sustainable capacity. The explanation behind the table is straightforward: the only capacity number that matters commercially is the amount of quality product the plant can repeatedly make and deliver on time.
Beverage-Specific Capacity Challenges: Seasonality and SKU Proliferation

Beverage plants face distinct planning pressures compared with many other food sectors. Two of the biggest are seasonality and SKU proliferation. Seasonality affects nearly every beverage category in the United States, but not in the same way. Carbonated soft drinks and bottled water often peak in hot weather, especially across the Sun Belt, Florida, Texas, Arizona, and Southern California. Spirits and wine may see spikes around holiday buying patterns. RTD cocktails can jump around summer events and retailer resets. Sports drinks and functional beverages are influenced by weather, promotions, and regional distribution wins. Dairy-based beverages can see different spikes around school cycles and foodservice demand.
SKU proliferation is the second major challenge. Flavor extensions, pack-size complexity, limited-time launches, club-store formats, and channel-specific labels all eat into line efficiency. A plant that once ran a few high-volume SKUs may now manage dozens or hundreds. Each change creates lost time for rinsing, labeling, coding, recipe changes, quality checks, and material staging. Plants serving both e-commerce and retail also deal with different ship configurations and case packs.
Seasonality and SKU growth interact in harmful ways. Peak demand usually arrives when operators are running the widest mix. That means the plant needs more flexibility exactly when efficiency is already under pressure. This is why production planning in beverage environments should group products by allergen profile, package type, carbonation, fill temperature, or change-part commonality. Sequencing runs intelligently can recover more capacity than simply forcing overtime.
U.S. beverage operators also face geographic factors. Facilities in the Midwest may build inventory ahead of winter storms. Plants in hurricane-prone Gulf and Southeast regions must plan for utility interruptions and inbound delays. West Coast operations may adjust for import packaging risk through Los Angeles or Oakland. Northeast facilities often manage tighter warehouse footprints and freight costs into dense urban markets such as New York, Boston, and Philadelphia.
| Challenge | How It Shows Up | Operational Consequence | Recommended Response |
|---|---|---|---|
| Summer seasonality | Rapid demand spike for cold beverages | Overtime, expedited materials, stockouts | Pre-build inventory and secure co-packing options |
| Holiday demand | Spikes in gifting, spirits, and premium packs | Packaging shortages and dock congestion | Lock supplier commitments early |
| SKU proliferation | More labels, flavors, and pack sizes | Lower line efficiency | Group runs and simplify change parts |
| Promotional volatility | Retail feature weeks and club packs | Short-notice schedule disruption | Use scenario planning and frozen windows |
| Ingredient variability | Imported flavors, sweeteners, cans | Schedule shifts and substitution risk | Dual-source and buffer critical materials |
| Utility limitations | Steam, glycol, air, water constraints | Hidden production ceiling | Model utilities in all expansion plans |
The explanation here is practical: beverage plants do not lose capacity only because machines run slowly. They lose capacity because the product portfolio, commercial calendar, and supply chain force more interruptions into the schedule. Better planning reduces those interruptions before capital is spent.
Demand Forecasting Methods for Beverage Production Planning
Demand forecasting is the starting point for good capacity planning. If the forecast is flawed, the plant will either carry too much cost or miss customer orders. For beverage manufacturing, the most useful approach combines statistical forecasting with commercial intelligence. Historical data alone is not enough because beverage demand often shifts due to promotions, weather, distribution gains, retailer resets, sports calendars, and new product launches.
Most U.S. beverage producers should forecast at multiple levels: category, SKU family, package format, region, and customer channel. For example, a national RTD brand may need one forecast for the Southeast grocery channel, another for club stores in Texas and California, and another for on-premise or convenience channels. The planning horizon should also be layered: 18 to 24 months for capital needs, 3 to 12 months for labor and procurement, and weekly or daily planning for sequencing and finite scheduling.
Common forecasting methods include moving averages, seasonal indices, regression models, collaborative planning with sales teams, and demand sensing based on near-real-time order flow. Weather-adjusted forecasting can be particularly valuable for water, energy drinks, and carbonated beverages. Event-based forecasting helps brands prepare for major sports events, holidays, or chain promotions. For new products with limited history, planners often use analog forecasts based on similar launches.
The key is not choosing one perfect method. It is creating a forecast process that gets smarter over time and feeds directly into production planning, procurement, staffing, and inventory strategy. Data from ERP and MES systems should be compared with actual line performance so the business learns where the plan consistently breaks down.
| Forecast Method | Best Use Case | Strength | Limitation |
|---|---|---|---|
| Moving average | Stable, mature SKUs | Simple and quick | Poor at capturing sudden market shifts |
| Seasonal index | Weather-driven beverages | Reflects recurring peaks | Needs good history |
| Regression analysis | Demand linked to price or weather | Explains drivers | Can be data-heavy |
| Sales collaboration | Promotions and retail programs | Adds market reality | Can be biased |
| Demand sensing | Short-cycle, volatile products | Fast response to changes | Requires better systems integration |
| Analog launch model | New SKUs with little history | Useful for innovation planning | Depends on selecting the right comparison |
This table shows that different beverage categories need different forecast tools. The explanation is that production planning becomes more reliable when statistical data and commercial knowledge are blended instead of treated as competing sources.
Lead, Lag, and Match Strategies in Beverage Capacity Planning
When demand is expected to grow, beverage manufacturers usually choose among three core capacity strategies: lead, lag, and match. A lead strategy adds capacity before demand fully arrives. This is common when a brand has strong customer commitments, wants faster market entry, or sees strategic value in extra flexibility. A lag strategy waits until demand is proven before investing. This lowers short-term risk but can lead to lost sales and service issues. A match strategy adds capacity in smaller steps as demand develops, balancing risk and responsiveness.
In U.S. beverage manufacturing, the right choice depends on product shelf life, channel pressure, capital availability, utility readiness, labor access, and co-packing options. A national functional beverage launch may justify a lead approach if shelf life is adequate and retailer authorizations are secured. A regional craft beverage brand may prefer a lag strategy to preserve cash. A co-packer scaling from 20 million to 80 million cases may use a match strategy through modular utilities, phased tanks, expandable syrup rooms, and flexible packaging lines.
Buying advice is especially important here. If your plant is under pressure, do not assume a new line is the only path. Ask whether the gap can be closed through debottlenecking, controls optimization, revised scheduling, warehouse redesign, added accumulation, or a second shift. If a capital project is needed, it should fit a phased growth plan with defined trigger points. That is how smart capital meets smart manufacturing: expansion should happen when economics, operations, and market demand align.
| Strategy | Description | Best For | Main Risk |
|---|---|---|---|
| Lead | Add capacity before demand fully materializes | Fast-growing national brands | Underutilized assets |
| Lag | Wait for demand proof before investing | Cash-constrained or uncertain markets | Stockouts and lost accounts |
| Match | Expand in smaller planned increments | Co-packers and diversified portfolios | Complex project staging |
| Outsource bridge | Use co-packing during peaks | Seasonal demand surges | Margin dilution and quality oversight |
| Debottleneck first | Optimize existing plant before expansion | Plants with hidden inefficiencies | Benefits may be overestimated |
| Hybrid network | Combine internal and external capacity | Multi-region distribution models | Coordination complexity |
The value of this comparison is that strategy should match business context. A premium spirits RTD producer in Nashville or Louisville may have different needs than a high-volume soft drink co-packer in Texas or a juice processor in California’s Central Valley. One planning model does not fit all.
Bottling Line Capacity: OEE, Throughput, and Changeover Optimization
Packaging lines are where many beverage capacity plans succeed or fail. Operators often cite filler speed, but true line capacity depends on the balance of every machine from depalletizer to palletizer, as well as product flow, changeover routines, maintenance practices, and operator response. The most effective measurement is OEE, which combines availability, performance, and quality. OEE gives a more complete view of what the line can actually deliver over time.
Throughput should be measured by SKU family, package type, and shift. A can line may perform well on one high-volume energy drink but poorly on a specialty slim-can product with complex cartons. Glass lines may be limited by label application or packer speed. Aseptic lines may be constrained by sterilization, environmental controls, or package supply. In many facilities, the hidden issue is changeover optimization. Ten small improvements in setup, sanitation, material staging, and automation can unlock more capacity than one large equipment purchase.
Best practices include SMED-style setup reduction, standard work, pre-staged components, automatic recipe loading, quick-connect utilities, better line accumulation, digital downtime tracking, and packaging family rationalization. Controls and SCADA upgrades can also improve recovery from faults and reduce operator variation. Manufacturers looking for integrated solutions often review available process and equipment capabilities alongside line performance data to decide whether to modify existing assets or install new ones.
| Metric | Formula or Meaning | Target Use | Typical Improvement Lever |
|---|---|---|---|
| Availability | Runtime divided by planned production time | Track downtime losses | Maintenance and faster fault recovery |
| Performance | Actual speed versus ideal speed | Measure speed losses | Micro-stop reduction and balancing |
| Quality | Good units divided by total units | Track defects and rework | Better process control and inspection |
| OEE | Availability x Performance x Quality | Overall line effectiveness | Cross-functional continuous improvement |
| Changeover time | End of last good unit to first good unit of next run | SKU flexibility planning | SMED and standard kits |
| Cases per labor hour | Output divided by staffing hours | Labor productivity | Automation and crew design |
The explanation for these metrics is simple: capacity planning needs measurements that reflect real manufacturing behavior, not assumptions. Plants that track OEE and changeovers at a detailed level can forecast production commitments with much higher accuracy.
Workforce and Shift Planning for Beverage Manufacturing
Labor is one of the most underestimated components of beverage plant capacity planning. A line may have the mechanical ability to run another shift, but the plant may not have enough trained operators, quality technicians, maintenance staff, forklift drivers, sanitation workers, or supervisors to support it. In many U.S. regions, especially around fast-growing manufacturing corridors in the Southeast and Southwest, labor availability has become a strategic constraint.
Workforce planning should include core staffing by line, relief coverage, overtime thresholds, maintenance windows, sanitation turnaround, and onboarding time for new employees. Plants with complex products or regulated processes should also factor in training for food safety, allergen control, alcohol compliance where relevant, and automation interfaces. Flexible labor models can help during peak periods, but they work only if standard work and operator support systems are strong.
Shift structure affects capacity, cost, and equipment care. A traditional two-shift model may be enough for stable demand, while a three-shift or 24/7 schedule may be justified during summer peaks or for high-volume co-packers. Some facilities use weekend crews or seasonal staffing. Others rely on planned downtime blocks for preventive maintenance. The right answer depends on demand pattern, labor market, and equipment reliability.
For beverage companies evaluating plant expansion or a new facility, local labor conditions should be weighed as heavily as tax incentives or utility rates. A plant near Charlotte, Indianapolis, Phoenix, or Dallas may offer strong logistics access, but wage competition and technician availability still shape long-term effective capacity.
Integrating Capacity Planning with ERP and MES Systems
Capacity planning becomes much more accurate when it is integrated with ERP and MES systems. ERP typically manages demand, inventory, purchasing, orders, and financial planning. MES manages production execution, quality checks, downtime, and real-time plant data. When these systems are linked, planners can compare forecasted demand with actual runtime, material availability, and labor performance.
For beverage manufacturers, this integration supports better scheduling of formulas, tanks, fillers, and package materials. It also helps plants see where service failures start. For example, if sales commits a retailer promotion without visibility into changeover losses, the schedule may collapse. If ERP shows enough cans on hand but MES reveals a utility bottleneck on the line, the output plan will still fail. Integration solves these disconnects by creating one operational truth.
Technological capability matters here. DPS supports beverage projects with process, mechanical, electrical, controls, and automation expertise, including PLC programming, SCADA, utility integration, and system coordination. That matters because digital planning tools are only useful when they reflect actual plant design and equipment behavior. In practical terms, strong system integration can connect recipe and batch control, CIP timing, line performance dashboards, and capital planning decisions so managers act on better information.
Plants should aim for a data structure that includes the following: actual line rates by SKU, planned and unplanned downtime categories, utility usage by process area, labor by shift, material usage variance, and quality loss data. With that information, planners can build more realistic finite schedules and improve forecast confidence.
Scenario Planning: What-If Analysis for Demand Fluctuations
Scenario planning is one of the best tools for beverage capacity management because demand rarely follows a perfect baseline. What-if analysis lets operators test how the plant would respond to a 20 percent summer increase, a lost customer, a late can shipment, a utility outage, a new line startup, or a major retail authorization. This approach is especially useful for co-packers, multi-brand plants, and facilities with heavy promotional calendars.
A strong what-if model should include at least four scenarios: base case, upside demand case, downside case, and disruption case. More advanced models may separate pricing-driven volume shifts, geographic expansion, labor shortage risk, and packaging supply interruptions. The goal is not to predict the future exactly. The goal is to create pre-approved responses so management does not improvise under pressure.
Manufacturing capability and project execution also matter in scenario planning. DPS supports beverage manufacturers across North America with end-to-end facility and process work that can include blending and batching systems, pasteurization, carbonation and bright tank systems, aseptic solutions, water treatment, CIP, utility infrastructure, proprietary tanks, and integrated installation. That breadth is valuable in scenario planning because many capacity changes are interconnected. A new filler may require more compressed air, more chilled water, different tank turns, revised CIP sequencing, and a warehouse layout change.
Case-based learning can sharpen scenario planning. In one example from DPS’s operating philosophy, a client was preparing for a multimillion-dollar capacity project aimed at a modest output increase. Analysis showed that PLC programming limitations, not major hardware, were the true bottleneck. After reprogramming, the plant achieved significantly more output without the original capital spend. This illustrates a critical lesson for beverage producers: test the system before buying the headline asset. More examples of project execution approaches can be explored through DPS project case studies.
| Scenario | Trigger | Likely Plant Effect | Prepared Response |
|---|---|---|---|
| Summer demand surge | Heat wave and retail promo | Finished goods shortages | Pre-build top SKUs, reserve weekend labor |
| New national account win | Large grocery authorization | Need for more line time and materials | Match strategy and phased debottlenecking |
| Can shortage | Supplier delay at port or mill | Forced schedule changes | Dual-source packaging and safety stock |
| Utility outage | Boiler or compressor failure | Production stop or reduced speed | Redundancy planning and preventive maintenance |
| Labor shortage | Turnover or local hiring pressure | Reduced shifts | Cross-training and automation priorities |
| Demand softening | Customer loss or pricing pressure | Underutilized assets | Delay capital, use hybrid capacity model |
The explanation behind scenario planning is that resilience is now part of capacity. A plant is not truly capable if it performs only in perfect conditions. U.S. beverage manufacturers need plans that work under volatility in labor, freight, demand, packaging, and utilities.
FAQ
What is the biggest bottleneck in beverage plant capacity planning?
The biggest bottleneck is often not the machine with the lowest nameplate speed. It is usually the system constraint that most limits flow, such as changeovers, CIP duration, tank availability, utility capacity, controls logic, or labor coverage.
How often should a beverage plant review capacity?
At minimum, monthly for S&OP or integrated business planning, weekly for scheduling, and immediately when a major customer change, line issue, or new SKU launch occurs.
How do U.S. co-packers approach capacity differently?
Co-packers usually need more flexible planning because they manage many customers, more frequent changeovers, and higher schedule volatility. They often rely on match strategies, modular utilities, and broader scenario planning.
Should we add a new bottling line or improve the one we have?
Start with a debottlenecking study. If OEE, changeovers, controls, material flow, or utilities are the real issue, improving the existing line may create capacity at lower cost and with less disruption.
What systems should be connected for better capacity planning?
At a minimum, ERP, MES, quality systems, maintenance systems, and line performance data. The more these systems share data, the more realistic the production plan becomes.
How do sustainability and policy trends affect 2026 planning?
By 2026, more U.S. beverage plants are expected to prioritize water reuse, energy management, lightweight packaging, traceability, and resilient utility infrastructure. State-level packaging policies, retailer ESG expectations, and pressure to reduce waste will increasingly influence capacity design. Flexible systems that reduce water, product loss, and energy per case will support both margin and compliance goals.
What product types need the most detailed capacity planning?
Aseptic beverages, carbonated beverages, dairy-based drinks, fermented products, RTD cocktails, and high-mix functional beverages usually need the most detailed planning because they combine strict process requirements with complex packaging and sanitation needs.
How do local suppliers fit into the planning process?
Local and regional suppliers can improve responsiveness for installation trades, maintenance support, fabricated components, and utilities work. However, critical process systems should still be designed around performance, sanitation, compliance, and long-term integration, not just proximity.
What should buyers ask before approving a capital project?
Ask what the verified bottleneck is, what throughput was proven with current assets, what utilities are required, how labor changes, what the payback assumptions are, how the line handles future SKUs, and whether phased expansion is possible.
Why do beverage manufacturers use integrated engineering partners?
Because capacity planning touches process design, packaging, controls, utilities, compliance, installation, and project management. An integrated partner can align technical design with commercial goals and reduce the risk of solving the wrong problem.
In summary, beverage plant capacity planning in the United States is both an operational and strategic discipline. It affects growth, customer service, labor stability, capital efficiency, and profitability. The most successful manufacturers treat capacity as a system, not a single machine speed. They forecast carefully, measure actual performance, integrate plant data, test scenarios, and invest only after the true bottleneck is understood. For organizations seeking that level of rigor, an engineering-led partner with process, manufacturing, and execution depth can make the difference between expensive expansion and profitable expansion.
From a service capability standpoint, DPS operates as a design-build-manage partner for food and beverage manufacturers across the U.S. and Canada, supporting capital planning, feasibility, owner representation, project management, general contracting where licensed, equipment integration, and execution oversight. That model is useful for beverage companies because capacity planning often moves from analysis to installation to commissioning quickly, and continuity across those phases reduces project risk.
[/trp_language]
Complete Company Portfolio

About the Author: Disruptive Process Solutions (DPS)
The DPS team combines process engineering expertise with real-world food and beverage manufacturing experience. Our content focuses on process optimization, production efficiency, facility improvements, and practical solutions that help manufacturers operate more effectively in a rapidly evolving industry.
Share

