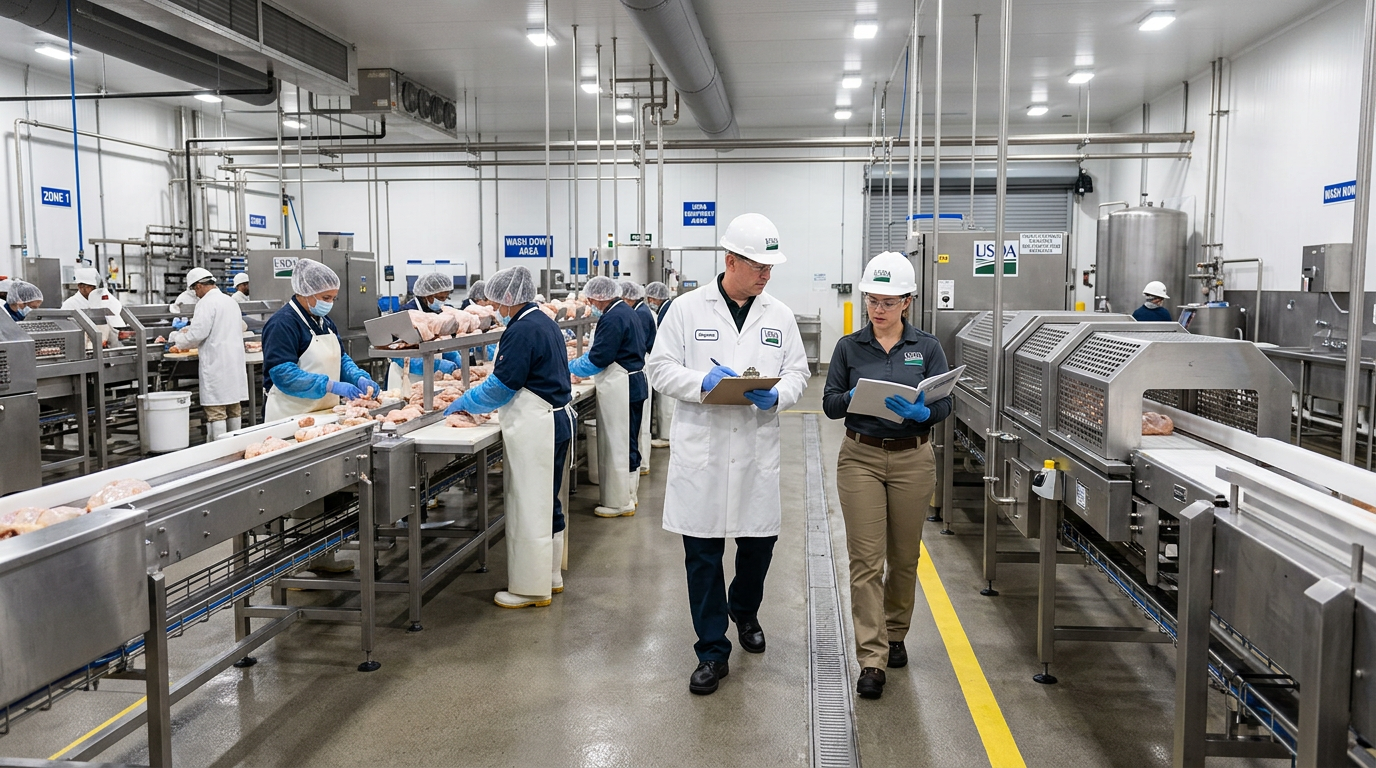
Food Facility Equipment Reliability Engineering
[trp_language language=”en_US”]
Food Equipment Reliability Strategy in the United States
Food facility equipment reliability engineering is the discipline of making processing, packaging, utility, and sanitation systems run safely, consistently, and profitably with fewer failures. In the United States, where food and beverage plants operate under strict production schedules, retailer service expectations, and FDA or USDA compliance pressures, reliability is not just a maintenance topic. It is a production, quality, safety, labor, and capital planning strategy. A dependable plant protects throughput, reduces waste, supports food safety, stabilizes labor scheduling, and improves return on investment for every line, utility skid, tank farm, filler, retort, cooker, pasteurizer, compressor, boiler, conveyor, pump, and CIP circuit.
For manufacturers operating in major hubs such as Chicago, Dallas, Atlanta, Los Angeles, Fresno, Milwaukee, Charlotte, Houston, and the New Jersey corridor near Port Newark and Philadelphia distribution lanes, equipment downtime can quickly create missed shipments, spoiled product, overtime, and customer penalties. Reliability engineering helps leadership decide what equipment matters most, what failure modes create the largest business risk, and what maintenance tactics actually produce higher uptime. This article explains how U.S. food and beverage manufacturers can apply reliability-centered maintenance principles, equipment criticality assessment, failure mode and effects analysis, mean time between failures optimization, redundancy planning, condition monitoring technologies, and practical reliability KPIs.
Quick Answer

The quickest answer is this: food facility equipment reliability engineering improves plant uptime by identifying critical assets, understanding how they fail, selecting the right preventive and predictive maintenance tasks, and designing backup capacity where shutdown risk is unacceptable. In the United States market, the most effective reliability programs usually combine five actions:
- Rank assets by business criticality, not by replacement cost alone.
- Perform failure mode and effects analysis on bottleneck equipment and utilities.
- Track MTBF, MTTR, planned maintenance compliance, OEE impact, and spare parts readiness.
- Install condition monitoring tools on high-risk rotating and thermal assets.
- Design redundancy for utilities and production functions where one failure can halt the plant.
For food and beverage facilities, the biggest reliability gains often come from utilities and controls rather than the most visible process equipment. A single PLC issue, compressed air failure, valve cluster malfunction, glycol outage, or CIP gap can stop production across multiple lines. That is why reliability engineering must connect maintenance, operations, sanitation, quality, engineering, and finance. Plants that treat reliability as a site-wide operating system usually outperform plants that view it only as a wrench-turning function.
When leadership is evaluating upgrades, expansions, line relocations, or new greenfield builds, reliability planning should begin before equipment is purchased. This includes design review for maintainability, access, sanitation compatibility, instrumentation strategy, utility resilience, controls architecture, and spare part standardization. That front-end work typically lowers lifecycle cost far more effectively than reactive maintenance after startup.
| Reliability Focus Area | Typical Plant Problem | Business Impact | Best First Action | Primary Owner | Expected Benefit |
|---|---|---|---|---|---|
| Critical assets | Too many work orders, no prioritization | Delayed repairs on bottlenecks | Asset criticality ranking | Engineering and operations | Better maintenance focus |
| Failure analysis | Repeat breakdowns | Waste, scrap, missed orders | FMEA on top loss equipment | Reliability team | Rooted corrective actions |
| Utilities | Boiler or air system interruptions | Plant-wide shutdowns | Redundancy review | Facilities engineering | Lower systemic risk |
| Maintenance planning | Reactive scheduling | Overtime and part shortages | PM and parts optimization | Maintenance planner | Higher wrench time |
| Condition monitoring | Unexpected bearing or seal failures | Line stoppages | Vibration and thermal monitoring | Reliability engineer | Early defect detection |
| Controls reliability | Nuisance trips and logic constraints | Hidden capacity loss | PLC and SCADA audit | Automation engineering | Capacity recovery |
The table above shows why reliability engineering should not be reduced to a maintenance checklist. Each area ties directly to cost, output, and customer service. Plants in high-volume categories such as dairy, protein, RTD beverages, sauces, frozen meals, and aseptic products often see the fastest payback from structured reliability work because downtime cascades through sanitation windows, changeovers, and cold-chain constraints.
Reliability-Centered Maintenance Principles

Reliability-centered maintenance, or RCM, asks a simple but powerful question: what maintenance strategy is appropriate for each asset based on how it fails and what happens when it fails? In U.S. food plants, that matters because not every machine deserves the same inspection frequency, not every component should be replaced on a calendar basis, and not every failure can or should be prevented. Some failures are age-related, some are random, some are operational, and some are caused by cleaning practices, product chemistry, startup routines, or utility instability.
A strong RCM program in food manufacturing usually starts with these principles:
- Define the function of the asset in operational terms.
- Identify functional failures that prevent the asset from meeting production, quality, or food safety requirements.
- List likely failure modes.
- Evaluate the consequences of each failure.
- Select the most technically and economically appropriate maintenance task.
- Allow safe run-to-failure only when consequence is low and recovery is manageable.
For example, a homogenizer in a dairy plant, a retort in a shelf-stable foods facility, or a filler in a beverage plant has different reliability consequences than a low-risk warehouse fan. The first group may require detailed inspection intervals, oil analysis, seal monitoring, thermal checks, and critical spares. The second may be suitable for simpler preventive maintenance or controlled run-to-failure. This distinction protects maintenance budgets from being spread too thin.
RCM also supports buying advice. When selecting new process systems, manufacturers should compare not just capacity and purchase price, but also hygienic design, cleanability, access for maintenance, instrumentation quality, OEM support, controls transparency, standard motor and gearbox availability, and ease of integration with CMMS and SCADA. Plants that overemphasize low initial cost often inherit expensive downtime later.
In many U.S. facilities, one of the most common RCM mistakes is over-maintenance. Bearings get replaced too early, instruments are calibrated too often without risk basis, and PM routes consume labor without reducing failures. Another common mistake is under-maintaining utilities because they are less visible than process lines. Yet boilers, chilled water, refrigeration, glycol, compressed air, RO, wastewater, and CIP are often the true backbone of reliability.
The line chart reflects a realistic directional trend: U.S. spending on reliability programs is rising as plants automate more heavily, labor remains constrained, and customers expect better service levels. By 2026, more companies are expected to combine maintenance planning with digital condition monitoring, energy management, and production intelligence.
Equipment Criticality Assessment

Equipment criticality assessment helps a plant determine where to focus engineering time, maintenance hours, capital reserves, and spare parts. In food and beverage environments, criticality should be based on consequence, not emotion. The loudest machine on the floor is not always the most important asset. A modest utility skid may have a far larger impact than a large visible process vessel.
A practical criticality model for U.S. plants scores assets across six dimensions: safety, food safety, regulatory impact, production throughput, quality risk, and repair recovery time. Many facilities also include part lead time and detectability. A valve island with a 16-week lead time may deserve a higher criticality score than expected if one failure can stop a filler or CIP sequence.
| Asset Type | Safety Consequence | Food Safety Consequence | Throughput Impact | Recovery Time | Typical Criticality |
|---|---|---|---|---|---|
| Boiler system | High | Medium | Very high | High | Critical |
| Compressed air system | Medium | Medium | Very high | Medium | Critical |
| Primary filler | Medium | High | Very high | Medium | Critical |
| CIP supply skid | Low | Very high | High | Medium | Critical |
| Secondary conveyor | Low | Low | Medium | Low | Moderate |
| Warehouse exhaust fan | Low | Low | Low | Low | Low |
This type of matrix allows management to separate must-protect assets from convenience assets. It also guides the right level of spare parts. A plant near major logistics centers like Memphis, Kansas City, or the Inland Empire may have better access to regional distributors, but relying on same-day supply is still risky for custom controls, sanitary pumps, specialty valves, and imported drives. Criticality analysis should therefore influence local supplier strategy and stocking policy.
Buying advice also changes by sector. In protein processing, sanitation-driven wear, washdown exposure, and cold-room conditions elevate reliability needs for motors, drives, scales, slicers, and conveyors. In beverage plants, carbonation systems, fillers, labelers, bright tanks, blending systems, and utility balance are often key constraints. In aseptic and retort operations, instrumentation, validation integrity, and sterile barriers raise the consequence of small failures.
For companies planning expansions in Georgia, Texas, North Carolina, California, or the Midwest manufacturing belt, criticality assessment should be completed during concept design so that electrical distribution, bypasses, utility loops, isolation points, and maintenance access are built into the project from the beginning.
Failure Mode and Effects Analysis
Failure mode and effects analysis, or FMEA, is one of the most useful tools in reliability engineering because it forces the team to move from vague concern to specific risk logic. Instead of saying “the line keeps going down,” FMEA asks exactly how it fails, why it fails, how often it fails, what happens when it fails, and whether the failure can be detected before it becomes a shutdown or quality event.
In food facilities, FMEA works best when cross-functional teams participate. Maintenance may know the mechanical weak points. Operators know startup behaviors and nuisance stops. Sanitation knows which components degrade after chemical exposure. Quality knows which failures create product holds. Controls engineers know where alarms lack diagnostic value. Purchasing knows which parts are hard to source.
| Equipment | Failure Mode | Likely Cause | Effect on Plant | Detection Method | Recommended Action |
|---|---|---|---|---|---|
| Sanitary pump | Seal failure | Chemical attack or dry run | Leak, contamination risk, downtime | Visual inspection, vibration, flow change | Seal material review and dry-run protection |
| Plate heat exchanger | Gasket degradation | Thermal cycling | Cross-contamination, lost efficiency | Pressure trend, inspection | Lifecycle replacement plan |
| Air compressor | Oil carryover | Separator wear | Pneumatic issues, quality risk | Dew point and oil monitoring | Filtration and overhaul schedule |
| Filler valve | Inconsistent dosing | Wear or control drift | Giveaway, rejects, rework | Weight checks, vision system | Calibration and valve rebuild strategy |
| Retort controls | Sensor drift | Calibration failure | Process deviation, hold product | Verification testing | Critical calibration and dual validation |
| PLC network | Communication drop | Switch failure or configuration issue | Line stop, batch interruption | Alarm logs, network diagnostics | Managed switch redundancy and audit |
The value of FMEA is not the document itself. The value is the action plan it produces. Good outputs include redesigned guards for easier inspection, upgraded instrumentation, revised sanitation SOPs, controls changes, PM interval changes, improved training, and better spare part kits. On high-speed packaging lines, FMEA often identifies low-cost sensor mounting or cable routing issues that create outsized downtime. In wet environments, it frequently uncovers enclosure integrity and connector failures. In thermal processing, it often reveals calibration and valve response weaknesses.
Case studies across the U.S. repeatedly show that hidden control logic can limit capacity as much as hardware can. When an engineering partner reviews logic, sequencing, and alarm handling early, plants can sometimes recover significant throughput without large capital spending. Readers interested in examples of project-led problem solving can explore food and beverage project case studies that illustrate how operational bottlenecks are often solved through integrated engineering rather than equipment replacement alone.
Mean Time Between Failures Optimization
Mean time between failures, or MTBF, is a useful reliability metric when used correctly. It measures the average operating time between failure events for repairable assets. In food and beverage plants, MTBF optimization is not about making a number look better in a dashboard. It is about increasing stable run time between business-disrupting events while avoiding excess maintenance cost.
The first rule is to define failure consistently. A five-minute sensor reset should not always count the same way as a gearbox replacement or a product hold event. Many U.S. manufacturers classify failures by severity so that engineering can distinguish nuisance stops from critical outages. The second rule is to pair MTBF with MTTR, mean time to repair. A plant with moderate MTBF but excellent repair readiness may outperform a plant with slightly higher MTBF but chaotic recovery execution.
| Asset Class | Current MTBF | Target MTBF | Main Loss Driver | Optimization Tactic | Expected Result |
|---|---|---|---|---|---|
| Packaging conveyor drives | 220 hours | 340 hours | Washdown ingress | Sealed components and inspection points | Fewer electrical failures |
| Sanitary pumps | 480 hours | 720 hours | Seal wear | Material upgrade and dry-run interlocks | Longer seal life |
| Air compressors | 1,200 hours | 1,800 hours | Deferred service | Condition-based service plan | Fewer unplanned outages |
| Filler systems | 150 hours | 260 hours | Sensor faults and valve wear | Spare kits and fault elimination | Higher line uptime |
| CIP skids | 900 hours | 1,300 hours | Valve sticking | Actuator standardization | More reliable cleaning cycles |
| Boiler feedwater systems | 2,100 hours | 2,800 hours | Pump cavitation | Hydraulic review and monitoring | Lower utility disruption |
To improve MTBF, plants usually need a mix of actions: eliminate design flaws, improve operating discipline, tighten planned maintenance, improve lubrication control, add predictive monitoring, and standardize failure coding in the CMMS. Plants near busy labor markets such as Southern California or central Texas also benefit from better documentation because workforce turnover can otherwise erase tribal knowledge.
For executives, MTBF should be translated into dollars. If increasing filler MTBF by 70 percent prevents two lost shifts per month, reduces cleanup scrap, and stabilizes retailer shipments, the business case becomes clearer than a maintenance graph alone.
Redundancy and Backup System Design
Redundancy is one of the most misunderstood topics in food facility reliability engineering. Redundancy does not mean duplicating everything. It means selectively designing backup capacity where the business consequence of a single-point failure is too high. In U.S. food and beverage operations, the most common redundancy candidates are utilities, controls infrastructure, sanitation systems, and product-holding functions.
Examples include duplex sanitary pumps, lead-lag air compressors, N+1 chilled water or glycol circulation, backup RO trains, dual boilers where justified, network path redundancy, spare VFD strategy, emergency power for critical controls, and parallel CIP functionality in plants with tight sanitation windows. In some sectors, inventory buffering can be a practical alternative to full mechanical redundancy. In others, such as aseptic, dairy, or high-speed beverage, downtime cost may justify stronger backup design.
Geography matters. Plants on the Gulf Coast may weigh hurricane resilience, utility interruption risk, and port-related supply chain variability. Facilities in the Upper Midwest may prioritize winterization and freeze protection. Plants serving major retail networks out of Pennsylvania, Ohio, Indiana, or Tennessee may emphasize uninterrupted distribution commitments. Reliability engineering must adapt to local operating realities.
The bar chart shows realistic differences in how much redundancy demand tends to exist by category. Aseptic and RTD beverage plants often place a very high premium on uninterrupted controls, utilities, and sterile support systems. Frozen foods may still need reliability upgrades, but the redundancy profile may differ based on process design and production flexibility.
When evaluating local suppliers, U.S. manufacturers should ask about response times, regional service coverage, sanitary parts availability, control panel support, and commissioning competence. The best supplier is not always the lowest bidder. It is often the one that can keep the line recoverable. Strategic sourcing should include nearby parts support in regions such as the Carolinas, Midwest dairy corridor, Central Valley, Pacific Northwest, and Texas manufacturing triangle.
Condition Monitoring Technologies
Condition monitoring technologies are increasingly important because food plants need earlier warning of asset deterioration without excessive manual inspection. The most practical technologies for U.S. food and beverage sites include vibration monitoring, infrared thermography, oil analysis, ultrasonic inspection, motor current analysis, pressure and flow trend analytics, valve position feedback, compressed air leak detection, and advanced PLC/SCADA alarm diagnostics.
Not every plant needs every technology. The correct deployment depends on criticality, failure history, environment, and available skill. High-speed lines may benefit from smart sensing and alarm analytics. Wet-process plants may benefit more from pump, motor, valve, and heat exchanger monitoring. Utility-intensive sites can gain significant value from compressor, boiler, chiller, and water treatment analytics.
| Technology | Best Use Case | Detects | Typical Target Assets | Implementation Difficulty | Value Level |
|---|---|---|---|---|---|
| Vibration analysis | Rotating equipment | Bearing, alignment, imbalance | Pumps, motors, fans | Medium | High |
| Infrared thermography | Electrical and thermal issues | Hot spots, insulation loss | Panels, motors, steam systems | Low | High |
| Oil analysis | Lubricated systems | Wear metals, contamination | Gearboxes, compressors | Medium | Medium |
| Ultrasound | Leaks and mechanical friction | Compressed air leaks, bearing issues | Air systems, valves, bearings | Medium | High |
| Motor current analysis | Electrical load behavior | Rotor or load anomalies | Critical motors | Medium | Medium |
| SCADA trend analytics | Process and automation instability | Drift, nuisance alarms, hidden bottlenecks | Entire line or utility system | Low to medium | Very high |
For 2026, the most important trend is convergence. Plants will increasingly connect condition monitoring with sustainability, food safety, and labor efficiency. For example, compressor leak detection cuts both downtime risk and energy cost. Better heat exchanger monitoring can reduce product loss and utility waste. Smart CIP analytics can improve cleaning reliability while lowering water and chemical consumption. As environmental reporting and energy scrutiny increase, reliability and sustainability will continue to overlap.
The area chart illustrates the ongoing U.S. shift from reactive maintenance toward predictive approaches. The change is being driven by automation growth, tighter labor conditions, stricter uptime expectations, and the falling cost of monitoring technologies.
Reliability Metrics and KPIs
Reliability metrics are only valuable if they drive better decisions. In food manufacturing, the most useful KPI set usually includes MTBF, MTTR, planned maintenance completion, schedule compliance, percent reactive work, spare parts fill rate, OEE impact from downtime, repeat failure rate, sanitation-related failures, and utility uptime. Plants should also track production consequence, such as pounds lost, cases not shipped, overtime hours, and product hold incidents linked to equipment events.
The goal is balance. A plant can hit PM completion targets while still suffering chronic failures if the wrong PM tasks are being done. It can also show strong OEE on one line while missing the broader issue of unstable utilities. KPI reviews should therefore connect maintenance metrics with operations and quality outcomes.
| KPI | What It Measures | Why It Matters | Healthy Direction | Common Mistake | Executive Use |
|---|---|---|---|---|---|
| MTBF | Average run time between failures | Shows stability improvement | Increase | Inconsistent failure definition | Prioritize chronic loss areas |
| MTTR | Average repair duration | Measures recovery readiness | Decrease | Ignoring wait time for parts | Support staffing and spares |
| Planned maintenance compliance | PM tasks completed as scheduled | Indicates execution discipline | Increase | Counting low-value PMs equally | Review maintenance quality |
| Reactive work percentage | Unplanned maintenance share | Shows planning maturity | Decrease | Misclassifying urgent work | Assess organizational stability |
| Repeat failure rate | Recurrence of same issue | Measures problem-solving depth | Decrease | Weak failure coding | Justify engineering fixes |
| Spare parts service level | Availability of needed parts | Limits long downtime events | Increase | Stocking low-value items only | Balance inventory and risk |
Supplier and product comparison can also support KPI decisions, particularly when standardizing new equipment or evaluating service partners.
The comparison chart reflects a common reality in U.S. manufacturing: the lowest installed cost supplier may underperform in support, controls transparency, and spare parts access. For plants with aggressive throughput commitments, support quality often matters more than modest upfront savings.
As a buying rule, manufacturers should require reliability deliverables during capital projects: critical spares list, recommended PM library, controls backups, sensor maps, utility demand profile, FAT and SAT documentation, and operator-maintainer training. Companies exploring broader project support can review integrated engineering and project services that combine design, installation, and execution oversight with plant performance objectives.
Our Company
Disruptive Process Solutions, or DPS, approaches food and beverage reliability through a business-first engineering lens. Rather than treating uptime as an isolated maintenance problem, the company aligns plant design, project execution, controls strategy, utility resilience, and operational profitability. That approach is especially relevant for U.S. manufacturers balancing growth, labor pressure, compliance demands, and capital discipline.
From a technological capabilities perspective, DPS works across structural, mechanical, plumbing, electrical, process, and automation disciplines. Its team supports PLC programming, SCADA integration, utility systems, process controls, batching, recipe management, and energy-related infrastructure. In practice, that means reliability issues can be solved at the system level instead of being pushed between departments. A throughput problem may be mechanical, controls-related, utility-related, or sequencing-related, and integrated engineering is often required to identify the true root cause. More detail on the company’s background and operating philosophy is available on the about page for DPS.
From a manufacturing capabilities perspective, DPS supports equipment and system solutions used across beverage, dairy, protein, prepared foods, aseptic processing, fermentation, distillation, pasteurization, retort, blending, and water treatment applications. The company also manufactures selected process equipment such as tanks, CIP systems, tumblers, and cooking vessels, which helps it align design intent with field execution. For reliability-driven buyers, this matters because equipment selection, maintainability, cleanability, and integration all affect long-term uptime. Manufacturers comparing equipment options can explore process equipment solutions relevant to food and beverage operations.
From a service capabilities perspective, DPS uses an end-to-end design-build-manage model that covers process engineering, feasibility, owner’s representation, project and program management, general contracting where licensed, system installation, and commissioning. This is important for reliability because project handoffs are where many plants lose performance. When planning, design, construction, and startup are coordinated, the final system is more likely to support maintenance access, spare part standardization, utility resilience, and stable commissioning. For manufacturers in the United States expanding capacity, relocating assets, or launching new lines, that integrated project structure can reduce startup risk and help achieve profitable output faster.
DPS serves manufacturers across all 50 U.S. states and Canada, with strong relevance for facilities handling beverages, proteins, dairy, sauces, aseptic products, and co-packing operations. The company’s value proposition is not simply technical breadth; it is the willingness to challenge poor capital assumptions and prioritize client profitability over unnecessary spending. In reliability engineering, that often means fixing the actual bottleneck instead of just adding more steel and stainless.
FAQ
What equipment is usually most critical in a food plant?
Usually the most critical assets are those that can stop the entire process or create food safety exposure: boilers, compressed air, refrigeration or glycol, primary fillers, retorts, aseptic barriers, CIP systems, and control networks.
How often should a plant perform a criticality review?
At minimum once a year, and again after major line changes, new product introductions, utility expansions, or facility acquisitions.
Is preventive maintenance enough?
Not by itself. Food plants usually need a mix of preventive, predictive, operator care, redesign, and planned run-to-failure depending on the asset and consequence of failure.
What is a good first step for a reactive plant?
Start with a Pareto review of downtime, identify top ten failure contributors, perform criticality scoring, and complete FMEA on the top three bottlenecks. This creates a realistic roadmap without overwhelming the site.
How does reliability affect food safety?
Reliable equipment supports consistent time, temperature, flow, cleaning, and sealing performance. Poor reliability can lead to incomplete CIP, process deviations, contamination risk, and product holds.
Which industries gain the most from reliability engineering?
High-throughput and compliance-sensitive sectors benefit most, including dairy, beverage, protein processing, aseptic manufacturing, prepared foods, sauces, frozen foods, and co-packing.
Should every plant invest in condition monitoring?
Most should, but the scope should match asset criticality and team capability. A small plant may begin with infrared and compressor leak surveys, while a larger plant may deploy vibration sensors, SCADA analytics, and utility dashboards.
What are the most important 2026 trends?
Expect deeper use of predictive analytics, tighter integration between reliability and sustainability, stronger energy monitoring, more cyber-aware controls architecture, and increased focus on resilient utility design due to climate and supply chain risks.
How should local supplier strategy be handled in the United States?
Build a hybrid model: national standards for key equipment, regional service support near your plant, and on-site critical spares for components with long lead times. Facilities near ports, inland freight corridors, or remote production areas should account for logistics disruption risk.
When should a company bring in an external engineering partner?
Typically during expansions, chronic downtime on bottleneck systems, line relocations, utility failures, controls limitations, or when internal teams are too busy firefighting to redesign the system properly.
In summary, food facility equipment reliability engineering in the United States is most successful when it is treated as a profit protection system, not merely a maintenance program. The strongest plants define criticality clearly, analyze failure modes rigorously, monitor asset condition intelligently, design selective redundancy, and hold themselves accountable with business-linked KPIs. Whether the plant is shipping beverages through California, processing protein in Texas, filling dairy in Wisconsin, or supporting co-packing in the Carolinas, reliability remains one of the clearest paths to safer operations, stronger margins, and more dependable growth.
[/trp_language]
Complete Company Portfolio

About the Author: Disruptive Process Solutions (DPS)
The DPS team combines process engineering expertise with real-world food and beverage manufacturing experience. Our content focuses on process optimization, production efficiency, facility improvements, and practical solutions that help manufacturers operate more effectively in a rapidly evolving industry.
Share

