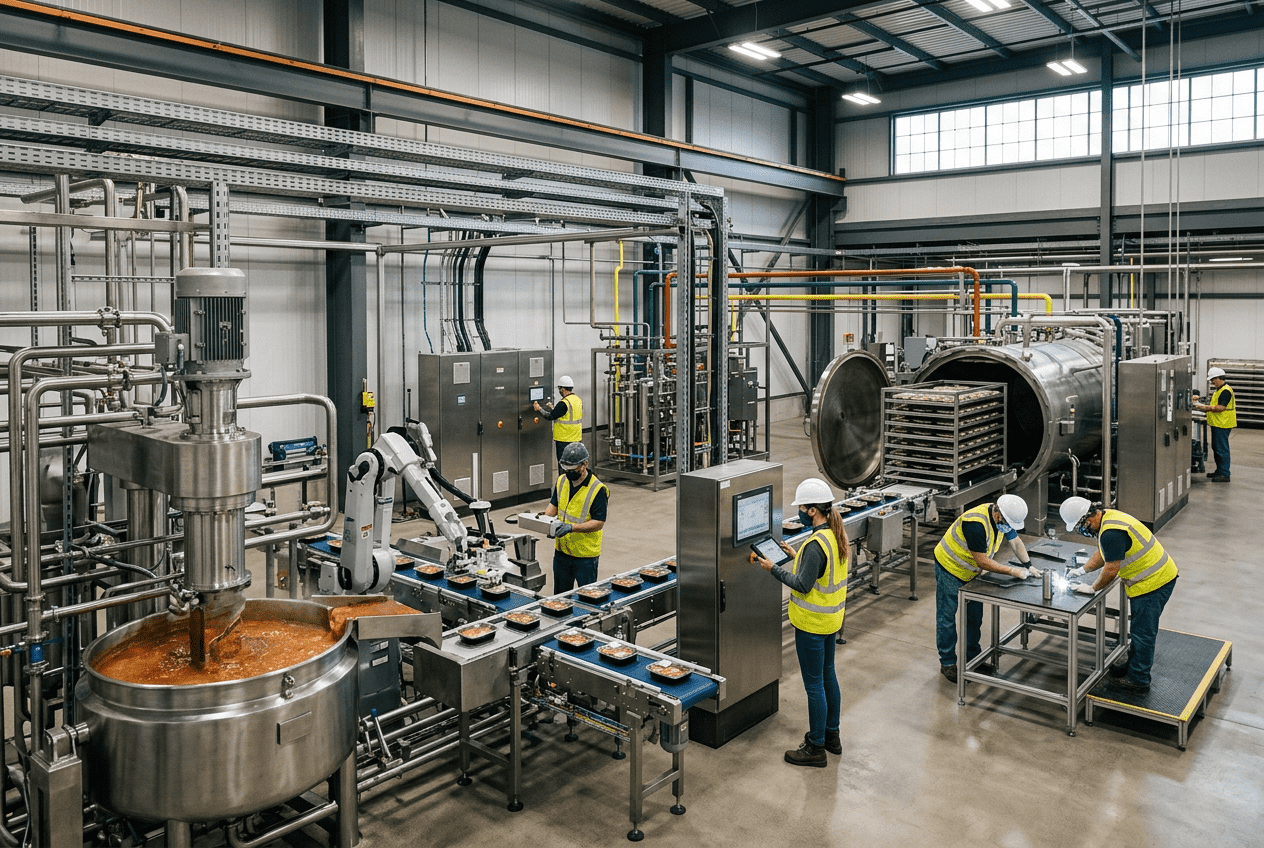
Food Facility Line Balancing in 2026: Lean Methods for Production Efficiency Gains
[trp_language language=”en_US”]
Food facility line balancing in the United States is becoming less about isolated equipment speed and more about synchronized throughput, labor efficiency, product quality, and sanitation-driven uptime. In 2026, the most effective line balancing strategies for food manufacturing combine time study and work measurement, bottleneck identification methods, takt time and cycle time analysis, value stream mapping for food lines, and lean tools for line optimization within a disciplined continuous improvement framework. For U.S. processors facing labor volatility, retailer service pressure, traceability demands, and rising utility costs, line balancing is one of the fastest ways to increase output without defaulting to a major capital expansion.
Whether a plant runs protein, dairy, sauces, ready-to-drink beverages, aseptic products, frozen prepared meals, or co-packing operations, line balance affects OEE, labor cost per unit, waste generation, giveaway, rework, and schedule adherence. Plants in Chicago, Fresno, Dallas-Fort Worth, Atlanta, Charlotte, Omaha, Houston, and the Inland Empire often discover that the constraint is not where they first assumed. In many U.S. facilities, the true bottleneck sits in changeover logic, sanitation windows, hand-pack stations, conveyor accumulation gaps, upstream batching variability, or controls sequencing rather than in the largest machine on the floor.
Quick Answer

The quickest answer is this: successful line balancing in food manufacturing starts with measuring real cycle times by SKU, shift, crew, and sanitation condition; then locating the true constraint; then redesigning labor, equipment sequencing, accumulation, and controls around takt time. U.S. manufacturers typically see the strongest gains when they treat the line as one connected system rather than as separate assets owned by different departments.
In practical terms, a 2026-ready balancing project should include six actions:
- Capture actual machine and labor cycle time data, not nameplate rates.
- Separate chronic bottlenecks from temporary disruptions.
- Map material, people, quality checks, and CIP or washdown impacts.
- Use takt time to align staffing and production schedule expectations.
- Build buffers and accumulation only where they protect the constraint.
- Standardize the improved state with training, controls logic, and daily management.
For many facilities, this approach produces 10% to 30% throughput improvement before a major capex event is required. In regulated environments, it also improves consistency because line balance reduces the rush-and-wait pattern that often creates defects, temperature excursions, label errors, or weight variation.
| Line Balancing Objective | Primary Metric | Typical U.S. Plant Issue | Best First Tool | Expected Result | Time Horizon |
|---|---|---|---|---|---|
| Increase throughput | Units per hour | Mismatch between filler and pack-out | Cycle time study | Higher sustained output | 2 to 8 weeks |
| Reduce labor strain | Labor hours per case | Manual stations overloaded | Operator balance chart | Better crew utilization | 2 to 6 weeks |
| Lower downtime | Minutes lost per shift | Frequent micro-stops | Bottleneck analysis | More runtime stability | 4 to 10 weeks |
| Improve schedule attainment | % plan achieved | Long changeovers | SMED review | More reliable planning | 3 to 8 weeks |
| Cut product loss | Yield variance | Overfill or purge waste | Value stream map | Higher margin | 4 to 12 weeks |
| Delay capex | Capacity utilization | Assumed equipment shortage | Constraint validation | More capacity from existing assets | 6 to 12 weeks |
The table above matters because it shows that line balancing is not a single method. It is a decision system that connects production rate, labor, quality, maintenance, and capital planning.
2026 Line Balancing Strategies for Food Manufacturing

In 2026, U.S. food manufacturers are operating in a market shaped by automation adoption, stricter food safety expectations, cost pressure, and demand variability from club, retail, foodservice, and e-commerce channels. That means line balancing strategies need to be flexible enough for high-mix production while still delivering repeatable throughput.
The most effective strategies fall into five categories:
- Digital visibility on actual line performance.
- SKU-specific balance by package, weight, and handling profile.
- Constraint protection through controls, accumulation, and labor design.
- Sanitation-aware scheduling and equipment layout.
- Cross-functional improvement governance.
Plants near logistics hubs such as the Port of Los Angeles, Savannah, Houston, and New Jersey often deal with demand spikes and promotional swings. Midwestern protein and dairy operations may experience labor tightness and utility cost sensitivity. Southeastern beverage co-packers may run aggressive seasonal ramps. Each situation changes how a line should be balanced. A poultry cut-up line in Arkansas, for example, has very different balancing priorities from an aseptic beverage filling line in California or a sauce batching and hot-fill operation in North Carolina.
One reason more U.S. manufacturers are reevaluating line balance in 2026 is the shift from static line design to operational adaptability. A line that looks balanced at 150 units per minute for one SKU may become unstable when package dimensions, viscosity, cook time, allergen wash requirements, or pallet pattern change.
The chart suggests a realistic rise in structured line balancing adoption across U.S. food and beverage operations. Growth is being driven by labor shortages, digital manufacturing tools, and the need to extract more output from existing footprints.
| 2026 Strategy | What It Solves | Best Fit Product Types | Operational Trigger | Risk if Ignored | Priority Level |
|---|---|---|---|---|---|
| Digital performance baselining | Unknown true rates | Beverage, dairy, protein | Frequent rate disputes | Bad capex decisions | High |
| SKU family balancing | Rate swings by product | Prepared foods, co-pack | High product mix | Scheduling instability | High |
| Constraint-protected controls | Starve/block events | Filling, cooking, packing | Micro-stop patterns | OEE erosion | High |
| Sanitation-integrated planning | Washdown disruptions | Protein, dairy, aseptic | Lost post-clean startup time | Hidden downtime | High |
| Labor rebalance by station | Manual overburden | Case packing, inspection | Ergonomic complaints | Turnover and defects | Medium |
| Changeover optimization | Excess setup loss | Multi-SKU lines | Shorter runs | Capacity shortfall | High |
This table shows that balancing strategies must match production reality. A shelf-stable retort line, for instance, needs a stronger focus on batch synchronization than a high-speed carbonated beverage line, where accumulation and controls timing may dominate results.
Time Study and Work Measurement

Time study is the foundation of any serious balancing effort. Yet in many U.S. plants, time data is either outdated, taken under ideal conditions, or measured too broadly to reveal true losses. Effective work measurement in food manufacturing should capture manual motions, machine states, wait time, sanitation resets, quality inspection intervals, and changeover elements.
For labor-intensive lines, stopwatch studies still matter, but 2026 best practice blends direct observation with PLC tags, SCADA history, downtime codes, vision data, checkweigher trends, and production historian records. The objective is not just to know how long a task takes, but to understand variation by operator, product, packaging format, shift, and environmental condition.
Important measurement principles include:
- Break work into elements small enough to improve.
- Separate internal setup time from external setup time.
- Measure machine cycle, operator cycle, and effective cycle independently.
- Track first-hour startup losses separately from steady-state production.
- Include sanitation, allergen change, and QA hold impacts.
- Validate data on both best and worst performing shifts.
Example: on a sauce packaging line in the Midwest, the filler may appear to run at target speed, but if the capper pauses every few minutes and the labeler requires repeated adjustment due to container variability, the effective line rate falls well below the visible machine speed. A proper study exposes this hidden gap.
| Measurement Element | What to Capture | Food Line Example | Common Mistake | Recommended Tool | Improvement Value |
|---|---|---|---|---|---|
| Machine cycle time | Actual run interval | Filler strokes per minute | Using nameplate speed | PLC data | High |
| Operator cycle time | Hands-on task duration | Tray loading | Ignoring walking time | Video study | High |
| Changeover time | Last good to first good | SKU switch on labeler | Only timing mechanics | SMED worksheet | High |
| Inspection time | QA and compliance checks | Weight verification | Excluding line stoppage effect | Standard work sheet | Medium |
| Cleaning reset time | Post-wash startup loss | CIP recovery | Hiding time in sanitation bucket | Shift event log | High |
| Material replenishment time | Downtime during restock | Film roll change | Not treating as capacity loss | Operator observation | Medium |
The reason this table is useful is that every row points to a different source of lost capacity. When plants only measure average run rate, these losses remain invisible.
Bottleneck Identification Methods
Finding the bottleneck sounds simple, but in practice many facilities confuse the slowest machine with the true system constraint. A bottleneck is the step that limits total throughput over time. On some days it is packaging; on others it is batching, thermal processing, accumulation, sanitation release, or labor availability.
Reliable bottleneck identification methods include:
- Throughput observation over complete shifts.
- Queue and starvation/blockage analysis.
- Downtime Pareto by asset and event code.
- Utilization review of upstream and downstream assets.
- Constraint walk with operations, maintenance, and quality together.
- SKU-based constraint mapping.
A practical indicator is this: the bottleneck should have the least idle time when the system is trying to produce. If every other area waits on one step, that is likely the constraint. But in food plants, the constraint can move. A cooking kettle may limit one sauce SKU, while the labeler limits another. A deboning room may limit one shift, while palletizing limits another due to staffing.
U.S. manufacturers also need to separate structural constraints from management constraints. A structural constraint may be the retort cycle itself. A management constraint may be scheduling too many short runs or placing allergen-heavy products in a sequence that inflates wash time.
This bar chart reflects realistic U.S. demand intensity by sector. Protein, beverage, and prepared foods tend to show especially high need because of labor complexity, sanitation pressure, and packaging variation.
Takt Time and Cycle Time Analysis
Takt time translates customer demand into the pace the line must sustain. Cycle time measures how long a process actually takes. Line balancing improves when these two numbers are compared honestly and often.
The basic takt formula is available production time divided by customer demand. But food manufacturing adds complexity. Plants must adjust takt for planned downtime, changeover, sanitation windows, product hold requirements, and shift patterns. A line may appear capable on paper but fail in execution because takt was calculated from gross hours instead of net available time.
Cycle time analysis should be done at three levels:
- Individual asset cycle time.
- Operator or manual station cycle time.
- End-to-end effective line cycle time.
Suppose a Dallas ready-meal line has net available time of 420 minutes and demand of 21,000 trays. Takt time is 1.2 seconds per tray at the line level. If sealing runs at 1.0 second, labeling at 1.1 seconds, but cartoning averages 1.5 seconds due to hand intervention, then cartoning is out of takt and the line is not balanced.
Key U.S. best practices for takt and cycle analysis in 2026 include modeling separate takt rates for core customers, using digital dashboards by SKU family, and recalculating takt when labor plans or sanitation schedules shift.
| Scenario | Net Available Time | Demand | Takt Time | Observed Cycle Time | Implication |
|---|---|---|---|---|---|
| RTD beverage filling | 450 min | 36,000 units | 0.75 sec | 0.71 sec | Within takt |
| Yogurt cup packing | 420 min | 24,000 units | 1.05 sec | 1.18 sec | Needs rebalance |
| Protein tray sealing | 390 min | 15,600 units | 1.50 sec | 1.42 sec | Capable if stable |
| Sauce bottling | 405 min | 18,000 units | 1.35 sec | 1.57 sec | Constraint present |
| Frozen meal cartoning | 435 min | 17,400 units | 1.50 sec | 1.62 sec | Manual station overloaded |
| Aseptic pouch filling | 360 min | 21,600 units | 1.00 sec | 0.96 sec | Aligned, watch startup loss |
The explanation is straightforward: if observed cycle time exceeds takt time, the process cannot reliably meet demand without overtime, inventory buffering, schedule change, or improvement.
Value Stream Mapping for Food Lines
Value stream mapping for food lines remains one of the most effective ways to reveal how product, information, labor, and quality controls interact across the plant. In food and beverage operations, the map must go beyond standard manufacturing flow and account for ingredients, temperature control, allergen segregation, CIP, sampling, hold-and-release steps, rework rules, and lot traceability.
A useful current-state map might start at ingredient receiving in Kansas City, blending in North Carolina, cook or thermal process in Texas, packaging in Georgia, and refrigerated shipment through Chicago or the Northeast corridor. Even within one plant, the flow includes decisions from planning, maintenance response, QA release, warehouse replenishment, and packaging material staging.
The highest-value future-state maps usually target:
- Reduced queue time between processing and packaging.
- Fewer manual touches.
- Shorter sanitation recovery after washdown.
- Better synchronization of upstream batching and downstream filling.
- Smarter location of accumulation and inspection points.
- Faster issue escalation through digital management.
The area chart illustrates a realistic trend: U.S. plants are increasingly moving away from isolated equipment upgrades and toward flow-based optimization. This matters because a faster machine does not always mean a faster line.
Lean Tools for Line Optimization
Lean tools remain essential, but in food manufacturing they must be adapted to hygiene, compliance, and product variability. The best lean tools for line optimization in 2026 are practical, data-linked, and easy for operators to sustain.
The most relevant tools include:
- Standard work for repetitive manual tasks.
- SMED for changeover reduction.
- 5S for sanitation-friendly organization.
- Pareto analysis for downtime and defects.
- Yamazumi or operator balance charts for labor leveling.
- Poka-yoke for label, allergen, and pack verification.
- Andon escalation for rapid response.
- Daily management boards tied to throughput and loss metrics.
Food plants in the United States should be cautious about copying automotive lean methods without adaptation. In a beverage syrup room, recipe integrity and CIP validation matter as much as movement efficiency. In a USDA-inspected protein facility, product safety and zone separation can override the shortest walking path. The right lean system respects food safety first while still removing waste.
| Lean Tool | Primary Use | Food Manufacturing Example | Main Benefit | Common Barrier | Best Owner |
|---|---|---|---|---|---|
| SMED | Shorter changeovers | Flavor change on bottling line | More sellable time | Too many internal tasks | Operations + Maintenance |
| 5S | Workplace organization | Pack room tool control | Less searching and delay | Poor sustainment | Supervisors |
| Standard work | Repeatable execution | Case pack handoff | Lower variation | Training drift | Line leads |
| Pareto | Focus on biggest losses | Labeler fault codes | Faster root cause action | Bad event coding | CI team |
| Poka-yoke | Error prevention | Wrong lid prevention | Fewer defects and recalls | Late design integration | Engineering |
| Andon | Rapid issue escalation | Filler starve alert | Shorter response time | Alarm fatigue | Production |
This table helps show that each tool has a different purpose. Plants get the best results when they use the tool that matches the loss mechanism instead of launching broad lean activity with no constraint focus.
Continuous Improvement Frameworks
Without a framework, line balancing becomes a one-time project and performance gradually slips back. Continuous improvement frameworks keep gains alive through ownership, review cadence, and escalation discipline.
For U.S. food plants, the strongest frameworks usually combine:
- Daily line review of throughput, waste, downtime, and labor.
- Weekly constraint review by SKU family.
- Monthly engineering validation of chronic losses.
- Quarterly capacity review connected to commercial demand.
- Structured root cause analysis for top recurring issues.
- Operator involvement in improvement design.
In 2026, continuous improvement frameworks are also becoming more digital. Plants are using historian trends, machine state models, digital work instructions, and mobile maintenance workflows to preserve balance gains. Sustainability is now part of the same framework. If a rebalance reduces idle running, compressed air waste, steam load swings, water use, and product loss, it improves both cost and ESG performance.
Policy and compliance trends matter too. As traceability expectations tighten and retailer penalties for service failures rise, balancing lines around predictable output becomes a strategic advantage rather than a shop-floor exercise.
Our Company
Disruptive Process Solutions supports food and beverage manufacturers across the United States and Canada with a practical, profit-focused approach to engineering and line performance. Rather than treating a facility problem as only an equipment issue, the company looks at production, utilities, controls, labor flow, and capital efficiency together.
From a technological capability standpoint, DPS works across process, mechanical, electrical, plumbing, structural, and controls disciplines. That matters for line balancing because improvements often depend on more than one lever at once. A packaging bottleneck may require PLC programming updates, conveyor redesign, utility adjustments, smarter CIP integration, or improved SCADA visibility. Facilities evaluating line optimization can learn more about the company’s broader background on the About Us page.
On the manufacturing capability side, DPS has experience across beverage, brewing, spirits, dairy, prepared foods, protein, sauces, aseptic systems, and specialty processing. That range is important because the balancing method for a retort line, a marination system, a dairy process train, or a high-speed beverage filler is never identical. The company also supports proprietary equipment such as tanks, CIP systems, marination tumblers, and process vessels, which can be explored through its equipment portfolio.
From a service capability perspective, DPS provides process engineering and design, capital planning, owner’s representation, project and program management, general contracting where applicable, installation, and full system integration. This is especially useful when a line balancing initiative evolves into a broader plant improvement project involving layout, utilities, controls, or phased expansion. More detail is available in its services overview.
A practical example of this philosophy is when a manufacturer assumes that expansion capex is required, but analysis reveals that controls sequencing or system integration is the true bottleneck. In those cases, a targeted fix can unlock major output gains at a fraction of the expected cost. Manufacturers interested in how real projects are approached can review selected project case examples.
FAQ
What is line balancing in food manufacturing?
It is the process of aligning labor, equipment, flow, and controls so that each production step supports the required throughput with minimal waiting, blocking, waste, and overburden.
How is food line balancing different from other industries?
Food plants must account for sanitation, allergen management, quality checks, temperature control, traceability, and changing product characteristics such as viscosity, density, or package fragility.
What is the difference between takt time and cycle time?
Takt time reflects the pace needed to satisfy demand. Cycle time is the actual time a process takes. When cycle time is longer than takt time, the process will struggle to meet demand consistently.
How long does a line balancing project usually take?
A focused assessment may take two to six weeks. A broader implementation involving controls, layout, and standard work can take several months depending on line complexity and sanitation scheduling.
Can line balancing reduce the need for expansion?
Yes. Many U.S. facilities recover meaningful capacity through better sequencing, labor allocation, controls changes, changeover reduction, and constraint management before adding new equipment.
Which sectors benefit most?
Protein, dairy, beverage, prepared foods, sauces, aseptic packaging, and co-packing all benefit, though the methods differ by process and package type.
What data should be collected first?
Start with actual run rates, downtime by reason code, changeover duration, startup losses, labor distribution, quality hold time, and sanitation recovery time by SKU and shift.
What are the biggest 2026 trends?
More digital measurement, tighter traceability expectations, sustainability-linked efficiency work, greater use of automation and controls integration, and more focus on extracting capacity from existing U.S. facilities.
How should a plant choose a partner?
Look for a team that understands process engineering, packaging flow, utilities, controls, sanitation realities, and project execution—not just equipment sales. The best partners align improvement work to profitability, compliance, and long-term plant strategy.
For U.S. manufacturers, the takeaway is clear: 2026 line balancing strategies for food manufacturing are no longer optional efficiency projects. They are core operating disciplines that influence margin, service, labor retention, food safety, and capital timing. Plants that combine time study and work measurement, bottleneck identification methods, takt time and cycle time analysis, value stream mapping for food lines, lean tools for line optimization, and continuous improvement frameworks will be best positioned to grow output without losing control of cost or quality.
This comparison chart highlights a common buying lesson for U.S. food manufacturers: line balancing projects often succeed faster when the partner can connect process, controls, installation, utilities, and compliance instead of addressing only one scope.
| Buyer Question | Why It Matters | Good Answer Looks Like | Warning Sign | Best Project Stage | Business Impact |
|---|---|---|---|---|---|
| Have you measured actual cycle time by SKU? | Prevents false assumptions | Yes, with shift-level variation | Only nameplate rate discussed | Assessment | Better decisions |
| Where is the true constraint? | Sets priority | Backed by data and observation | Answered too quickly | Assessment | Faster ROI |
| How do sanitation windows affect balance? | Food-specific reality | Included in net time model | Treated separately | Design | Realistic capacity |
| Can controls changes solve part of the issue? | May avoid capex | Reviewed with PLC logic | Only mechanical fixes offered | Concept | Lower spend |
| What standard work will sustain gains? | Prevents backsliding | Training and visual management included | No ownership plan | Implementation | Long-term stability |
| How will you validate results? | Confirms ROI | Baseline vs post-improvement metrics | No measurement plan | Closeout | Accountability |
This final table serves as buying guidance. It helps processors in the United States ask sharper questions before committing to a line improvement project, a controls retrofit, or a larger facility expansion.
[/trp_language]
Complete Company Portfolio

About the Author: Disruptive Process Solutions (DPS)
The DPS team combines process engineering expertise with real-world food and beverage manufacturing experience. Our content focuses on process optimization, production efficiency, facility improvements, and practical solutions that help manufacturers operate more effectively in a rapidly evolving industry.
Share

