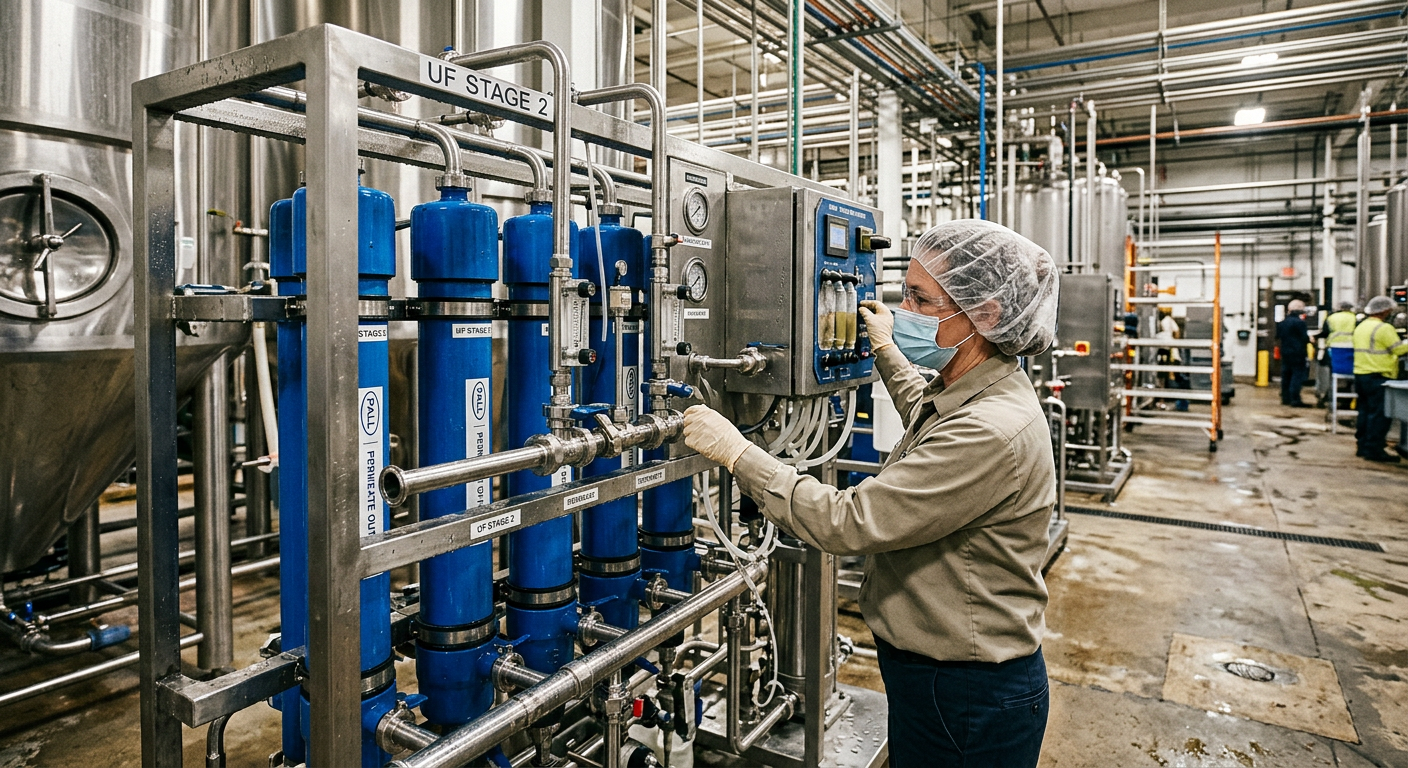
Food Facility NPV Modeling in 2026: Best Practices and Common Mistakes
[trp_language language=”en_US”]
Food Facility NPV Planning for U.S. Capital Decisions
Net present value, or NPV, remains one of the most reliable tools for judging whether a food or beverage facility investment will create economic value. In the United States, where processors face high utility costs, labor variability, freight constraints, sanitation requirements, and fast-changing consumer demand, a disciplined NPV model helps leaders move beyond instinct and compare projects on a common financial basis. Whether the decision involves a new protein plant in Texas, a dairy line expansion in Wisconsin, a beverage co-packing site near Atlanta, or a brownfield upgrade in California, the quality of the model directly affects the quality of the capital decision.
This guide explains how to build a practical NPV model for food facilities in 2026, what assumptions matter most, how to avoid the mistakes that distort valuation, and how to use NPV to compare greenfield and brownfield options. It also connects project economics to real operating conditions across major U.S. manufacturing corridors such as Chicago, Dallas-Fort Worth, Charlotte, Fresno, Houston, Kansas City, the Inland Empire, and logistics gateways tied to the ports of Los Angeles, Long Beach, Savannah, New York and New Jersey, and Houston.
Quick Answer

The best practice for food facility NPV modeling in the United States is to forecast realistic after-tax cash flows, use a risk-adjusted discount rate grounded in WACC, stress test labor, throughput, utility, and compliance assumptions, and treat terminal value conservatively. The most common mistakes are overstating ramp-up speed, underestimating startup losses, ignoring maintenance capital, using the wrong discount rate, and failing to model working capital. For most processors, an accurate model combines engineering scope, operating data, utility loads, automation strategy, and local market conditions before any board-level capital approval is issued.
In practical terms, a strong model should answer six questions:
- How much cash must be invested, and when?
- How quickly will the line or facility reach stable throughput?
- What gross margin improvement or capacity revenue is truly achievable?
- What recurring costs will rise, including labor, energy, wastewater, packaging, and maintenance?
- What risks could delay startup or lower utilization?
- Does the project create more value than other available capital uses?
| Decision Area | What NPV Measures | Why It Matters in U.S. Food Manufacturing | Common Error | Better Practice | Impact on Approval |
|---|---|---|---|---|---|
| Capacity expansion | Future cash from higher output | Demand varies by region and channel | Assuming full utilization in year one | Use staged ramp-up by quarter | Improves realism |
| Automation | Labor savings and yield gains | Labor shortages remain persistent | Counting savings twice | Separate productivity from headcount reduction | Prevents inflated returns |
| Utilities upgrade | Energy and uptime benefits | Electricity and steam costs differ by state | Ignoring demand charges | Model full utility tariff structure | Clarifies payback |
| Compliance project | Risk avoidance and continuity value | FDA, USDA, SQF, and BRC exposure is material | Using only direct revenue math | Include avoided downtime and recall risk | Supports strategic approval |
| Site relocation | Consolidation and logistics savings | Freight and labor markets are regional | Underestimating transition disruption | Model overlap costs and temporary inefficiency | Reduces surprise losses |
| New product line | Incremental contribution margin | Retail and foodservice demand can shift fast | Confusing revenue with cash flow | Model contribution, capex, and working capital | Sharpens investment ranking |
The table above shows why NPV is not merely a finance exercise. In food and beverage manufacturing, engineering design, sanitation strategy, packaging format, utility infrastructure, labor layout, and logistics all alter the cash flow pattern. A board may approve a project because revenue looks attractive, but NPV can still be negative if startup drag, higher maintenance, or a weak residual value are ignored.
Understanding NPV for Food Facility Investments

NPV converts future project cash flows into today’s dollars. That matters because a dollar generated five years from now is worth less than a dollar earned today. In a food facility context, the cash flow stream may come from increased throughput, higher margin products, improved yields, reduced giveaway, lower labor dependence, reduced rework, lower water or energy consumption, fewer sanitation hours, or improved service levels to major retailers and foodservice customers.
For U.S. processors, NPV is especially useful because project economics are often uneven across time. A greenfield beverage plant in North Carolina might require 12 to 18 months of construction and commissioning before revenue stabilizes. A brownfield meat processing upgrade in Iowa may generate benefits more quickly but also create shutdown costs and operational disruption. A retort expansion in New Jersey may unlock national distribution, while an aseptic line in California could open premium channels but demand higher validation and maintenance discipline. NPV organizes these uneven effects into one decision metric.
Food facility NPV modeling should evaluate the project on an incremental basis. Only cash flows that change because of the investment belong in the model. Existing overhead that will remain regardless of the decision should not be forced into the analysis unless it changes with the project. Likewise, sunk costs such as past feasibility spend should not be treated as project cash outflows if they have already been committed.
In 2026, the market environment adds complexity. Wage pressure remains elevated in many production zones. Water and wastewater costs continue to matter in Western states. Utilities and refrigerant strategy are increasingly linked to sustainability goals. Retailers and major brands are still pushing resilience, traceability, and compliance. These trends make NPV more valuable, not less, because intuitive capital spending can easily miss hidden cost drivers.
The chart above illustrates the broader investment trend driving stronger demand for robust financial models. As processors expand domestic production, modernize legacy facilities, and invest in resilience near major freight corridors, capital discipline becomes critical.
| Facility Type | Primary Value Driver | Typical Cash Flow Benefit | Main Risk | NPV Sensitivity | Example U.S. Region |
|---|---|---|---|---|---|
| Dairy processing | Yield and throughput | Margin per pound and reduced downtime | Cold chain reliability | High to utility costs | Wisconsin |
| Protein processing | Labor productivity | Lower conversion cost | Labor turnover | High to staffing assumptions | Kansas, Iowa, Texas |
| RTD beverage | Speed to market | Revenue from new capacity | Demand volatility | High to utilization | Georgia, North Carolina |
| Aseptic foods | Shelf-stable distribution | Broader geography and premium mix | Validation complexity | High to startup timing | California |
| Prepared foods | Line flexibility | SKU expansion and changeover efficiency | Scheduling complexity | High to SKU mix | Illinois, Ohio |
| Co-packing facility | Utilization and customer mix | Contract manufacturing contribution | Volume concentration | High to contract renewal | Texas, Tennessee |
The key lesson is that NPV in food processing is operational at its core. It should reflect how the plant actually runs, not how a spreadsheet looks in a clean conference room.
Building the Cash Flow Projection Model

A strong cash flow model begins with project scope. Start with total installed cost: process equipment, utilities, building modifications, engineering, permitting, controls, integration, freight, rigging, startup, commissioning, training, and contingency. In U.S. food projects, owners often underestimate indirect costs such as local code upgrades, wastewater tie-ins, HVAC modifications, floor replacement, process piping reroutes, and sanitation-driven utility changes. If the scope is incomplete, the model is already compromised.
Next, define the benefit pathways. Some projects create top-line growth through new capacity. Others create cost reduction through lower labor, reduced waste, lower water use, better yield, shorter changeovers, or less downtime. Many projects do both. Benefits should be tied to line rates, OEE assumptions, staffing models, utility loads, maintenance profiles, and actual product mix. If a new filler can run 300 bottles per minute but upstream blending, pasteurization, or case packing cannot support that rate, the model should not claim the full filler capacity benefit.
Ramp-up deserves special attention. Most facility models are too optimistic in the first 12 months. Startup losses, qualification runs, labor learning curves, recipe tuning, customer approvals, sanitation debugging, and packaging variability all reduce realized output. A practical model uses monthly or quarterly ramp assumptions rather than a straight annual average.
Working capital must also be captured. A growing facility typically needs more raw materials, packaging inventory, finished goods, and receivables. In sectors such as beverage, dairy, and sauces, inventory policy can materially affect cash use during launch. If NPV ignores working capital, the project may look better than the real treasury burden.
Tax treatment matters as well. Federal and state taxes, depreciation schedules, bonus depreciation rules, and local incentives all influence after-tax cash flow. For some projects, abatements, grants, training funds, or utility incentives in states such as Texas, Georgia, North Carolina, Indiana, or South Carolina can materially improve economics.
| Cash Flow Line Item | Include in Model? | Why | Typical Source | Frequent Pitfall | Best Practice |
|---|---|---|---|---|---|
| Equipment purchase | Yes | Core capex outflow | Vendor quotes | Missing freight and rigging | Use installed cost |
| Engineering and permits | Yes | Required for execution | Project budget | Treated as overhead | Capture as project spend |
| Startup scrap | Yes | Real launch cost | Operations estimate | Ignored entirely | Model by month |
| Incremental revenue | Yes | Capacity and mix benefit | Sales plan | No price-volume logic | Tie to realistic utilization |
| Labor savings | Yes | Key automation value | Staffing model | Assuming instant elimination | Phase savings over time |
| Maintenance capital | Yes | Preserves performance | Asset plan | Set to zero after year one | Use lifecycle-based estimate |
| Working capital | Yes | Consumes cash during growth | Finance operations data | Omitted from project case | Link to sales and inventory turns |
The explanation behind this table is simple: every omitted line item tends to bias the NPV upward. In food manufacturing, that usually results in a project that looks better in presentation materials than it performs in the plant.
To improve model accuracy, many owners pair financial modeling with front-end engineering and operations mapping. This is where an integrated partner can help. Disruptive Process Solutions brings process engineering, utility design, controls integration, and capital planning into one framework, which is valuable because throughput assumptions are only credible when the process, utilities, and execution plan are aligned. Companies reviewing project approaches can explore food and beverage engineering services as part of early-stage feasibility work.
Discount Rate Selection and WACC Considerations
The discount rate converts future cash flows into present value. In most corporate settings, the starting point is weighted average cost of capital, or WACC, which reflects the cost of debt and equity financing. But using a single corporate WACC without adjustment can be misleading. A low-risk utility optimization project inside an existing plant should not be evaluated exactly like a greenfield co-packing facility dependent on new customer wins. The cash flows are different, so the risk should be different.
For U.S. food manufacturers in 2026, discount rate selection should account for several factors: project complexity, demand uncertainty, execution risk, commodity exposure, customer concentration, regulatory burden, technology maturity, and strategic importance. A brownfield automation upgrade in an established Midwest plant may justify a lower risk adjustment than a new aseptic beverage site intended to enter unfamiliar channels near the Port of Savannah.
That does not mean the discount rate should become a vague judgment tool. It should remain disciplined. Many companies set a base WACC and then apply project-specific overlays or scenario probabilities rather than arbitrarily raising the hurdle rate. This approach keeps governance consistent while still respecting actual risk.
Another common issue is mixing nominal and real assumptions. If revenue, labor, energy, and maintenance costs are forecast with inflation, the discount rate should also be nominal. If all cash flows are in real terms excluding inflation, the discount rate should be real. Mixing the two can significantly distort NPV.
The demand profile above helps explain why discount rates may vary by project category. Segments with faster expansion often face higher utilization uncertainty, while mature segments may present steadier but lower-growth cash flows.
| Discount Rate Issue | What Happens | Why It Is Wrong | Likely Result | Correction | Priority Level |
|---|---|---|---|---|---|
| Using one corporate rate for all projects | Risk differences disappear | Project risk is not uniform | Misranked investments | Use base WACC plus risk lens | High |
| Ignoring inflation consistency | Cash flows and rate mismatch | Nominal and real terms conflict | Distorted NPV | Align rate with forecast basis | High |
| Adding arbitrary premium | Rate becomes a guess | No analytical support | Good projects rejected | Use scenario analysis instead | Medium |
| Using debt rate only | Rate is too low | Ignores equity cost | NPV overstated | Use full WACC framework | High |
| Ignoring country and site specifics | Regional risks overlooked | Permitting and labor vary by state | Weak comparability | Adjust execution assumptions | Medium |
| Forgetting tax shield logic | WACC inconsistent | Capital structure not reflected | Wrong hurdle rate | Coordinate with finance team | Medium |
This table matters because discount rate errors can overpower all the operational detail in the model. Even if throughput, yield, and labor assumptions are strong, a flawed WACC approach can still produce the wrong capital ranking.
Terminal Value and Exit Assumptions
Terminal value often determines a large portion of total NPV, especially for long-life food facilities. That is why it must be handled carefully. For some projects, a terminal value based on continuing cash flow may be appropriate. For others, especially equipment tied to one product or customer, a lower residual value or no terminal growth may be more realistic.
In food processing, terminal value should reflect the real economic life of the asset. Tanks, utility infrastructure, structural elements, and certain process systems can remain useful for decades with proper maintenance. Specialized fillers, packaging formats, proprietary automation, and customer-specific lines may become obsolete much faster. The model should distinguish between them.
Exit assumptions should also reflect marketability. A strategically located plant in a logistics corridor near Chicago rail hubs, the Dallas distribution network, or the Port of Houston may hold stronger residual value than a highly customized facility in a labor-constrained region with limited alternative use. Likewise, environmental liabilities, refrigerant transitions, wastewater limitations, and deferred maintenance can reduce practical terminal value.
A conservative habit is to use multiple cross-checks: a perpetuity growth method, an exit multiple if relevant, and an asset-based residual estimate. If the implied terminal value from one method seems far above replacement economics, the model is probably too aggressive.
The trend shift above is important for terminal value in 2026. Facilities that support energy efficiency, water recovery, flexible packaging, traceability, and automation readiness may retain value better than assets built around outdated utilities or narrow product architectures.
| Terminal Value Method | Best Use Case | Main Advantage | Main Risk | Food Facility Example | Recommended Control |
|---|---|---|---|---|---|
| Perpetuity growth | Stable long-life operations | Simple and consistent | Growth rate too high | Mature dairy facility | Keep growth conservative |
| Exit EBITDA multiple | Marketable business units | Linked to transaction logic | Multiple selection bias | Regional co-packer | Use low, base, high range |
| Asset residual value | Specialized equipment focus | Tangible reality check | May understate going-concern value | Custom retort line | Estimate resale and removal cost |
| No terminal value | Short-life or uncertain use | Very conservative | May punish valid projects | Customer-specific packaging cell | Use as downside scenario |
| Hybrid method | Complex facility investments | Balanced perspective | More modeling effort | Integrated beverage plant | Cross-check all assumptions |
| Replacement-cost anchor | Long-lived infrastructure | Useful market sanity test | Not a cash flow method alone | Boiler and utility backbone | Use only as validation |
For boards and lenders, the explanation is straightforward: terminal value should support the investment case, not rescue it. If a project only clears the hurdle because of an aggressive exit assumption, the underlying economics are probably weak.
Sensitivity Analysis and Scenario Planning
No food facility model should be approved without sensitivity analysis. The most useful NPV models are not static forecasts; they are decision tools that show how value changes when the real world changes. For a U.S. processor, the most important sensitivities usually include throughput, selling price or customer volume, labor availability, utility cost, yield, startup timing, capex overrun, maintenance cost, and discount rate.
Scenario planning is especially useful when comparing strategic pathways. A base case might assume current market growth and a normal startup curve. A downside case could include slower customer onboarding, temporary labor shortages, elevated natural gas prices, and delayed validation. An upside case could reflect stronger utilization, faster line balancing, and local incentives. In 2026, it is also wise to model sustainability and policy scenarios, such as water use restrictions, refrigerant changes, emissions reporting expectations, and retailer pressure for more resilient domestic supply.
Monte Carlo simulation can help advanced teams, but even a well-designed tornado chart and three-case scenario set will outperform a single-point model. The purpose is not to create false precision. It is to identify which variables truly control value and where management should focus execution discipline.
The comparison chart shows why scenario planning matters. Greenfield and brownfield projects often trade off capital intensity, startup speed, efficiency, and risk in very different ways.
| Sensitivity Variable | Why It Matters | Typical Directional Impact | Who Owns the Input | How Often to Review | Decision Use |
|---|---|---|---|---|---|
| Utilization rate | Drives revenue capture | Very high | Operations and sales | Monthly during planning | Rank expansion options |
| Capex overrun | Changes initial outlay | High | Engineering and procurement | At every scope gate | Set contingency |
| Startup delay | Pushes benefits later | High | Project management | Weekly near launch | Board risk review |
| Labor cost | Affects savings and overhead | Medium to high | HR and plant leadership | Quarterly | Automation case |
| Energy and water cost | Key for thermal and utility projects | Medium | Utilities and finance | Quarterly | Efficiency investments |
| Yield improvement | Impacts margin directly | High | Quality and operations | By product family | Process upgrade case |
| Maintenance spend | Preserves uptime | Medium | Reliability team | Annually | Lifecycle economics |
The lesson from this table is that sensitivity analysis should be owned by the business, not only by finance. Reliable inputs come from engineering, operations, maintenance, procurement, quality, and commercial teams working together.
NPV Modeling Mistakes That Destroy Accuracy
The most damaging NPV mistakes are usually simple. Companies overestimate throughput, underestimate startup losses, omit maintenance capital, ignore working capital, double count labor savings, or use a discount rate that does not match the cash flow assumptions. In food plants, another major error is assuming the equipment determines capacity by itself. In reality, the slowest constraint often sits in utilities, changeovers, sanitation, packaging, warehouse flow, or controls logic.
Another major problem is failing to separate strategic value from direct cash flow. For example, a compliance-driven refrigeration, pasteurization, or hygienic design upgrade may not increase sales immediately, but it can reduce downtime risk, customer audit exposure, product loss, and recall probability. If the model excludes those avoided-cost benefits, management may underinvest in essential resilience.
There is also a governance issue. Many project cases are built to win approval rather than to forecast truth. This often shows up in low contingency, optimistic installation windows, vague labor assumptions, and a terminal value that does too much work. The antidote is cross-functional challenge from people who understand how plants actually run.
On the technology side, companies should verify that data architecture, PLC logic, SCADA integration, and recipe control assumptions are included where relevant. In some projects, software and controls unlock more value than new steel. A business-minded engineering team can often identify that earlier. This kind of thinking aligns with the operating philosophy behind real project case examples where profitability is judged by actual operational bottlenecks rather than headline capex alone.
| Mistake | What It Looks Like | Why It Happens | Damage to Model | Fix | Owner |
|---|---|---|---|---|---|
| Optimistic ramp-up | Full output too early | Commercial pressure | Inflated early cash flow | Use phased monthly ramp | Operations |
| No working capital | Inventory ignored | Finance shortcut | Cash need understated | Link to turns and payment terms | Finance |
| Maintenance omitted | No ongoing sustaining capex | Focus on approval case | NPV overstated | Use lifecycle estimate | Reliability |
| Double-counted labor savings | Productivity and headcount both claimed | Poor model structure | Benefits exaggerated | Separate mechanisms | HR and operations |
| Wrong discount rate | Generic hurdle rate used | Policy simplification | Bad ranking outcome | Align risk and WACC logic | Finance leadership |
| Ignoring utility bottlenecks | Line rate exceeds steam or cooling capacity | Equipment-only planning | Capacity benefit overstated | Validate full site infrastructure | Engineering |
This table explains why model quality depends on organizational honesty. The best NPV models are usually built by teams willing to challenge assumptions before the project begins, not after performance misses the budget.
Using NPV to Compare Greenfield vs Brownfield Options
Greenfield versus brownfield is one of the most important capital choices in U.S. food manufacturing. A greenfield project usually offers better layout, utility efficiency, food safety zoning, automation integration, and future expansion flexibility. A brownfield project usually offers faster market entry, lower initial capex, an existing workforce, and sometimes lower permitting complexity. NPV helps reveal which option truly creates more value once timing, disruption, risk, and scalability are reflected.
For example, a new beverage facility near Charlotte or Dallas may cost more upfront but allow optimized syrup rooms, boilers, compressors, cooling towers, packaging flow, and future line additions. A retrofit of an older plant near Chicago or Los Angeles may save capital and speed launch, but hidden utility upgrades, floor slope issues, sanitation constraints, low clear heights, and production interruptions can erode value.
Brownfield economics often look attractive because the initial capex is smaller. Yet if the site limits throughput, causes higher sanitation labor, creates freight inefficiencies, or requires repeated patchwork upgrades, long-term NPV may be weaker. Greenfield economics often look harder at first because the spend is larger. Yet if the facility is designed for expansion, energy efficiency, and smooth material flow, later cash generation may be much stronger.
Product type also matters. A highly sanitary aseptic or dairy process may benefit more from purpose-built design than a simpler dry blending operation. Protein plants may gain materially from labor and traffic flow redesign. Beverage co-packing often benefits from future-ready utilities and automation if volumes are expected to scale rapidly.
This is also where local supplier and execution ecosystems matter. Regions with strong contractor networks, fabricators, utility providers, and labor availability can reduce schedule and contingency risk. Owners should examine not just equipment price, but installation capacity, local trade quality, code familiarity, spare parts support, and startup proximity. The stronger the regional supply base, the more reliable the NPV case becomes.
When evaluating these options, many manufacturers look for integrated support that combines planning, design, equipment, and execution. Disruptive Process Solutions applies a Design Build Manage approach that helps align investment strategy with real field execution. Businesses exploring the firm’s background can review the company overview to understand how project-minded engineering can strengthen capital decisions.
Our Company
Disruptive Process Solutions supports food and beverage manufacturers across the United States and Canada with a practical focus on profitable capital deployment. Rather than treating a project as a collection of disconnected vendors, the company works as an engineering-led partner that evaluates process, utilities, controls, constructability, and business outcomes together. That approach is especially useful in NPV-driven decision making because the quality of the financial model depends on the quality of the technical assumptions behind it.
From a technological capability standpoint, DPS brings process engineering across food, beverage, dairy, protein, fermentation, aseptic, thermal processing, and automation environments. The team works with process systems such as blending and batching, CIP, HTST and UHT, retort, carbonation, distillation, filtration, water treatment, refrigeration, PLC programming, SCADA, batch control, and energy management. For NPV modeling, these capabilities matter because throughput, yield, utility load, sanitation time, and labor productivity all stem from how the process is truly engineered.
From a manufacturing capability standpoint, DPS also designs and supplies branded process equipment including tanks, CIP systems, marination tumblers, and cooking vessels, while integrating a broader range of third-party process equipment into complete plant solutions. That gives clients a grounded perspective on installed cost, maintainability, site fit, and startup readiness. Companies comparing alternatives can review available process equipment capabilities when building assumptions for facility investment cases.
From a service capability standpoint, DPS provides capital planning, feasibility studies, owner’s representation, process design, project and program management, general contracting support where licensed, installation, utility integration, and commissioning oversight. The company serves all 50 states with a lean execution model that is built for quick decision making and direct accountability. For U.S. food and beverage operators, this matters because schedule reliability, scope control, and startup performance are not side issues in an NPV model; they are core drivers of value creation.
The practical philosophy behind DPS is to challenge bad assumptions early, even if that reduces near-term project revenue. That kind of radical transparency is valuable in capital planning, where the wrong project can lock in years of underperformance. Whether the need is a co-packing beverage facility, a protein line modernization, a dairy utility upgrade, or a full feasibility study for a new site, the goal is the same: build profitable projects with assumptions that hold up under operational pressure.
FAQ
What is a good NPV for a food facility project?
A good NPV is one that is positive after realistic assumptions, risk testing, and proper discounting. The exact threshold depends on corporate capital constraints, strategy, and project risk.
Should food companies use payback or NPV?
Use both, but rely more on NPV for final ranking. Payback is useful for liquidity awareness, while NPV better captures long-term value.
How long should the forecast period be?
Most food facility models use 5 to 10 explicit forecast years plus terminal value. The right horizon depends on asset life, customer visibility, and market stability.
What discount rate should be used in the United States?
There is no universal rate. Start with corporate WACC, then evaluate whether project-specific risk adjustments or scenario analysis are warranted.
How should incentives be handled?
Include only incentives that are reasonably probable and well documented, such as grants, tax abatements, training funds, or utility rebates tied to the site.
Is greenfield always better for 2026 sustainability goals?
Not always. Greenfield often allows better energy, water, and flow design, but a well-selected brownfield site can still produce superior NPV if existing infrastructure is strong and retrofit risk is manageable.
Which variables usually matter most?
In many U.S. food projects, utilization, startup timing, capex overrun, labor savings realization, yield, and maintenance needs drive the largest NPV changes.
How often should the model be updated?
At minimum, update it at feasibility, 30 percent design, procurement lock, pre-startup, and post-launch review. The best companies use the same model as a living management tool.
In summary, accurate food facility NPV modeling in the United States depends on integrating finance with engineering reality. Projects succeed when cash flow assumptions reflect plant constraints, compliance needs, local market conditions, and execution discipline. In 2026, that means building models that are rigorous enough to withstand inflation, labor volatility, sustainability demands, and changing customer expectations. When smart capital meets smart manufacturing, NPV becomes more than a formula. It becomes a roadmap for profitable growth.
[/trp_language]
Complete Company Portfolio

About the Author: Disruptive Process Solutions (DPS)
The DPS team combines process engineering expertise with real-world food and beverage manufacturing experience. Our content focuses on process optimization, production efficiency, facility improvements, and practical solutions that help manufacturers operate more effectively in a rapidly evolving industry.
Share

