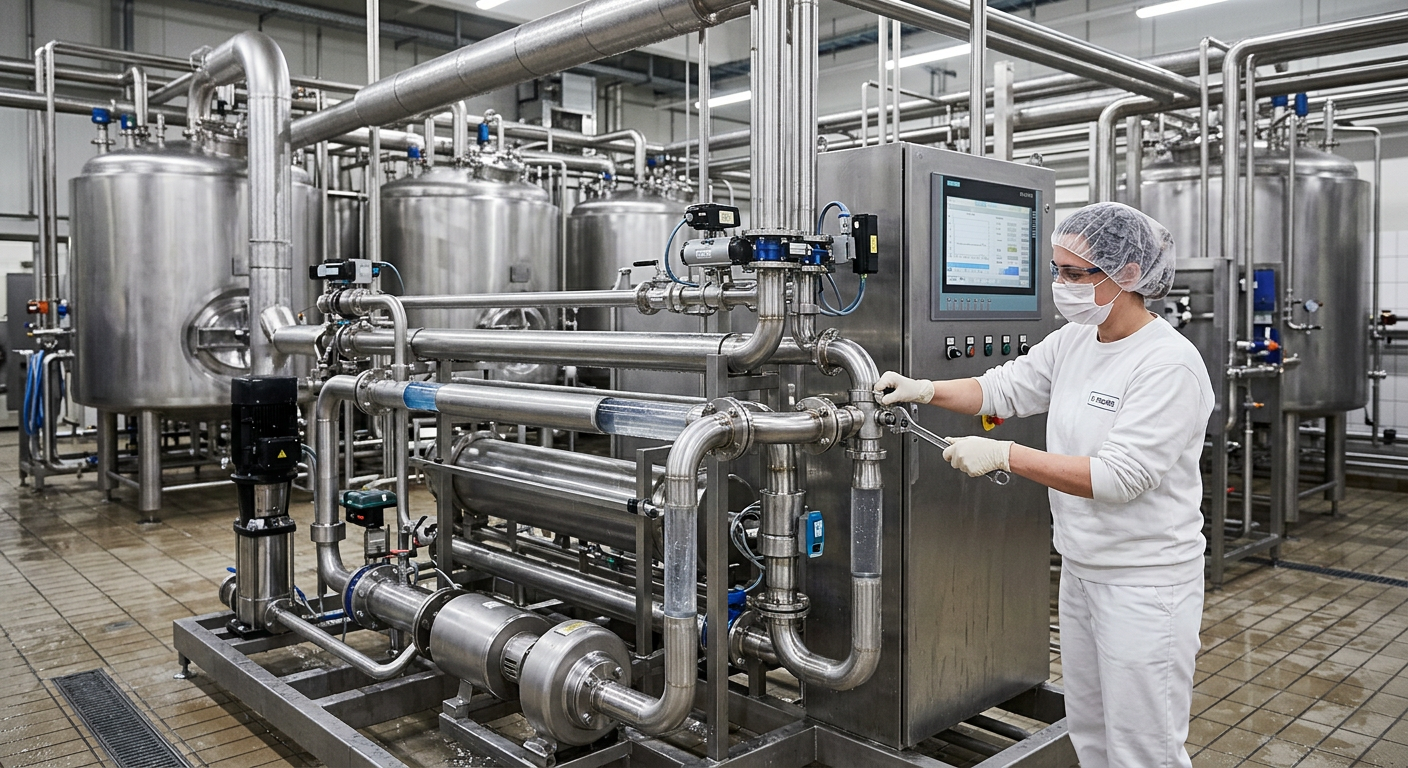
Food Facility Water Conservation Strategies for 2026
[trp_language language=”en_US”]
Water Reduction Strategies for U.S. Food Facilities in 2026
Water conservation is no longer a side project for food and beverage manufacturers in the United States. It is now tied directly to operating cost, wastewater load, compliance risk, utility resilience, ESG reporting, and long-term production planning. From protein plants in the Midwest to dairy processors in Wisconsin, beverage facilities in California, and co-packers near Atlanta, Chicago, Houston, and the Inland Empire, manufacturers are under pressure to make every gallon count.
The strongest water-saving programs in 2026 will not rely on one device or one policy. They will combine water use mapping, better clean-in-place execution, automated flow control, reuse loops, smarter production scheduling, and workforce discipline. Facilities that treat water as a managed production input rather than a fixed utility expense usually find faster payback and more reliable throughput.
For U.S. processors, the opportunity is especially significant in high-rinse, high-sanitation environments such as meat and poultry, dairy, sauces, prepared foods, brewing, RTD beverages, aseptic lines, and contract manufacturing. In these operations, water touches product, equipment, floors, packaging areas, utilities, and wastewater systems. A disciplined approach can reduce overall plant water demand by 10% to 35% depending on the starting point, age of the site, sanitation method, and product mix.
Quick Answer

The fastest way for a U.S. food facility to cut water use in 2026 is to map every major water draw, optimize CIP cycles, install smart flow monitoring, recover reusable process water where allowed, and schedule production to reduce changeovers and sanitation frequency. Most facilities should begin with three actions: verify where water is actually used, stop over-cleaning, and measure results by line, shift, and product family.
In practical terms, that means:
- Installing submetering at utilities, CIP skids, filler rooms, ingredient prep, cook areas, and sanitation drops
- Validating rinse times instead of using fixed historical assumptions
- Using conductivity, turbidity, temperature, and tank-level signals to automate transitions
- Capturing final-rinse or non-contact utility water for approved secondary uses
- Sequencing production from allergen-light to allergen-heavy or from similar flavor profiles to reduce full washdowns
- Training operators and sanitation teams to treat water like a controllable cost center
These strategies are particularly relevant in water-stressed and regulation-sensitive markets such as California’s Central Valley, Southern California, Arizona-adjacent regional supply zones, and parts of Texas. They also matter in manufacturing hubs with rising sewer surcharges or aging utility infrastructure, including New Jersey, Pennsylvania, the Great Lakes region, and the Southeast.
Water Use Mapping in Food Processing

Water use mapping is the foundation of every serious conservation plan. Many plants believe they know where water goes, but utility bills only reveal total consumption. To reduce water effectively, a facility needs a process-level map showing where, when, and why water is consumed.
In food processing, major demand centers typically include ingredient blending, vessel washdown, conveyor cleaning, floor foam and rinse, utensil sanitation, bottle or can rinsing, pasteurization support, boiler makeup, cooling tower makeup, membrane filtration, crate washing, and handwashing stations. In beverage operations, syrup rooms, blending systems, CIP skids, and package line changeovers are often major contributors. In protein and prepared foods, sanitation shifts, thawing, trimming rooms, smoking or cooking support systems, and high-pressure cleanup can dominate usage.
A complete map should break water into at least six categories: product-contact processing, sanitation, utility support, packaging support, employee use, and loss or waste. Losses matter more than many facilities realize. Hidden leaks, failed solenoids, overflowing tanks, stuck spray balls, open hoses, and poorly adjusted automatic fillers can quietly add thousands of gallons per day.
The best mapping projects in the United States often begin with a 30- to 60-day audit period that includes manual observations plus temporary or permanent submeters. This is especially useful in older plants in legacy industrial corridors such as Milwaukee, St. Louis, Philadelphia, and Newark, where utility layouts may have changed repeatedly over the years.
| Water Use Area | Typical Source | Common Waste Point | Measurement Method | Potential Savings | Priority Level |
|---|---|---|---|---|---|
| CIP systems | Municipal or treated process water | Excess rinse duration | Flowmeter plus conductivity | High | Immediate |
| Open hose sanitation | Municipal water | Continuous uncontrolled flow | Timed audit and nozzle flow test | High | Immediate |
| Boiler makeup | Softened or RO water | Blowdown inefficiency | Utility submeter | Medium | Short term |
| Cooling towers | Municipal water | Poor cycles of concentration | Conductivity monitoring | Medium | Short term |
| Package line rinsing | Filtered water | Unneeded rinse during idle | PLC trend review | Medium | Immediate |
| Floor washdown | Municipal water | Cleaning solids with water first | Observation and SOP review | High | Immediate |
| Membrane systems | Process water | Frequent flushing | Pressure and reject trend | Medium | Medium term |
The table above shows why mapping comes first: each area needs a different fix. A plant that skips mapping usually invests in visible hardware while missing the largest behavioral or control-related losses.
For companies planning expansions, relocations, or retrofit work, water mapping should be included in front-end engineering and capital planning. A strong engineering partner can tie process flow diagrams, utility loading, and sanitation needs together before construction. Manufacturers evaluating broader facility strategy can review project and planning capabilities through integrated engineering and project services that align utility design with real production objectives.
CIP System Optimization Opportunities

Clean-in-place systems are often the single biggest controllable water user in food and beverage plants. Many facilities still run CIP programs designed years ago for worst-case conditions, then never revisit them. As a result, rinse times are extended “just to be safe,” chemical concentrations are overused, and tank turnover is poorly sequenced.
In 2026, the most effective CIP optimization programs will focus on validated cleaning rather than assumed cleaning. That means documenting the actual soil load, required turbulence, temperature window, detergent concentration, rinse endpoint, and microbial outcome for each circuit. A dairy plant in Wisconsin will not have the same CIP profile as a kombucha producer in Oregon or a sauce processor near Memphis.
Typical opportunities include:
- Recovering final rinse water for first rinse on the next compatible cycle
- Using conductivity to detect chemical interface points instead of time-only logic
- Shortening post-rinse after verification swabs and quality review
- Separating heavily soiled circuits from lightly soiled ones to avoid over-cleaning all assets
- Improving tank and return line sizing so CIP loops are stable and repeatable
- Automating recipe selection by product family and allergen class
For plants with aging manual or semi-automatic skids, the gains can be substantial. Poorly integrated CIP systems often create hidden downtime, excess hot water use, high sewer volume, and chemical waste. Facilities planning skid replacement, process integration, or utility redesign often benefit from a firm that understands both sanitary process design and field execution. DPS supports these needs through process engineering, controls integration, utility infrastructure, and custom equipment development, including purpose-built CIP systems and related sanitary processing assets. Manufacturers exploring equipment pathways can review food and beverage processing equipment solutions in the context of broader system integration.
| CIP Improvement | How It Works | Water Effect | Quality Impact | Typical Complexity | Expected Payback |
|---|---|---|---|---|---|
| Conductivity-based phase change | Switches steps based on actual fluid interface | Reduces rinse waste | Improves repeatability | Medium | Fast |
| Final-rinse recovery | Stores clean rinse for reuse in first rinse | Cuts fresh water demand | Requires validation | Medium | Fast to medium |
| Recipe-specific cleaning | Matches cycle to soil level and product type | Avoids over-cleaning | Supports sanitation control | Medium | Fast |
| Return-line optimization | Improves hydraulic balance and flow | Shortens cycle times | Better coverage | High | Medium |
| Automated valve sequencing | Reduces operator error and overlap loss | Prevents wasted flushes | More consistent | Medium | Fast |
| Tank sizing review | Matches system volume to actual circuits | Reduces oversupply | Improves cleaning control | High | Medium |
| Inline verification sensors | Uses turbidity and temperature trending | Ends cycles at true endpoint | Supports documentation | Medium | Fast to medium |
This table shows that not every CIP project requires a full skid replacement. Many savings come from controls, validation, sequencing, and reuse logic.
Flow Control and Smart Monitoring
After mapping and CIP review, the next layer is smart monitoring. A plant cannot sustain water savings without visibility. In the United States, more facilities are using flowmeters, pressure transmitters, valve-state logging, tank levels, conductivity probes, and SCADA dashboards to manage water in real time.
Smart monitoring helps answer questions that paper logs cannot. Which line used the most water per pound of product? Which sanitation crew has the lowest gallons per room cleaned? What happens to water use during flavor changeovers? Are weekends or night shifts causing unexplained spikes? Is water consumption rising while production is flat?
Plants with multiple utilities buildings, remote packaging halls, or expansion phases benefit especially from an integrated controls approach. This is where technological capability matters. DPS brings process, mechanical, electrical, plumbing, structural, and controls engineering together with PLC programming, automation, and SCADA, allowing manufacturers to connect water data to production state, alarm logic, and utility performance instead of treating water as a disconnected metric.
In practical use, smart monitoring can trigger low-flow alarms, detect continuous hose use, stop rinse valves when conveyors are idle, and compare actual use against water-per-unit benchmarks by SKU or line family. This matters in large, fast-moving facilities around Dallas-Fort Worth, Los Angeles, Charlotte, and Chicago where minute-by-minute line efficiency can affect both labor and utility cost.
| Monitoring Tool | Best Application | Data Captured | Operational Benefit | Water Savings Role | Ideal User |
|---|---|---|---|---|---|
| Mag flowmeter | Main process branches | Totalized volume | Accurate line accountability | Baseline and KPI tracking | Engineering |
| Conductivity sensor | CIP return and rinse points | Chemical interface | Step control | Shorter rinse times | Sanitation and QA |
| Pressure transmitter | Pumps and wash circuits | System pressure | Detects restriction or overrun | Prevents wasteful operation | Maintenance |
| SCADA dashboard | Plantwide oversight | Real-time trends | Shift visibility | Sustained reduction | Operations |
| Valve-state monitoring | Automated skids | Open/close events | Sequence confirmation | Avoids overlap losses | Controls team |
| Tank-level instrumentation | Recovery and CIP tanks | Volume status | Prevents overflow | Loss prevention | Utilities |
| Temperature sensor | Hot water and CIP loops | Thermal profile | Cleaning validation | Avoids repeated cycles | QA and engineering |
The key lesson from this table is that smart monitoring is not only about collecting data. It is about giving operations, QA, maintenance, and sanitation teams a common factual view of where water is consumed and where controls should change.
Water Recovery and Reuse Systems
Water recovery and reuse is one of the most important 2026 trends, especially where municipal supply cost, drought pressure, or wastewater surcharges are rising. In the United States, reuse strategies must always be aligned with product safety, local regulations, sanitation design, and facility risk tolerance. Not every gallon can or should be reused, but many facilities still underuse safe, non-product-contact recovery options.
Common examples include final-rinse recovery for CIP pre-rinse, cooling water reuse, reverse osmosis reject optimization, condensate recovery, crate washer cascade systems, and non-contact utility water recapture for approved secondary applications. In beverage and dairy operations, water treatment design is especially important because source water quality directly affects process performance and hygienic outcomes.
Manufacturers considering recovery loops should evaluate four questions:
- Is the stream segregated well enough to remain predictable?
- Does the intended reuse avoid product-contact risk unless properly designed and validated?
- Can storage, treatment, and distribution be controlled hygienically?
- Will reuse reduce both fresh water intake and sewer discharge enough to justify capital?
For larger projects, recovery systems often work best when integrated into the broader utility and process design instead of retrofitted late. DPS has experience with complete water treatment and utility integration, including reverse osmosis, disinfection, process water systems, CIP infrastructure, automation, and commissioning. That matters for plants that want reuse without creating operational instability.
| Recovery Stream | Typical Source | Potential Reuse | Risk Level | Required Controls | Best Fit Facilities |
|---|---|---|---|---|---|
| Final CIP rinse | Validated clean rinse water | Next first rinse | Low to medium | Tank segregation and verification | Dairy, beverage, sauce |
| RO reject management | Water treatment skid | Utility or cleaning support | Medium | Quality review and routing logic | Beverage, aseptic, dairy |
| Cooling water | Non-contact systems | Secondary utility use | Low | Loop integrity | Brewing, RTD, prepared foods |
| Boiler condensate | Steam system return | Boiler feed support | Low | Condensate monitoring | Cooked foods, dairy |
| Crate washer cascade | Multi-stage washers | Earlier wash stages | Medium | Stage control and solids management | Beverage and dairy |
| Pasteurizer support water | Closed or semi-closed circuits | Recirculated utility loop | Low | Heat exchanger monitoring | Beverage and canning |
| Non-contact condensate | HVAC or process cooling | Approved cleaning support | Medium | Storage and treatment review | Large mixed-use plants |
This table highlights an important buying point: the best reuse candidate is not simply the largest stream, but the cleanest predictable stream that can be controlled safely and economically.
Production Scheduling for Water Savings
Production scheduling is one of the most underrated conservation tools. Many facilities focus on hardware but ignore the fact that poor sequencing can drive extra cleanouts, additional allergen resets, repeated flavor changeovers, and unnecessary sanitation labor.
In food manufacturing, water use is strongly affected by product order. Running similar viscosities, colors, allergens, seasonings, or packaging formats back-to-back can reduce intermediate rinses and full CIP events. A sauce plant can often schedule from light to dark colors. A dairy beverage plant may run non-allergen items before more complex formulations. A protein processor may group product families by sanitation burden and regulatory handling requirements.
For co-packers and multi-SKU plants near major logistics hubs such as Joliet, Savannah, Kansas City, and the Port of Los Angeles, scheduling must also align with customer deadlines, labor windows, and outbound transport. Even so, there is usually room to reduce water-intensive transitions. That is why water-saving strategy should involve operations, planning, QA, maintenance, and engineering together.
Key scheduling practices include:
- Campaign runs for similar products
- Reduced weekend partial changeovers
- Longer uninterrupted production windows when possible
- Changeover matrices that score both downtime and water impact
- Sanitation planning tied to verified risk rather than habit
- Coordination between syrup rooms, blending, fillers, and utilities
Plants scaling quickly should evaluate whether current scheduling assumptions still fit future throughput. This is especially true for U.S. beverage co-packers expanding from regional to national distribution. A well-designed project can connect process layout, utility routing, automation, and operating model so the site is profitable at startup rather than only at mature volume. For examples of project thinking and execution outcomes, manufacturers can review selected food and beverage project case studies.
The most successful 2026 facilities will link production scheduling with MES, SCADA, and utility trending, giving planners a visible estimate of the water consequence of each sequencing decision.
Employee Training and Conservation Culture
No water conservation program lasts without employee ownership. Technology can identify waste, but people determine whether gains hold. In many plants, hoses are used to move solids that should be dry-cleaned first, valves are left open during pauses, and old sanitation habits continue because nobody has translated utility cost into daily action.
A strong conservation culture begins with simple standards:
- Dry clean before wet clean where food safety allows
- Use trigger nozzles and correct pressure settings
- Never leave hoses running unattended
- Report leaks, overflows, and failed actuators immediately
- Follow validated CIP recipes without adding “extra safety” water on the fly
- Review water performance by shift, room, and line
Training should be role-specific. Operators need to understand startup and shutdown losses. Sanitation teams need visuals showing gallons per task. Maintenance needs leak response standards. Supervisors need scorecards. Executives need monthly water intensity reports tied to cost and throughput.
The cultural side is where many savings programs stall, especially in plants with high turnover or fast expansion. The best practice is to make water visible, measurable, and discussable. Post gallons-per-unit trends on floor boards. Celebrate sanitation crews that meet both microbiological and conservation targets. Include water checks in layered audits.
Leadership style matters too. Teams respond better when the message is operational excellence, not simply restriction. This aligns with the philosophy of partners that approach projects as long-term business improvement rather than one-time installation work. More about company values and approach can be found on the about our team and operating model page.
Measuring and Reporting Water Reduction
Measuring water reduction is how a plant proves value internally and externally. In 2026, reporting expectations are increasing across lenders, large retail customers, enterprise ownership groups, and sustainability frameworks. That does not mean every plant needs a complex public ESG report, but it does mean internal measurement should be disciplined.
The most useful metrics are intensity-based, not just total gallons. Recommended U.S. food facility measures include gallons per pound, gallons per gallon produced, gallons per case, gallons per sanitation hour, and sewer ratio versus incoming water. A plant should also separate planned use from abnormal loss.
Monthly reporting should show:
- Total incoming water
- Production-normalized water intensity
- Top five high-use departments
- CIP water per cycle by circuit
- Water recovered and reused
- Wastewater discharge trends
- Cost savings from conservation projects
- Open corrective actions
| KPI | Definition | Why It Matters | Recommended Frequency | Owner | 2026 Target Range |
|---|---|---|---|---|---|
| Gallons per pound produced | Total water divided by output weight | Normalizes production swings | Weekly | Operations | Down 5% to 15% year over year |
| CIP gallons per cycle | Water used each cleaning cycle | Finds over-cleaning | Per cycle | Sanitation | Validated reduction by circuit |
| Reuse percentage | Recovered water divided by total use | Shows circular performance | Monthly | Engineering | 5% to 20% depending on plant |
| Leak-loss estimate | Unexplained use outside production need | Identifies maintenance gaps | Weekly | Maintenance | Near zero persistent loss |
| Sewer-to-water ratio | Discharge volume versus intake | Tracks wastewater burden | Monthly | Utilities | Stable or declining |
| Water cost per unit | Combined utility spend per sales unit | Shows business impact | Monthly | Finance | Down with verified savings |
| Training compliance | Completed water SOP training rate | Sustains savings | Monthly | HR and plant leadership | 95% or higher |
This KPI table works best when tied to dashboards and regular review routines. Metrics without action owners rarely produce lasting change.
Looking ahead, U.S. policy and market trends will continue pushing this area forward. States facing water stress may tighten reuse and discharge expectations while still supporting efficient industrial investment. Large brands will continue requesting utility intensity data from co-manufacturers. Digital twins, AI-assisted anomaly detection, and integrated utility forecasting will become more common, especially in enterprise networks. Facilities that build good measurement systems now will be far better prepared.
Our Company
Disruptive Process Solutions supports food and beverage manufacturers across the United States and Canada with a practical, profit-focused approach to capital projects. Rather than treating water savings as a stand-alone utility topic, the company integrates conservation into processing performance, sanitation design, automation, and expansion planning.
From a technological capability standpoint, DPS combines process, controls, electrical, mechanical, plumbing, and structural engineering with PLC programming, SCADA, and system integration. That enables water-saving strategies to be built into process logic, CIP recipes, utility load balancing, alarm management, and line performance monitoring. For plants aiming to reduce consumption without compromising throughput or compliance, this multidisciplinary approach is critical.
From a manufacturing capability standpoint, DPS develops and supplies proprietary process equipment including storage and processing tanks, custom CIP systems, marination tumblers, and cooking vessels. That hands-on equipment capability is valuable when standard hardware does not fit the site’s sanitary design, footprint, or utility strategy. In water conservation projects, custom-configured CIP, sanitary routing, and utility-support equipment can make a measurable difference in both consumption and repeatability.
From a service capability standpoint, DPS delivers engineering design, capital planning, feasibility analysis, owner’s representation, project and program management, general contracting where licensed, installation, integration, and commissioning. This allows manufacturers to move from audit to design to execution with one coordinated project structure. The company serves beverage categories such as brewing, spirits, wine, kombucha, dairy beverages, soft drinks, juice, and aseptic processing, as well as food sectors including protein, prepared foods, dairy, sauces, shelf-stable systems, and plant-based manufacturing.
That breadth matters because water conservation is never identical across categories. A poultry facility in Arkansas, a cultured dairy site in Idaho, and an RTD co-packer in Southern California will have different risk profiles, cleanup methods, and utility constraints. DPS is built to adapt project scope to those realities while keeping focus on business outcomes, schedule certainty, and long-term facility performance.
FAQ
What is the first step to reduce water use in a food processing plant?
Start with water use mapping and submetering. Without line-level visibility, most plants misjudge where the biggest opportunities are.
How much water can a typical U.S. food facility save?
A realistic range is 10% to 35%, depending on current practices, CIP maturity, sanitation method, and reuse potential. Older plants with minimal metering may have the largest opportunities.
Are water reuse systems safe in food manufacturing?
They can be, when properly designed, validated, and limited to suitable applications. Recovery should follow facility food safety rules, regulatory requirements, and hygienic engineering best practices.
Which industries usually benefit the most?
Dairy, protein, brewing, RTD beverages, prepared foods, sauces, and aseptic operations often see strong returns because they use frequent cleaning cycles and significant utility support water.
Do I need a full new CIP system to save water?
Not always. Many plants can improve performance through controls upgrades, conductivity-based step changes, reuse loops, recipe validation, and better sequencing before replacing equipment.
How does production scheduling affect water demand?
Poor sequencing increases changeovers, allergen resets, and cleaning events. Better campaign planning often reduces water use with little or no capital spending.
What should be reported to management each month?
Report total water use, water intensity per unit of production, top consumption areas, reuse volume, wastewater trends, CIP performance, leak losses, and project savings.
What 2026 trends matter most in the United States?
Expect wider use of smart sensors, stronger customer sustainability expectations, more reuse evaluation, tighter utility accountability, and greater integration of automation with environmental reporting.
How should companies choose a project partner?
Look for process knowledge, sanitary design experience, utility engineering depth, controls capability, installation execution, and the ability to connect capital spending to long-term operating profit.
Is water conservation mainly a sustainability issue or a cost issue?
It is both. In most U.S. facilities, reducing water lowers incoming utility cost, wastewater charges, heating demand, downtime, and operational risk while strengthening sustainability performance.
[/trp_language]
Complete Company Portfolio

About the Author: Disruptive Process Solutions (DPS)
The DPS team combines process engineering expertise with real-world food and beverage manufacturing experience. Our content focuses on process optimization, production efficiency, facility improvements, and practical solutions that help manufacturers operate more effectively in a rapidly evolving industry.
Share

