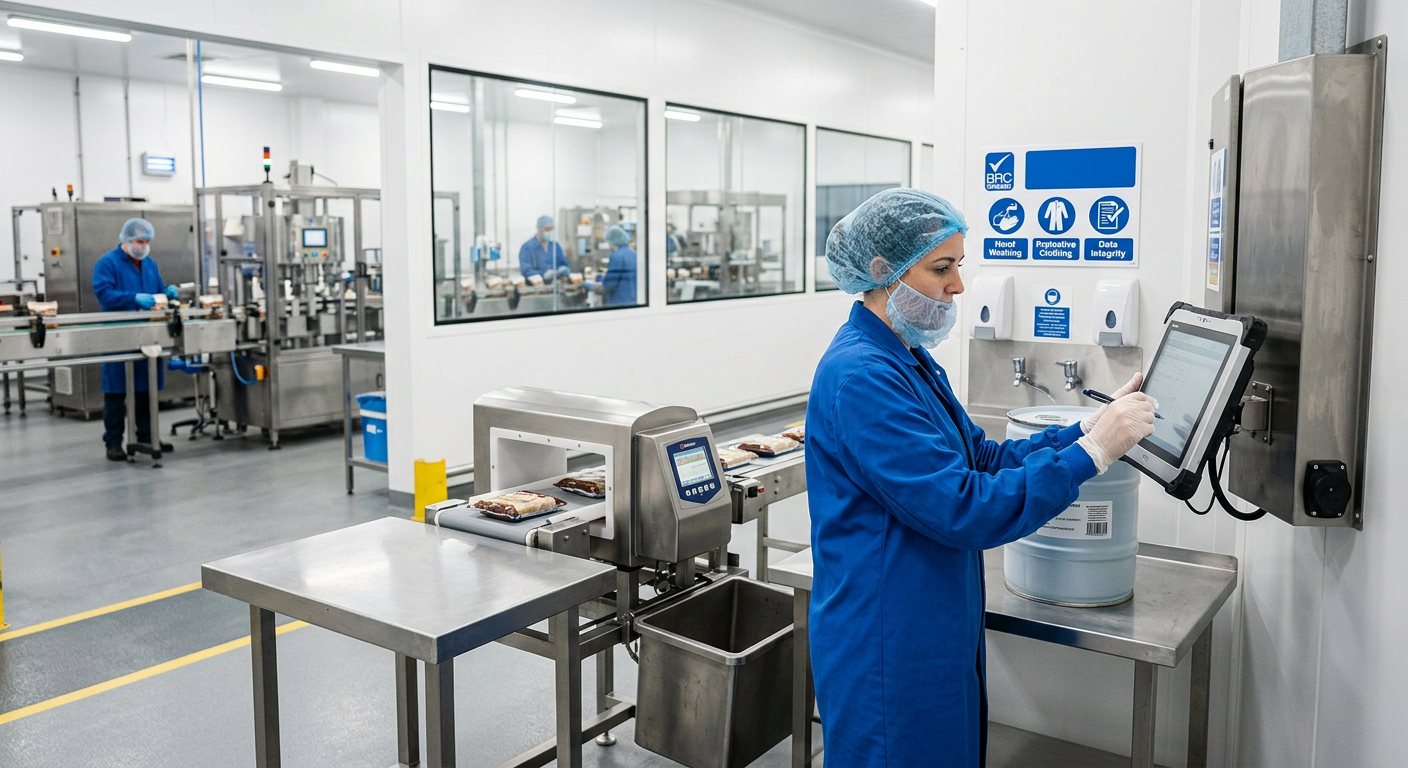
Food Plant Throughput Optimization: OEE and Bottleneck Management Strategies
[trp_language language=”en_US”]
Food Throughput Optimization in the United States
Food and beverage manufacturers in the United States are under constant pressure to increase output without sacrificing food safety, quality, labor stability, or margin. Whether a plant produces protein products in the Midwest, sauces in Texas, dairy in Wisconsin, beverages in California, or aseptic products near East Coast distribution hubs, the central challenge is the same: how to move more saleable product through the facility in less time and at lower total cost. Throughput optimization is not just a plant-floor exercise. It connects maintenance, sanitation, utilities, controls, warehousing, labor planning, capital spending, and customer service.
This guide explains how to improve throughput using practical methods: measurement, Overall Equipment Effectiveness, smarter production scheduling, bottleneck control, automation, faster changeovers, and long-range capacity planning. It is written for operations leaders, plant managers, engineering teams, finance stakeholders, and ownership groups who want to make profitable decisions rather than simply buy more equipment.
Immediate Answer

The fastest path to higher throughput in a U.S. food plant is to identify the true constraint, measure losses around it, improve OEE at that point first, then align scheduling, sanitation, labor, automation, and utility capacity to keep that constraint fed and running. In many facilities, output does not increase because of a single machine purchase. It increases because downtime is reduced, changeovers are shortened, recipes are sequenced more intelligently, utilities are stabilized, and the line is controlled based on real data.
For most manufacturers, the practical order of operations is:
- Measure actual throughput by line, shift, SKU family, and constraint point.
- Calculate availability, performance, and quality losses.
- Confirm the real bottleneck instead of assuming it.
- Stabilize the bottleneck through maintenance, staffing, sanitation, controls, and material flow improvements.
- Reduce changeover time with product family sequencing and pre-staging.
- Automate repetitive or data-sensitive tasks only where the economics are clear.
- Scale utilities, storage, CIP, packaging, and warehouse flow before adding new process assets.
In the United States market, this matters because regional labor shortages, utility volatility, retailer service expectations, and transportation constraints from major trade hubs such as Los Angeles/Long Beach, Houston, Savannah, New York/New Jersey, and Chicago all amplify the cost of lost throughput. A plant that misses production today often misses customer delivery tomorrow.
Buying advice is simple: do not begin with a machine brochure. Begin with measured losses, line balance, and financial impact per constrained hour. Plants that do this well typically gain more output from controls, scheduling, sanitation redesign, and system integration than from isolated equipment replacement.
Throughput Measurement and Analysis

Throughput analysis starts with a precise definition. In food manufacturing, throughput should mean saleable units, pounds, gallons, cases, or batches that exit the system within a given time while meeting quality and compliance requirements. It should not mean theoretical machine speed, nameplate capacity, or short test-run performance. A poultry line in Arkansas, a yogurt plant in upstate New York, and a ready-to-drink beverage co-packer in North Carolina may all report “high capacity,” but their true throughput can differ sharply once sanitation windows, utility interruptions, ingredient staging, allergen changeovers, label changes, and rework are included.
To measure throughput correctly, plant teams should collect data at three levels: process level, packaging level, and site level. Process data tells you what the cookers, fillers, mixers, homogenizers, pasteurizers, or retorts are doing. Packaging data shows whether cartoners, labelers, case packers, depalletizers, palletizers, and conveyors are restricting flow. Site-level data reveals whether refrigeration, compressed air, steam, water treatment, wastewater, or labor handoffs are limiting the whole operation.
The following table summarizes the most useful metrics for throughput analysis and how they should be used in a food plant.
| Metric | What It Measures | Why It Matters | Typical Food Plant Use | Warning Sign | Action Trigger |
|---|---|---|---|---|---|
| Actual Throughput | Saleable output per hour or shift | Shows real production performance | Cases/hour, pounds/hour, gallons/hour | Below weekly plan | Constraint review |
| Cycle Time | Time required per unit or batch step | Identifies pacing of the line | Fill cycle, cook time, retort cycle | Growing over time | Maintenance and controls check |
| Planned Downtime | Scheduled stops | Separates unavoidable from avoidable loss | Sanitation, PM, shift meetings | Excessive sanitation window | SMED and CIP review |
| Unplanned Downtime | Unexpected stops | Directly reduces output | Faults, jams, utility failures | Frequent micro-stops | Root cause analysis |
| Yield | Saleable output versus input | Connects throughput to margin | Protein trim loss, fill loss, batch loss | High giveaway or rework | Recipe and machine tuning |
| Queue Time | Waiting time between steps | Shows imbalance between assets | WIP before filler or packer | Recurring accumulation | Line balancing |
| Schedule Attainment | Planned versus completed production | Measures execution reliability | SKU completion by shift | Chronic misses | Scheduling redesign |
This table is useful because it prevents managers from chasing a single number. A plant can post decent machine speed while still failing in yield, schedule attainment, or unplanned downtime. Throughput improvement should therefore be measured as a system outcome, not just a machine outcome.
In the U.S. market, analysis should also account for external realities. Plants near major ports may see ingredient timing variability; facilities in the Southeast may face seasonal humidity effects on packaging materials; facilities in the Plains and upper Midwest can see labor turnover spikes during harvest cycles; and protein plants under USDA inspection must account for inspection-driven flow constraints. These are not excuses; they are design inputs for a realistic throughput model.
The growth trend above reflects what many manufacturers are already seeing: throughput optimization is increasingly a capital priority because the cost of lost capacity is rising faster than many traditional overhead categories.
Overall Equipment Effectiveness for Food Plants

Overall Equipment Effectiveness, or OEE, remains one of the clearest ways to translate operating losses into action. In food and beverage environments, however, OEE must be adapted carefully. Standard manufacturing formulas are useful, but food plants face sanitation windows, allergen controls, recipe complexity, thermal process validation, and packaging variability that can distort simplistic OEE reporting. A credible OEE program does not hide these realities; it structures them.
OEE combines three elements:
- Availability: how much scheduled time the equipment is actually running.
- Performance: how fast it runs compared with the expected rate.
- Quality: how much output is saleable without rework or discard.
For example, a line may show acceptable quality while still losing output because availability is poor due to changeovers and minor faults. Another line may run continuously but at a reduced rate because operators intentionally slow it down to avoid jams at the downstream case packer. In both situations, OEE makes the loss visible.
The following table shows common OEE loss sources in U.S. food facilities and the operational response each one requires.
| OEE Loss Source | Availability, Performance, or Quality | Typical Root Cause | Common in Which Products | Financial Effect | Best Corrective Action |
|---|---|---|---|---|---|
| Long sanitation cycles | Availability | CIP design, poor access, manual steps | Dairy, sauces, aseptic, beverages | Lost production hours | Sanitation redesign and CIP optimization |
| Frequent minor stops | Availability | Sensors, jams, poor conveyor balance | Packaging-intensive lines | Hidden capacity loss | Fault tracking and controls tuning |
| Reduced operating speed | Performance | Worn parts, unstable feed, operator workarounds | Filling, slicing, portioning | Missed daily output | Line balancing and PM upgrade |
| Overfill or giveaway | Quality | Poor calibration, recipe drift, fill control | Beverages, dairy, sauces | Margin erosion | In-line measurement and tighter control loops |
| Rework from cook variability | Quality | Temperature inconsistency, recipe execution | Prepared foods, proteins | Labor and material waste | Batch automation and thermal verification |
| Changeover start-up scrap | Quality | Late settings, delayed approvals | Multi-SKU plants | Low first-pass yield | Standardized startup checklist |
| Utility instability | Availability/Performance | Steam, glycol, compressed air constraints | Thermal and cold-chain processes | Line starvation or shutdown | Utility capacity audit |
This table matters because it ties OEE losses to practical plant conditions rather than abstract formulas. In food plants, performance loss is often not mechanical alone. It may originate in recipes, raw material variability, washdown practices, packaging supply inconsistency, or utility support systems.
Product type also affects OEE strategy. A retort operation will care about thermal cycle integrity and basket handling. A high-speed beverage line will watch filler, capper, labeler, and packer synchronization. A protein plant may focus on deboning, marination, portion control, chilling, and labor pacing. That is why OEE should be deployed by product family and line architecture, not as a one-size-fits-all dashboard.
As 2026 approaches, plants are increasingly pairing OEE with contextual data from PLCs, SCADA, vision systems, recipe platforms, and utility meters. The trend is toward event-level loss classification that lets engineering, maintenance, and operations solve the same problem with the same timestamps. This is especially important for multi-site manufacturers serving national distribution from hubs such as Dallas-Fort Worth, Atlanta, Columbus, and Memphis.
Scheduling for Higher Output
Production scheduling is one of the most undervalued tools for increasing throughput. Many U.S. plants think of scheduling as administrative, but it is actually a capacity lever. If product families are sequenced poorly, lines will spend too much time on washdowns, allergen transitions, label changes, package size swaps, and raw material re-staging. The result is that expensive process and packaging assets sit idle while teams work around a plan that was never optimized for real plant constraints.
Better scheduling starts with grouping products by shared characteristics: allergen profile, viscosity, flavor intensity, packaging format, thermal process, label family, and cleanability. A sauce plant may sequence from lighter flavors to stronger ones. A dairy facility may move from non-allergen to allergen-containing products. A beverage plant may group by bottle type and cap format before flavor. A protein processor may sequence around raw material freshness windows, labor skill availability, and USDA inspection staffing.
The table below shows scheduling tactics by product type.
| Product Type | Primary Scheduling Driver | Main Throughput Risk | Best Sequencing Logic | Useful Data Input | Expected Benefit |
|---|---|---|---|---|---|
| Ready-to-drink beverages | Package format and flavor change | Frequent line stops | Same bottle and cap, then flavor family | Changeover minutes by SKU | Higher filler uptime |
| Dairy products | Allergen and sanitation control | Extended CIP time | Low-risk to high-risk sequence | CIP validation data | Lower wash frequency |
| Protein processing | Shelf life and labor pacing | Raw material hold time | Freshness-first with labor balancing | Inbound timing and yields | Better usable output |
| Sauces and dressings | Viscosity and color carryover | Flush and clean losses | Light to dark, thin to thick | Flush waste per run | Lower product loss |
| Aseptic products | Sterility window integrity | Restart delays | Long compatible campaign runs | Sterile hold constraints | Reduced setup frequency |
| Frozen prepared foods | Packout and freezer balance | Downstream congestion | Packaging family with freezer capacity | Blast freezer occupancy | Smoother plant flow |
| Co-packing operations | Customer promise dates | Fragmented runs | Hybrid rule: due date plus family sequence | Customer SLA and margin data | Higher service and efficiency |
This table shows why scheduling cannot be separated from product type. Each category has a different constraint pattern, and the wrong sequencing rule can erase a large share of available capacity.
One increasingly important buying consideration is scheduling software. Plants should not buy a platform simply because it promises “AI scheduling.” Instead, they should ask whether it can incorporate sanitation rules, labor skill matrices, allergen logic, utility limitations, and packaging supply constraints. The best solution is often not the biggest software package, but the one that connects most cleanly with ERP, MES, and plant-floor controls.
The demand pattern above reflects where throughput pressures are especially visible in the United States: fast-moving beverage networks, labor-sensitive protein facilities, and co-packing operations serving retailers and brand owners with tight service expectations.
Bottleneck Control Strategies
Bottleneck management is the core of throughput optimization. Every plant has one current constraint, even if several departments feel overloaded. The bottleneck may be obvious, such as a slow filler, retort, cooker, or palletizer. It may also be hidden, such as inadequate CIP turnaround, unstable steam pressure, change-part availability, ingredient thaw time, or a PLC logic issue that limits safe line speed. The mistake many companies make is treating every pain point as equally important.
The correct approach is to identify the step that most limits saleable output over time, then protect, feed, and elevate that constraint. Upstream assets should support it; downstream assets should clear product from it. Labor, maintenance, and scheduling should be biased toward its uptime.
The following table outlines common bottlenecks and the best response strategy.
| Bottleneck Type | Typical Symptom | Where It Appears | Immediate Countermeasure | Longer-Term Fix | Business Impact if Ignored |
|---|---|---|---|---|---|
| Process bottleneck | Batch queue buildup | Mixing, cooking, pasteurization | Stagger upstream release | Add parallel capacity or reduce cycle time | Lost batch volume |
| Packaging bottleneck | Accumulation before packer | Case packing, labeling, palletizing | Increase support staffing | Equipment upgrade and controls balance | Finished goods delay |
| Sanitation bottleneck | Slow startup after cleaning | Dairy, aseptic, allergens | Pre-stage tools and chemicals | Redesign CIP and accessibility | Shift capacity loss |
| Utility bottleneck | Pressure or temperature instability | Steam, glycol, air, water | Load shedding and monitoring | Utility expansion and redundancy | Plantwide speed reduction |
| Labor bottleneck | Line waits for skilled tasks | Changeovers, inspection, packout | Cross-train float team | Work-cell redesign and selective automation | High overtime cost |
| Controls bottleneck | Line cannot exceed programmed cap | Integrated packaging lines | Review setpoints and interlocks | PLC and SCADA reprogramming | Artificial capacity ceiling |
| Warehouse bottleneck | No space to clear output | Cold storage, staging, shipping | Shift trailer timing | Dock redesign and WMS integration | Forced production slowdowns |
This table is a reminder that bottlenecks are often cross-functional. A line may appear mechanically constrained when the real issue is warehouse release timing or utility support. In many cases, especially in older U.S. facilities that have expanded in phases, the limiting factor is not the newest machine but the legacy infrastructure around it.
Case studies across the market show that controls bottlenecks are frequently missed. A plant may be preparing for a multi-million-dollar capacity expansion when the true constraint is logic architecture, recipe handling, or line synchronization. That is why independent assessment matters. Objective engineering review often prevents unnecessary capital spending.
For local supplier evaluation, manufacturers should look beyond OEM service alone. Regional millwrights, controls integrators, utility contractors, stainless fabrication partners, and sanitary piping specialists can all influence bottleneck removal. In trade corridors such as Chicago, Charlotte, the Inland Empire, and the Texas Triangle, speed of access to qualified field support can materially affect project payback.
Automation That Raises Throughput
Automation should be applied where it improves constrained output, process consistency, operator safety, traceability, or utility efficiency. It should not be justified by novelty. In food and beverage manufacturing, the best automation investments usually target repetitive decisions, unstable control points, labor-intensive transfers, and data gaps that cause conservative line operation.
Examples include automated batching with recipe management, in-line Brix monitoring, SCADA-based visibility, PLC logic optimization, vision inspection, automated deboning or cutting support, robotic case packing, palletizing, CIP automation, and energy management tied to process demand. In aseptic and beverage systems, automation can protect sterile integrity and reduce variability. In protein and prepared food operations, it can improve yield, handling, and line balance.
The technological capability side of a strong engineering partner matters here. Plants need expertise across process, controls, electrical, mechanical, plumbing, structural, and utility systems, because automation only produces throughput gains when it is integrated into the whole process. A controls change without process understanding can create new bottlenecks elsewhere.
The trend is clear: by 2026, more plants will combine automation with sustainability and compliance goals. Automated control of water, steam, compressed air, and CIP cycles reduces both operating cost and environmental load. Policy pressure around energy use, wastewater, and documentation will continue to favor systems that can prove performance instead of relying on manual logs.
When evaluating suppliers, ask these questions:
- Can the automation provider work in food-grade, washdown, USDA, and FDA environments?
- Can they integrate with legacy PLCs and existing SCADA instead of forcing full replacement?
- Do they understand process behavior, not just control code?
- Can they support commissioning, operator training, and remote troubleshooting?
- Will they align controls with sanitation, maintenance, and utility limitations?
These questions are particularly important for plants operating multiple product types, such as co-manufacturers and co-packers. Their throughput challenge is usually variability, and variability is where good automation pays best.
Reducing Changeover Time
Changeover time reduction often produces some of the fastest throughput gains because it frees capacity without new square footage. In high-mix U.S. plants, changeovers consume far more time than managers first estimate. The line may stop not only for equipment adjustment, but also for label changes, QA verification, washdowns, ingredient staging, code dating, package component replenishment, and startup checks.
Effective changeover reduction uses a structured method similar to SMED: separate internal steps from external steps, move preparation outside the stop window, standardize parts and settings, color-code tooling, pre-stage materials, digitize checklists, and train crews to a repeatable sequence. Many plants also benefit from simplified product family architecture, which reduces the number of unique adjustments required.
Applications vary by industry. Beverage plants often gain from quick-release handling parts and automated rinse verification. Dairy plants benefit from CIP validation and valve matrix logic improvements. Protein facilities may gain more from tool organization, sanitation zoning, and labor choreography. Prepared food plants often reduce time through recipe sequencing and faster startup approval workflows.
The economic case is straightforward. If a line loses 45 minutes per changeover and performs four changeovers per day, that is three hours of lost capacity every day. On a constrained, margin-rich line, those hours may be worth much more than the cost of most improvement efforts.
To make changeover reduction stick, management should post three numbers by line: average changeover duration, best recorded duration, and percentage of externalized tasks. That keeps the focus on repeatability rather than heroics.
Capacity Planning and Smart Scaling
Capacity planning is where throughput optimization becomes a long-term business strategy. Many manufacturers make one of two mistakes: they underinvest and create recurring congestion, or they overbuild and burden the business with excess capital. Smart scaling starts with demand scenarios, product mix forecasts, utility requirements, labor realities, and distribution strategy.
In the United States, capacity planning must reflect geography. A beverage plant supplying the West Coast through Los Angeles and Oakland faces different freight and water considerations than a Southeastern plant shipping through Savannah or a Midwest protein plant distributing through Chicago and Kansas City. Cold-chain availability, wastewater permitting, labor competition, and energy cost all influence what “capacity” actually means in practice.
The table below helps frame expansion decisions.
| Scaling Decision | When It Fits | Main Advantage | Main Risk | Best Data Needed | Good Example Use Case |
|---|---|---|---|---|---|
| Debottleneck existing line | Constraint is localized | Fastest payback | May expose next bottleneck | Line loss map | Packaging jam reduction |
| Add parallel equipment | Cycle time is physical limit | Clear capacity increase | Utility or labor strain | Utilization by shift | Second mixer or retort |
| Expand utility infrastructure | Support systems are limiting | Plantwide improvement | Benefits can be hidden at first | Steam, air, glycol load profile | Boiler and compressed air upgrades |
| Automate manual process | Labor limits speed or quality | Consistency and throughput | Integration complexity | Labor time study | Robotic packout |
| Build new line in current plant | Demand is sustained | Higher output in same network | Space and traffic conflict | 5-year forecast | New aseptic filler |
| Greenfield or major expansion | Current site cannot scale economically | Best long-term design freedom | Highest capital exposure | Network strategy and market model | New co-packing facility |
| Outsource or co-pack temporarily | Demand spike or startup phase | Flexible market entry | Less control over process | Margin and service model | Seasonal beverage demand |
This table is valuable because it links capacity choices to timing and data. The right answer depends on whether the business needs immediate relief, strategic flexibility, or a large long-term footprint.
Manufacturing capability becomes crucial at this stage. A partner with experience in tanks, CIP systems, processing vessels, line integration, and utility infrastructure can help plants scale coherently instead of adding disconnected assets. For food and beverage facilities, this includes storage and process tanks, cooking vessels, sanitary transfer systems, marination tumblers, blending and batching systems, retort support, pasteurization support, and the utility backbone that keeps them productive.
Service capability matters just as much. Feasibility studies, capital planning, owner’s representation, project management, installation coordination, and commissioning discipline often determine whether a project improves throughput or simply creates expensive disruption. Manufacturers looking at multi-phase growth should prioritize partners who can engineer, build, and manage execution with one accountable model rather than fragmented handoffs. Companies that want that kind of support can review food and beverage engineering services built around end-to-end project execution.
The comparison above shows why many plants should start with debottlenecking, scheduling, and selective automation before moving to full expansion. New lines and greenfield projects can produce major gains, but they also carry the highest complexity and capital exposure.
About Disruptive Process Solutions
Disruptive Process Solutions, often known as DPS, serves food and beverage manufacturers across the United States and Canada with a practical, profit-focused engineering mindset. The company is headquartered in Cary, North Carolina, with a West Coast presence in Lake Forest, California, allowing it to support projects near major manufacturing and distribution corridors on both sides of the country. Rather than operating like a traditional contractor chasing scope volume, DPS is structured to help manufacturers make sound capital decisions and execute them effectively.
From a technological capability perspective, DPS supports process, controls, electrical, structural, mechanical, and plumbing engineering as integrated disciplines. That is important in throughput work because a line problem can begin in PLC logic, recipe control, SCADA visibility, utility instability, or process design rather than in the machine operators can see. The company’s experience spans beverage systems such as brewing, spirits, wine, kombucha, soft drinks, juices, dairy beverages, carbonation, blending, aseptic processing, water treatment, pasteurization, and filling support, as well as food systems for proteins, prepared foods, sauces, dairy, retort, plant-based processing, and sanitary utilities. Manufacturers exploring project fit can learn more about the DPS team and approach.
From a manufacturing capability perspective, DPS also designs and supplies selected process equipment, including tanks, CIP systems, tumblers, and cooking vessels, while integrating broader plant systems around them. That matters because throughput projects often fail when proprietary equipment, third-party equipment, and utilities are not aligned into a single operating strategy. Companies seeking integrated equipment options can review process equipment solutions for food and beverage plants as part of larger capacity or debottlenecking initiatives.
From a service capability perspective, DPS uses a design-build-manage approach that combines front-end planning, engineering, general contractor-style execution, field coordination, installation oversight, and commissioning management. For throughput optimization, that approach reduces the risk of fragmented decision-making. Instead of treating controls, utilities, process equipment, and schedule planning as separate issues, the project can be managed as one business case. A useful example of this philosophy is the type of project where a client expects to spend millions on expansion, but detailed analysis reveals a smaller controls or integration issue that can unlock more capacity at far lower cost. Manufacturers interested in project examples can explore food and beverage case studies for practical context.
For U.S. plants evaluating partners, this business-minded approach is often the difference between a project that looks successful at startup and one that is genuinely profitable 12 months later.
Frequently Asked Questions
What is the first thing a plant should do to improve throughput?
Measure actual output at the real constraint point. If you do not know which step limits saleable output, any improvement plan is mostly guesswork.
Is OEE enough on its own?
No. OEE is a valuable framework, but it must be paired with yield, schedule attainment, utility performance, sanitation time, labor availability, and warehouse flow.
Which industries benefit most from throughput optimization?
Beverages, protein processing, dairy, prepared foods, sauces, aseptic operations, and co-packing all benefit strongly. High-mix and high-speed environments usually see the fastest returns.
What product types typically have the biggest hidden losses?
Multi-SKU beverages, allergen-sensitive dairy, variable-yield proteins, and products requiring frequent label or package changes often carry large hidden downtime and startup losses.
Should we automate before fixing scheduling and changeovers?
Usually no. If sequencing, sanitation, or changeover discipline is poor, automation may only make a flawed system more expensive. Stabilize the process first, then automate the right points.
How do we know if the bottleneck is in controls rather than equipment?
Look for signs such as consistent artificial speed limits, interlock delays, repeated nuisance faults, poor line synchronization, or operator workarounds that cap performance below physical capability.
What local supplier factors matter in the United States?
Response time, sanitary design experience, code compliance, access to skilled trades, and familiarity with regional labor and utility conditions all matter. Plants near major logistics hubs often benefit from deeper support networks.
How should buyers compare vendors?
Compare them on process understanding, integration depth, commissioning support, food safety familiarity, utility knowledge, and ability to connect throughput gains to financial outcomes, not just installation scope.
What are the key 2026 trends?
Expect more AI-assisted scheduling, stronger use of plant-floor data, more integrated SCADA and energy monitoring, tighter documentation for compliance, water and energy optimization, and more selective automation tied directly to labor and margin constraints.
Can a small or mid-sized manufacturer use the same methods as a large enterprise?
Yes. The principles are the same. The scale of tooling, software, and capital changes, but measuring losses, controlling bottlenecks, reducing changeovers, and sequencing intelligently work at every size.
In summary, food throughput optimization in the United States is not about finding one silver bullet. It is about understanding the plant as a system, identifying the true constraint, and improving the business case around that constraint with disciplined engineering and execution. Plants that measure honestly, schedule intelligently, automate selectively, and scale with a full-system view are the ones most likely to gain durable output, stronger margins, and better customer service.
[/trp_language]
Complete Company Portfolio

About the Author: Disruptive Process Solutions (DPS)
The DPS team combines process engineering expertise with real-world food and beverage manufacturing experience. Our content focuses on process optimization, production efficiency, facility improvements, and practical solutions that help manufacturers operate more effectively in a rapidly evolving industry.
Share

