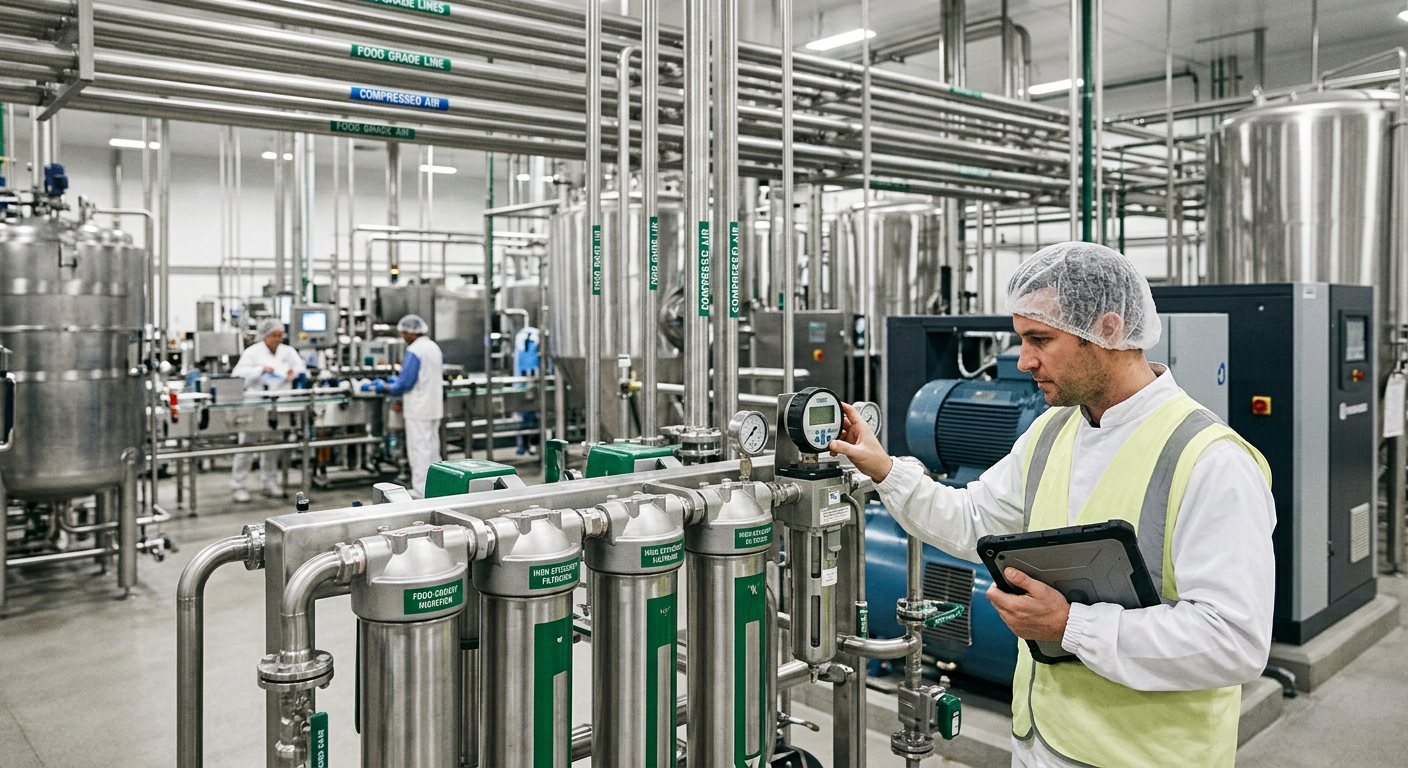
Food Processing Automation Solutions
[trp_language language=”en_US”]
Food processing automation in the United States is no longer limited to high-volume multinational plants. Mid-sized protein processors, beverage co-packers, dairy facilities, prepared foods manufacturers, and aseptic operations are now adopting practical automation to improve throughput, reduce labor strain, strengthen food safety documentation, and protect margins. The most successful approach is not “automate everything at once.” It is to begin with the highest-impact pain points: production visibility, critical control point monitoring, line integration, internal material flow, and data-driven scheduling. From there, plants can scale with confidence using measurable ROI targets tied to uptime, OEE, labor efficiency, yield, and compliance risk reduction.
Across the United States, especially in manufacturing corridors such as Chicago, Charlotte, Dallas-Fort Worth, Atlanta, Fresno, Los Angeles, Kansas City, Minneapolis, and along logistics hubs connected to the ports of Long Beach, Savannah, Houston, and Newark, processors are under pressure to produce more with tighter labor availability and stricter traceability expectations. That is why automation projects increasingly combine controls, SCADA, MES, WMS, ERP connectivity, recipe management, utility optimization, and digital reporting rather than treating each system as a separate purchase.
For buyers evaluating suppliers, the core question is not simply which software or equipment has the most features. The better question is which partner can design, build, and integrate a profitable system around your operational reality. That includes existing utilities, sanitary design, changeover needs, workforce readiness, compliance requirements, and growth targets. Companies that approach automation as part of a broader capital strategy generally achieve better outcomes than those that buy isolated tools without a plant-wide roadmap.
Quick Answer

The fastest way to start a successful food processing automation program is to target one production line or process cell where downtime, manual reporting, quality risk, or labor inefficiency is most visible. In most U.S. plants, the best first opportunities are: real-time digital monitoring, automated HACCP and CCP records, production line integration with MES and ERP, internal logistics coordination, and phased deployment with clear ROI metrics. When these areas are addressed together, processors gain better visibility, faster decisions, improved compliance, and a stronger path to scaling.
In practical terms, automation solutions for food and beverage plants can include PLC upgrades, SCADA dashboards, batch control, in-line quality sensors, CIP automation, historian data capture, recipe enforcement, lot traceability, warehouse scanning, production scheduling, and utility monitoring. These technologies apply across protein, dairy, sauces, RTD beverages, brewing, distillation, plant-based products, and aseptic lines.
| Automation Starting Point | Main Problem Solved | Typical U.S. Plant Benefit | Implementation Difficulty | Payback Speed | Best Fit |
|---|---|---|---|---|---|
| Digital dashboards | Lack of visibility | Faster response to downtime | Low to medium | Fast | All plants |
| Automated HACCP records | Manual compliance logs | Stronger audit readiness | Medium | Fast | USDA, FDA, SQF plants |
| MES integration | Disconnected line data | Better traceability and OEE | Medium | Medium | Multi-line facilities |
| WMS and material tracking | Inventory errors | Less waiting and mis-picks | Medium | Medium | Cold storage, co-packers |
| APS scheduling | Poor production sequencing | Higher asset utilization | Medium to high | Medium | Complex SKU portfolios |
| Full line controls upgrade | Legacy bottlenecks | Higher throughput | High | Variable | Expansion projects |
The table above shows why many processors should begin with visibility and compliance rather than jumping immediately into a full plant overhaul. These first moves often unlock the data needed for larger investment decisions.
Five High-Impact Areas to Begin Your Food Processing Automation Journey

The most effective automation roadmap focuses on business impact, not technology hype. In the United States market, five areas usually deliver the strongest early value.
- Production visibility: operators, supervisors, and plant managers need real-time status on performance, downtime, alarms, changeovers, and throughput.
- Food safety documentation: digital capture of temperatures, cook times, fill weights, pH, conductivity, and sanitation records reduces risk and labor.
- System integration: connecting equipment-level controls to MES and ERP removes duplicate data entry and helps production planning reflect actual plant conditions.
- Internal logistics: raw materials, WIP, packaging, pallets, and finished goods must move in sync with production.
- Scalable implementation: a pilot-first strategy reduces disruption and improves operator adoption.
These priorities matter across product categories. Protein plants often focus on yield, cut consistency, and sanitation verification. Beverage facilities focus on batching accuracy, utility stability, syrup room integration, and filling uptime. Dairy and aseptic processors place stronger emphasis on traceability, batch genealogy, CCP validation, and sterilization records.
When comparing suppliers, buyers should ask whether the integrator understands sanitary process design, local code requirements, controls architecture, utilities, and production economics. A partner with broad process knowledge can usually identify whether the true constraint is equipment, controls logic, material flow, or scheduling. That distinction matters. In some cases, a line thought to need a multimillion-dollar expansion can gain significant capacity from programming changes, better sequencing, or improved bottleneck management.
The chart reflects a realistic market trend: investment in automation continues rising as labor constraints, traceability expectations, and energy costs reshape capital planning. The 2026 outlook is especially strong for modular systems, AI-assisted maintenance, and sustainability-linked controls.
Digital Monitoring: Real-Time Production Visibility from Any Device

Real-time production visibility is often the least controversial and most immediately useful automation step. A digital monitoring layer can pull data from PLCs, VFDs, scales, temperature transmitters, flow meters, filler counters, checkweighers, and utility systems into dashboards visible on control room screens, tablets, or secure mobile devices.
In the United States, facilities with multiple shifts or geographically distributed leadership teams benefit heavily from this capability. A plant manager in Cary can review line status while a corporate operations director in Chicago tracks OEE across several facilities. A maintenance lead in Dallas can see alarm histories without waiting for paper notes from operators. That faster visibility cuts delay between problem and action.
Typical KPIs displayed in digital monitoring systems include:
- Line speed versus target
- Downtime by category and duration
- Waste and giveaway
- Actual versus scheduled output
- CIP cycle status
- Utility consumption per batch or shift
- Alarm frequency and recurrence
- Changeover time
Plants handling refrigerated foods, beverages, dairy, and aseptic products can also use digital monitoring to watch process temperatures, hold times, tank levels, and clean-in-place readiness. This is particularly valuable in high-throughput regions where labor turnover makes tribal knowledge unreliable.
| Visibility Metric | Why It Matters | Manual Tracking Weakness | Automated Source | Primary User | Business Impact |
|---|---|---|---|---|---|
| OEE | Measures productivity | Delayed calculation | MES/SCADA | Operations manager | Better line decisions |
| Downtime events | Finds bottlenecks | Subjective coding | PLC/HMI | Supervisors | Lower lost time |
| Temperature status | Protects food safety | Missed readings | Sensors/historian | QA team | Reduced compliance risk |
| Batch completion | Supports scheduling | Phone calls and delays | Recipe system | Planning team | Higher throughput |
| Utility demand | Controls operating cost | No real correlation | Energy meters | Engineering | Lower cost per unit |
| Changeover duration | Improves scheduling | Inconsistent records | Event tracking | Production lead | More available runtime |
The explanation from this table is simple: every metric listed already exists in the process, but without automation it is usually captured too late or too inconsistently to drive action. A well-designed dashboard converts hidden plant behavior into operational control.
From a technology perspective, the strongest solutions combine controls engineering, PLC programming, SCADA configuration, historian architecture, and secure connectivity. This is where a firm with deep process and controls experience creates value. Integrated engineering and project services are especially important when a processor wants dashboards that connect not only to a single machine but to utilities, batching systems, fillers, packaging lines, and sanitation infrastructure.
HACCP-Compliant Reporting and Automated Critical Control Point Monitoring
Food safety remains a top reason U.S. processors invest in automation. Manual paper logs can still satisfy basic compliance needs, but they are slow, error-prone, difficult to audit, and often disconnected from actual process events. Automated HACCP-compliant reporting and CCP monitoring reduce these weaknesses by capturing data directly from validated instruments and by time-stamping operator interventions.
Examples include cooking temperatures for protein products, retort pressure and lethality, pasteurization hold times, acidification records, metal detection events, fill temperature, pH checks, and sanitation verification points. Automated systems can trigger alarms when limits are exceeded, require acknowledgement, store deviation records, and support lot-level traceback.
This matters in FDA- and USDA-regulated facilities throughout the United States, especially those serving retail, foodservice, private label, and export channels. Plants shipping through hubs such as Houston, Long Beach, and Savannah often face customer documentation standards that exceed minimum regulatory expectations. Digital compliance records improve confidence with auditors, customers, and internal quality teams.
| CCP or Quality Point | Typical Automated Input | Alert Type | Record Output | Audit Value | Applicable Segments |
|---|---|---|---|---|---|
| Cook temperature | RTD/thermocouple | High/low deviation | Batch log | Strong | Protein, prepared foods |
| HTST hold time | Flow and temp sensors | Divert event | Continuous record | Strong | Dairy, beverages |
| Retort cycle | Pressure/temp controller | Process alarm | Electronic chart | Very strong | Shelf-stable foods |
| pH verification | Inline or bench input | Out-of-spec flag | Lot record | Moderate to strong | Sauces, dressings |
| Metal detection | Detector event signal | Reject or failure alarm | Inspection report | Strong | Packaged foods |
| CIP conductivity | Conductivity meter | Cycle exception | Sanitation report | Strong | All hygienic plants |
The main takeaway from the table is that automated reporting does more than replace paper. It creates structured evidence that your process stayed in control and shows exactly what happened when it did not.
For processors considering future policy and customer trends in 2026, this is especially relevant. Food manufacturers are being asked for tighter digital traceability, cleaner sustainability records, and more verifiable quality data. Plants that invest now will be better prepared for retailer scorecards, export documentation, and internal ESG reporting.
Production Line Integration with MES and ERP Systems
One of the most common barriers to plant performance is data fragmentation. Equipment runs one way, quality tracks another way, maintenance records live elsewhere, and finance or planning sees production only after manual updates. MES and ERP integration closes that gap.
At the line level, MES can collect counts, weights, downtime causes, recipe execution, labor assignments, material consumption, and lot genealogy. ERP integration can then connect that data to purchasing, inventory, production orders, costing, customer shipments, and financial reporting. The result is a more accurate view of what the plant actually produced, consumed, and lost.
This is highly valuable in co-packing, multi-SKU beverage operations, proteins, dairy, and prepared foods where schedule complexity is high. Plants near distribution centers in Memphis, Indianapolis, Columbus, and the Inland Empire often feel this pain sharply because customer expectations for fill rates and traceability are unforgiving.
A robust integration program usually includes:
- Order download from ERP to MES
- Material and lot confirmation at line start
- Recipe and setpoint enforcement
- Actual production count and weight capture
- Waste and rework reporting
- Finished goods declaration
- Inventory synchronization
- Electronic production records
The bar chart indicates that beverages and proteins currently show particularly strong demand for automation in the U.S. market, though prepared foods and dairy remain major growth categories as facilities modernize older lines.
On the technical side, integration works best when the project team understands both production operations and underlying infrastructure. That means process engineering, controls logic, utility interaction, and plant expansion planning must be aligned. About the team behind DPS provides useful context on this kind of cross-functional approach, especially for manufacturers looking for an engineering-led partner rather than a software-only vendor.
Internal Logistics Automation: MES, WMS, and APS for Production Scheduling
Many processors automate the line but ignore the movement around the line. That leaves major waste on the table. Internal logistics automation addresses the flow of ingredients, packaging, WIP, pallets, cold storage inventory, and outbound staging. MES, WMS, and APS together create a connected operating model.
MES shows what production is doing now. WMS controls where materials and finished goods are located. APS determines the best order to run products based on capacity, allergens, changeovers, shelf life, labor, and demand. When these systems are coordinated, the plant avoids waiting for missing components, excess changeovers, and avoidable warehouse congestion.
This is critical in the United States for co-manufacturers, refrigerated foods, and beverage plants serving retailers with narrow delivery windows. Plants near major freight lanes such as I-40, I-80, I-95, and cross-border trade routes into Canada and Mexico gain particular value because schedule precision affects transportation cost and service levels.
| System | Primary Function | Key Data Used | Operational Win | Best Plant Type | Common KPI |
|---|---|---|---|---|---|
| MES | Execution on the floor | Line status, counts, lots | Live production control | All multi-line plants | OEE |
| WMS | Inventory movement | Locations, scans, pallets | Fewer mis-picks | Warehousing-heavy sites | Inventory accuracy |
| APS | Scheduling optimization | Capacity, orders, constraints | Shorter changeovers | Complex SKU plants | Schedule adherence |
| Barcode/RFID | Material identification | Item and lot IDs | Stronger traceability | Traceability-focused sites | Scan compliance |
| Yard coordination | Dock and trailer flow | Inbound/outbound timing | Less shipping delay | Large campuses | Dock turnaround |
| Automated staging rules | Prioritized placement | Order, route, shelf life | Faster loading | High-volume DC-linked plants | On-time shipment |
The explanation here is that logistics software is not a back-office add-on. It directly affects how smoothly the production line runs. A mixer cannot produce if ingredients are not staged, and a filler cannot sustain uptime if packaging supply arrives late.
From a manufacturing capability perspective, processors should seek a partner that understands full-system design, not just software screens. That includes batching, blending, fermentation, pasteurization, retort, aseptic handling, grinding, mixing, marination, slicing, dairy processing, and the supporting utility systems required to keep those processes stable. For companies that also need physical hardware, process equipment capabilities can be an important part of the buying decision because tanks, CIP systems, tumblers, and cooking vessels often need to integrate tightly with controls and plant data systems.
Stage-by-Stage Implementation: Analysis, Pilot, Deployment, and Scaling
A phased implementation model is usually the safest and most profitable path. Food plants run continuously, carry compliance obligations, and cannot absorb unnecessary disruption. That makes staged execution more valuable than big-bang deployment.
Stage 1: Analysis. Map the process, identify bottlenecks, define business objectives, document current systems, and collect baseline KPIs. This stage should include utilities, labor constraints, sanitation requirements, maintenance history, and data architecture.
Stage 2: Pilot. Select one line, product family, process cell, or reporting workflow. The pilot should be important enough to matter but contained enough to manage. Common pilot targets include a filler line, a cooking process, a batching room, or digital CCP reporting.
Stage 3: Deployment. Expand across lines, shifts, or departments using lessons from the pilot. Update SOPs, train operators, lock down naming conventions, and create support workflows for QA, maintenance, and planning.
Stage 4: Scaling. Extend into multi-site reporting, predictive maintenance, energy analytics, advanced scheduling, remote support, and broader ERP connectivity. This is also where 2026-ready capabilities such as AI-assisted anomaly detection and sustainability dashboards become realistic.
| Implementation Stage | Main Activities | Decision Gate | Risk Level | Expected Duration | Primary Output |
|---|---|---|---|---|---|
| Analysis | Baseline study, architecture review | Business case approval | Low | 4-8 weeks | Roadmap |
| Pilot | Test on one area | Performance validation | Medium | 6-12 weeks | Proven use case |
| Deployment | Rollout to broader plant | User adoption and uptime | Medium | 2-6 months | Operational system |
| Scaling | Multi-line/site expansion | Standardization approval | Medium | 3-12 months | Enterprise value |
| Optimization | Refine rules and analytics | KPI target review | Low | Ongoing | Continuous improvement |
| Governance | Ownership and support model | Resource allocation | Low | Ongoing | Sustained performance |
This table shows that success depends on decision gates, not just technical installation. Plants that treat automation as a managed transformation typically avoid rework and user resistance.
Service capability matters greatly during staged implementation. A partner that can provide process design, capital planning, owner representation, project management, integration oversight, and installation coordination reduces handoff risk. This is particularly valuable for fast-moving U.S. expansions where local trades, sanitary installation details, and utility tie-ins must be tightly managed. Manufacturers reviewing project examples may find case study insights helpful when assessing what phased execution looks like in the field.
How to Measure ROI: OEE Baselines, Downtime Cost, and Efficiency Targets
Automation projects win internal approval when ROI is measurable and credible. That requires baseline data. Before implementation, document current OEE, downtime losses, labor hours, waste, changeover time, quality holds, utility cost per unit, and compliance reporting effort. Then model how automation will improve those numbers.
ROI usually comes from one or more of the following:
- Increased throughput without new labor
- Reduced unplanned downtime
- Lower giveaway or overfill
- Shorter changeovers
- Less compliance administration time
- Reduced rework and holds
- Lower utility consumption
- Delayed need for major capital expansion
For example, if a beverage line in Southern California loses 45 minutes per shift to recurring stoppages and produces 600 units per minute, the revenue impact can quickly justify better line monitoring and event classification. If a protein plant in the Midwest reduces cook deviation risk and manual documentation labor at the same time, the avoided quality cost may be as important as direct labor savings.
The area chart illustrates the broader trend: U.S. plants are steadily moving from paper-driven and reactive workflows toward digitally managed operations. That shift is expected to accelerate through 2026 as AI-assisted quality analytics and energy monitoring become more accessible.
A simple ROI framework should include:
- Current-state baseline
- Target-state KPI improvement
- Implementation cost
- Support and training cost
- Expected payback period
- Sensitivity range for best and worst case
In buying decisions, ask suppliers to separate hard savings from soft benefits. Hard savings include labor, throughput, downtime, and waste. Soft benefits include audit readiness, customer confidence, and management visibility. Both matter, but they should not be mixed without clarity.
Common Pitfalls: Data Silos, Legacy Systems, and Change Management
Most automation projects fail for organizational reasons before they fail for technical ones. Three pitfalls appear repeatedly in U.S. food and beverage plants.
Data silos: systems are installed by department instead of by process. QA has one platform, maintenance another, and operations a third, with no shared data model.
Legacy systems: older PLCs, HMIs, unsupported software, poor network segmentation, and undocumented logic make integration harder than expected.
Change management: operators and supervisors may resist new workflows if the project is perceived as surveillance instead of support.
Other frequent issues include weak naming standards, lack of historian structure, poor alarm rationalization, unclear ownership after go-live, and underestimating sanitation or production windows needed for installation.
| Pitfall | Typical Symptom | Business Effect | Prevention Method | Owner | Priority |
|---|---|---|---|---|---|
| Data silos | Duplicate manual entry | Bad decisions | Unified architecture plan | Operations + IT | High |
| Legacy controls | Frequent communication failures | Project delays | Front-end audit | Engineering | High |
| Poor training | Low adoption | Weak ROI | Role-based training | Plant leadership | High |
| Weak data governance | Inconsistent tags and reports | Low trust in data | Standards and ownership | Automation lead | Medium |
| No pilot phase | Large-scale rework | Higher cost | Controlled rollout | Project team | Medium |
| Undefined support model | Post-launch issues linger | Performance drop | Service and escalation plan | Management | High |
The lesson from the table is that project governance is as important as equipment or software selection. Plants that front-load architecture review, operator involvement, and support planning avoid many of the most expensive surprises.
This comparison chart highlights a real buying pattern in the United States: manufacturers increasingly favor engineering-led integrators when automation touches process equipment, utilities, sanitary design, and compliance. Software matters, but without process context it may not solve the real bottleneck.
That is where company fit becomes crucial. A practical partner should bring technological capability in PLC, SCADA, controls integration, and system architecture; manufacturing capability across tanks, CIP, cooking, blending, fermentation, pasteurization, retort, dairy, and protein systems; and service capability covering planning, engineering, installation, project management, and execution oversight. DPS is positioned in that intersection, offering a design-build-manage approach intended to connect automation decisions to long-term profitability rather than isolated hardware spending.
FAQ
What is the best first automation project for a U.S. food plant?
For many facilities, digital production monitoring or automated HACCP reporting is the best first step. Both create fast visibility and usually involve less disruption than a full controls rebuild.
How long does a food processing automation project take?
A focused pilot can take 6 to 12 weeks. Broader deployment may take several months depending on line complexity, sanitation windows, validation requirements, and integration scope.
Which industries benefit most?
Protein, beverage, dairy, prepared foods, sauces, plant-based products, aseptic operations, and co-manufacturing all benefit. The exact use case differs by process and compliance profile.
What systems are most commonly integrated?
PLC, HMI, SCADA, historian, MES, ERP, WMS, APS, QA systems, utility meters, checkweighers, filler counters, sensors, and batch control platforms.
Can legacy systems still be automated?
Yes, but they should be assessed early. Some legacy hardware can be integrated with gateways or partial upgrades, while others create enough risk that replacement is the smarter financial choice.
How is ROI measured?
Use baseline OEE, downtime cost, labor hours, waste, quality loss, and utility consumption. Then compare post-implementation performance against those numbers over a defined period.
What should buyers look for in a supplier?
Look for process knowledge, sanitary design experience, controls expertise, project execution discipline, compliance fluency, and the ability to integrate equipment, software, and utilities into one operating system.
Are sustainability and policy trends affecting automation decisions?
Yes. By 2026, more U.S. processors will tie automation to water use, energy intensity, waste reduction, and digital traceability. Those requirements increasingly influence customer approvals and capital planning.
Where can I find a partner for engineering-led automation and process integration?
Manufacturers seeking an end-to-end partner can review food and beverage engineering services to evaluate whether a design-build-manage model aligns with their expansion or modernization goals.
Food processing automation works best when it is treated as an operating strategy, not a technology shopping list. In the United States, where margin pressure, labor constraints, and compliance expectations continue rising, the winning formula is clear: start with visibility, digitize critical food safety records, integrate plant systems, optimize internal logistics, and deploy in stages with disciplined ROI measurement. That approach gives processors a practical path from reactive operations to scalable, data-driven manufacturing.
[/trp_language]
Complete Company Portfolio

About the Author: Disruptive Process Solutions (DPS)
The DPS team combines process engineering expertise with real-world food and beverage manufacturing experience. Our content focuses on process optimization, production efficiency, facility improvements, and practical solutions that help manufacturers operate more effectively in a rapidly evolving industry.
Share

