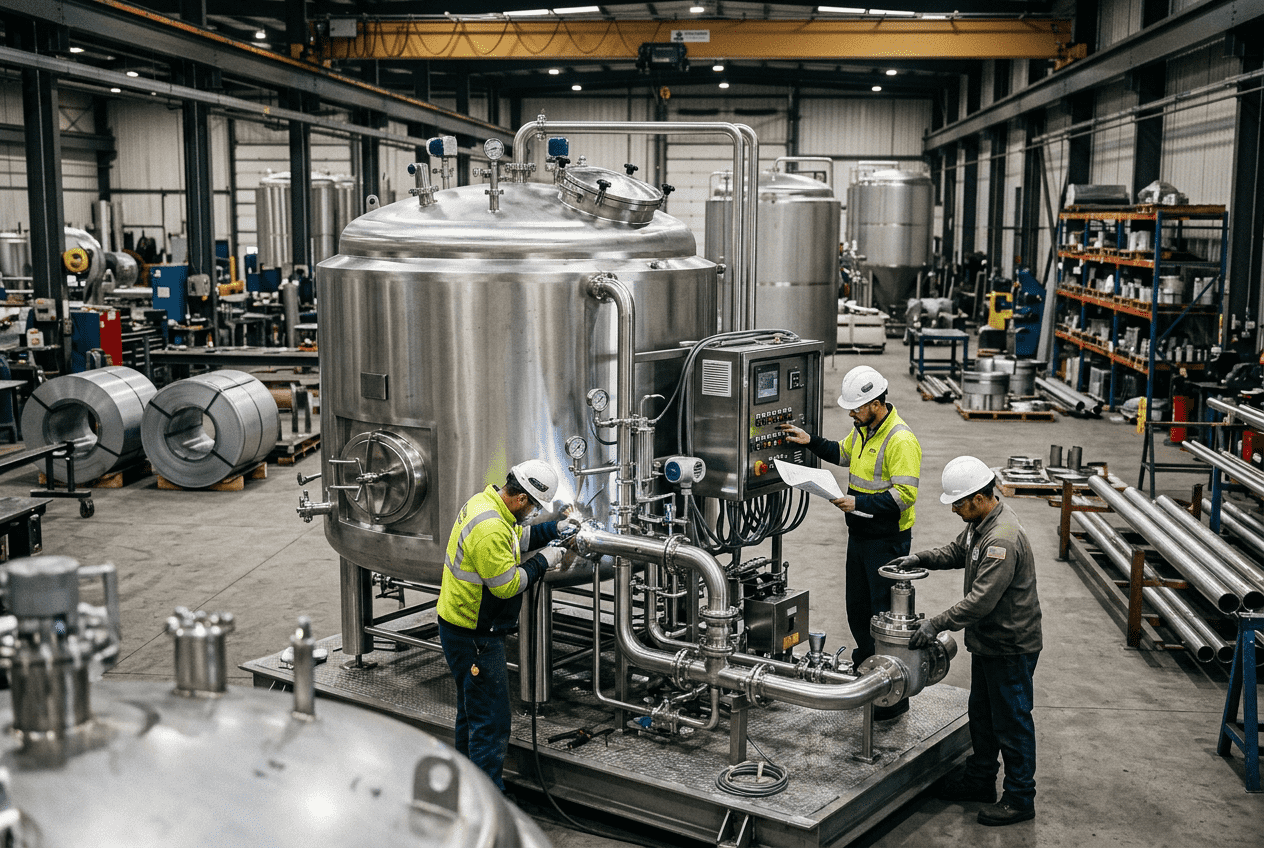
IIoT Implementation for Food Facilities: 5-Phase Deployment Framework
[trp_language language=”en_US”]
Industrial IoT implementation in food and beverage facilities works best when it is deployed in stages. In the United States, the most reliable path is a five-phase model: identify the assets that matter most, install secure edge connectivity, configure dashboards and alarms, activate analytics and AI, and then scale the platform across the plant with ERP and business-system integration. For food manufacturers, this phased approach reduces downtime risk, supports FDA, USDA, SQF, and BRC expectations, and helps operations teams improve yield, maintenance planning, energy use, traceability, and labor efficiency without disrupting production. Whether a plant is running dairy in Wisconsin, sauces in New Jersey, poultry in Georgia, beverages in Texas, or aseptic products in California, the same principle applies: start with the critical process bottlenecks, prove value on a controlled scope, and expand only after the data architecture, cyber controls, and operating workflows are working in real production conditions.
Quick Answer

A practical IIoT implementation for food facilities in the United States should begin with a short discovery process focused on the production assets most likely to create downtime, quality losses, utility waste, or compliance exposure. Typical first targets include pasteurizers, retorts, fillers, boilers, compressors, refrigeration systems, CIP skids, mixers, slicers, homogenizers, and packaging lines. After that, plants should install edge gateways that can collect PLC, SCADA, sensor, and utility data without interfering with validated controls. The third phase is dashboard creation and alert threshold setup so supervisors, maintenance teams, and plant leadership can monitor operating conditions in real time. The fourth phase adds AI and predictive analytics to identify failure patterns, process drift, sanitation anomalies, and energy inefficiencies. The fifth phase connects the deployed solution across the full plant and into ERP, CMMS, batch, quality, and inventory systems.
This five-phase structure is especially important in food and beverage manufacturing because process stability matters as much as data visibility. A poor rollout can create nuisance alarms, overwhelm maintenance teams, or expose regulated operations to unnecessary change control. A disciplined rollout, by contrast, can improve OEE, reduce emergency maintenance, tighten process capability, and create better decision-making from the floor to the executive level.
| Phase | Main Objective | Typical Duration | Primary Team | Key Deliverable | Expected Outcome |
|---|---|---|---|---|---|
| 1 | Asset discovery and sensor planning | 2 to 4 weeks | Operations, maintenance, engineering | Prioritized asset map | Clear business case and scope |
| 2 | Edge gateway and network setup | 3 to 6 weeks | Controls, IT, OT, integrator | Connected data pipeline | Reliable data collection |
| 3 | Dashboards and alert thresholds | 2 to 5 weeks | Supervisors, QA, maintenance | Role-based views and alarms | Real-time operational visibility |
| 4 | AI and predictive analytics | 6 to 12 weeks | Engineering, reliability, data team | Models and anomaly detection | Earlier intervention and better forecasting |
| 5 | Full-plant scaling and ERP integration | 2 to 6 months | Leadership, IT, finance, operations | Enterprise-connected architecture | Plant-wide optimization |
| Ongoing | Governance and continuous improvement | Continuous | Cross-functional steering team | KPI review cadence | Sustained ROI and standardization |
The table above shows why phased deployment is preferred over plant-wide big-bang implementation. Each stage creates a measurable checkpoint, which is especially valuable for operators managing perishable products, short production windows, and strict sanitation schedules.
The growth trend reflects what many manufacturers are seeing across major U.S. processing corridors such as Chicago, Minneapolis, Fresno, Charlotte, Atlanta, Dallas-Fort Worth, and the I-95 Northeast distribution belt: IIoT is no longer a pilot-only concept. It is becoming part of mainstream capital planning.
Phase 1: Discovery and Sensor Planning for Critical Assets

The first phase determines whether the project will create value or just create data. Discovery should start with a plant walkdown, utility review, process mapping session, and downtime history analysis. The team should identify which assets have the largest financial consequence when they fail or drift. In food plants, those critical assets are rarely limited to one production line. Utilities often matter just as much. A boiler upset, ammonia refrigeration issue, low compressed air quality event, or CIP underperformance can affect the whole facility.
For most U.S. manufacturers, the strongest discovery questions are simple: where do we lose throughput, where do we lose quality, where do we lose yield, where do we lose energy, and where do we lose labor hours to reactive work? The answers reveal where sensors should be placed and what data should be captured. For example, a dairy facility in Wisconsin may prioritize temperature stability, separator performance, homogenizer vibration, and CIP conductivity. A beverage co-packer near Los Angeles or Savannah may focus on syrup rooms, blending accuracy, filler efficiency, compressed air, and tunnel pasteurization. A meat processor in Arkansas or North Carolina may prioritize refrigeration, slicing loads, washdown-ready sensors, and sanitation verification points.
Sensor planning must align with the process and the environment. Food plants require careful attention to washdown ratings, hygienic design, chemical exposure, cable routing, enclosure standards, and calibration frequency. It is also important to separate what must be measured continuously from what can be inferred through PLC tags, historian data, or lab results.
| Asset Category | Common Sensor Types | Primary KPI | Business Risk Addressed | Food Sector Example | Typical Priority |
|---|---|---|---|---|---|
| Pasteurizers and HTST systems | Temperature, pressure, flow, valve position | Hold time compliance | Food safety deviation | Dairy, juice, RTD beverages | High |
| Retorts and thermal systems | Temperature, pressure, steam, cycle timing | Thermal process consistency | Underprocessing or overprocessing | Shelf-stable foods, sauces | High |
| Fillers and packaging lines | Vibration, speed, reject count, torque | OEE and uptime | Lost throughput | Bottling, canning, pouches | High |
| Refrigeration systems | Temperature, suction/discharge pressure, power | Energy and reliability | Product spoilage and downtime | Protein, frozen foods, dairy | High |
| CIP skids | Conductivity, temperature, flow, tank level | Cleaning cycle performance | Sanitation failure or excess chemical use | Dairy, beverage, aseptic | High |
| Boilers and utilities | Pressure, fuel use, water quality, steam flow | Utility efficiency | Plant-wide interruption | Most food plants | Medium to high |
| Mixers and blenders | Load, speed, torque, temperature | Batch repeatability | Quality variation | Sauces, dressings, proteins | Medium |
This table matters because it connects measurement strategy to business outcomes. Good sensor planning is never just about instrumentation density. It is about picking the data points that explain downtime, compliance, quality, and cost.
During this phase, teams should also decide whether the first deployment should target one line, one process family, one utility backbone, or a mixed pilot. A mixed pilot is often ideal because it shows both line-level and plant-level value. For example, combining filler monitoring with compressor and boiler visibility can help leadership see the link between utility stability and production throughput.
Phase 2: Edge Gateway Installation and Connectivity

Once the target assets are defined, the next step is secure data collection. In food facilities, edge gateway installation should be designed around plant realities: existing PLC brands, network segmentation, sanitation zones, electrical constraints, and maintenance access. The objective is not to replace controls; it is to collect, standardize, buffer, and transmit data safely.
Many U.S. facilities operate mixed automation environments that include Rockwell Automation, Siemens, Schneider Electric, legacy HMIs, stand-alone skid controls, and OEM-specific panels. That means the gateway architecture has to bridge protocols such as EtherNet/IP, Modbus TCP, OPC UA, Profinet, serial connections, and in some cases analog or pulse-based utility meters. In older facilities around the Midwest and Northeast, retrofit planning may also include cabinet modernization, power conditioning, and industrial wireless links where cabling is difficult.
Connectivity decisions should be made jointly by OT and IT. The best architecture usually includes local buffering at the edge, segmented VLANs or separate OT networks, VPN access controls, certificate-based communication where possible, and a clear policy for remote support. Plants moving product through hubs like Houston, Newark, Chicago, or the Port of Long Beach often have enterprise pressure to centralize data quickly, but speed should never come ahead of cyber hygiene.
| Connectivity Element | Recommended Approach | Why It Matters | Food Plant Consideration | Common Pitfall | Best Practice |
|---|---|---|---|---|---|
| PLC integration | Read-only tag collection first | Reduces control risk | Validated process stability | Writing to live controls too early | Stage permissions by maturity |
| Protocol handling | Use gateway with multi-protocol support | Supports mixed OEM assets | Legacy and new equipment coexist | Too many single-purpose converters | Standardize architecture |
| Network segmentation | Separate OT from enterprise traffic | Improves cyber resilience | Protects production uptime | Flat network design | Use firewalls and VLANs |
| Data buffering | Store data locally during outages | Keeps history intact | Prevents gaps in lot review | Cloud-only assumptions | Buffer at the edge |
| Remote access | Controlled VPN and MFA | Secure support and diagnostics | Useful for multi-site operators | Shared credentials | Role-based access control |
| Environmental protection | NEMA/IP-rated enclosures | Survives washdown and humidity | Critical in dairy and protein rooms | Office-grade hardware on plant floor | Specify industrial hardware |
| Power quality | UPS and conditioned power | Prevents dropped communications | Important in aging facilities | Ignoring voltage instability | Include resilience in panel design |
The choices in this table directly affect long-term uptime. A plant may have excellent analytics software, but if the gateway layer is fragile, data confidence will collapse and users will stop trusting the platform.
At this stage, many manufacturers benefit from an engineering partner that understands both production and controls. A firm that can work across process engineering, automation, utilities, and installation tends to reduce handoff errors. That matters when a project touches equipment rooms, packaging lines, and sanitary process areas at the same time. This is where integrated engineering capability becomes valuable, especially for companies that need structural, mechanical, electrical, process, and controls coordination instead of a narrow software-only deployment.
Phase 3: Dashboard Configuration and Alert Threshold Setup
Dashboards are where data becomes operational behavior. The mistake many teams make is building dashboards for everyone and value for no one. The better approach is role-based design. Operators need live status and actionable alarms. Maintenance needs condition trends, runtime, and failure signatures. Quality teams need process compliance views. Plant leaders need throughput, waste, and labor-impact indicators. Corporate stakeholders need standardized multi-site KPIs.
Alert threshold setup should combine engineering limits, food safety boundaries, statistical process behavior, and business consequences. Not every out-of-range reading requires an alarm. In fact, too many alarms can be as harmful as too few. The goal is to separate informational events from urgent interventions.
In food manufacturing, useful dashboards often include pasteurization temperature profiles, retort cycle verification, filler microstops, compressor load patterns, refrigeration efficiency, CIP performance, giveaway trends, utility cost per unit produced, and sanitation cycle adherence. Plants shipping through large retail and foodservice channels increasingly want these dashboards linked to traceability and lot performance, especially when serving national customers from hubs like Columbus, Kansas City, Phoenix, or Memphis.
| Dashboard User | Primary View | Most Useful Metrics | Alert Type | Response Time | Expected Value |
|---|---|---|---|---|---|
| Line operator | Current machine status | Speed, stop reason, rejects | Immediate machine alert | Seconds to minutes | Faster recovery |
| Maintenance technician | Condition trend view | Vibration, current, temperature, runtime | Predictive maintenance alert | Hours to days | Lower unplanned downtime |
| Quality supervisor | Critical control dashboard | Temperature, hold time, conductivity | Compliance deviation alert | Immediate | Reduced food safety risk |
| Utilities manager | Energy and utilities overview | Steam, air, water, refrigeration load | Efficiency threshold alert | Hours | Lower utility spend |
| Plant manager | Production performance summary | OEE, scrap, labor, throughput | Escalation alert | Shift-based | Better staffing and decisions |
| Corporate operations | Multi-site benchmark view | Yield, uptime, cost per unit | Exception-based alert | Daily to weekly | Standardized improvement |
| Procurement and finance | Asset-cost impact view | Downtime cost, maintenance spend | Trend notification | Weekly to monthly | Smarter capital planning |
The table shows why alerts and dashboards should be configured by function, not by software convenience. A single dashboard rarely meets the needs of every user. Plants that adopt role-based views typically get better user adoption and fewer alarm complaints.
One of the strongest buying recommendations for this phase is to insist on a dashboard design workshop before final configuration. That workshop should define KPI ownership, escalation logic, data quality rules, mobile access needs, and reporting cadence. It is also smart to validate thresholds against two to four weeks of baseline operating data before enabling full alarm routing.
The bar chart highlights where demand is strongest. Beverage, dairy, aseptic, and protein operations tend to move quickly because quality risk, uptime sensitivity, and utility intensity are high. Prepared foods are also active, especially where multi-step thermal and mixing processes make root-cause analysis difficult without data.
Phase 4: AI Activation and Predictive Analytics Deployment
AI should not be turned on just because the software offers it. It should be activated only after the plant has trustworthy data, stable naming conventions, and clear ownership of response workflows. Otherwise, predictive analytics becomes an expensive alert generator with poor credibility.
When implemented correctly, AI can create major value in food operations. It can detect bearing degradation before a filler fails, identify refrigeration drift before product temperatures go out of range, predict CIP deviations before a sanitation cycle is wasted, and uncover utility demand spikes that raise cost per case or cost per pound. In batch processes, it can help identify subtle combinations of process variables that correlate with rework, separation, texture problems, foam instability, overfill, or under-yield.
AI deployment should focus first on use cases where action can actually be taken. Good initial use cases include predictive maintenance for rotating assets, anomaly detection for utilities, process drift monitoring for thermal systems, and batch pattern recognition for high-value products. More advanced applications can then expand into scheduling, labor planning, energy optimization, and digital twin models.
For U.S. manufacturers preparing for 2026, this phase is becoming increasingly strategic. Rising labor constraints, insurance scrutiny, energy costs, and retailer expectations for consistency are all pushing plants to move beyond reactive operations. Sustainability reporting is also influencing deployment decisions, because AI can help document water, energy, and chemical use reductions tied to operational changes.
| AI Use Case | Required Data | Typical First Benefit | Time to Value | Operational Owner | Best Fit Industry |
|---|---|---|---|---|---|
| Motor and bearing failure prediction | Vibration, temperature, current, runtime | Reduced surprise breakdowns | 30 to 90 days | Maintenance | Beverage, dairy, prepared foods |
| Thermal process drift detection | Temperature, pressure, cycle time | Fewer quality deviations | 30 to 60 days | QA and operations | Aseptic, retort, pasteurization |
| CIP anomaly detection | Conductivity, flow, temperature, timing | Less chemical and water waste | 45 to 90 days | Sanitation and utilities | Dairy, beverage |
| Energy peak forecasting | Power, steam, compressed air, refrigeration load | Lower utility cost | 60 to 120 days | Utilities manager | All high-utility plants |
| Yield loss pattern recognition | Batch variables, weight, reject data | Better product consistency | 60 to 120 days | Process engineering | Sauces, proteins, dairy |
| Packaging line microstop analysis | Speed, stop codes, counters, sensors | Higher throughput | 30 to 60 days | Operations and reliability | Bottling, canning, cartons |
| Labor and sanitation timing optimization | Shift data, line readiness, CIP status | Improved scheduling | 90 to 180 days | Plant leadership | Multi-line facilities |
The explanation is straightforward: AI performs best where repetitive patterns, measurable process signatures, and clear intervention paths exist. That is why utilities, rotating machinery, and structured thermal processes often outperform more ambiguous use cases early on.
The area chart illustrates the operational shift now happening across the sector. As we move through 2026, more plants are budgeting for predictive methods because labor shortages and asset age make reactive maintenance increasingly expensive.
Phase 5: Full-Plant Scaling and ERP Integration
After a successful pilot or limited rollout, the value of IIoT increases sharply when the plant connects line data with business systems. Full-plant scaling means standard naming, repeatable device templates, common dashboard logic, cyber governance, and formal ownership of the platform. ERP integration is where operational data begins supporting purchasing, maintenance planning, production accounting, inventory control, and capital allocation.
For many food manufacturers, the highest-value integrations involve ERP, CMMS, MES, batch systems, historian platforms, lab systems, and quality records. For example, if downtime events automatically create maintenance work order context, reliability teams can respond faster and finance teams can see asset cost patterns more clearly. If batch deviations are tied to raw material lots and utility conditions, plants gain better root-cause analysis. If production and utility data feed into costing, leadership gains a better view of margin by SKU or customer.
Scaling across a U.S. plant network also creates benchmarking value. A processor with sites in California, Texas, Illinois, and Pennsylvania can compare performance on common packaging formats, sanitation windows, energy per unit, and utility reliability. That visibility supports better capital planning and more disciplined replication of successful plant practices.
When choosing a scale-up strategy, buyers should evaluate whether the provider understands not just software integration but also the physical realities of plant modifications. Food plants often need instrument additions, control panel upgrades, sanitary support changes, utility tie-ins, and coordinated shutdown planning. A capable deployment partner must be able to bridge engineering intent with installation execution.
This comparison chart shows why many processors eventually favor an integrated deployment model. Point tools may install quickly, and OEM controls can be useful, but plant-wide value usually comes from solutions that combine process understanding, controls integration, installation management, and business-system alignment.
Technical Specifications and Engineering Requirements
Food and beverage plants need technical specifications that reflect both digital and physical requirements. Sensor selection should account for hygienic surfaces, washdown conditions, ambient temperature swings, chemical exposure, and calibration demands. Controls integration should define read/write access, data polling rates, historian retention, timestamp precision, and alarm hierarchy. Network design should address segmentation, gateway hardening, remote access, credential management, and patch strategy.
Manufacturing capability matters here as much as software architecture. Plants often require custom skids, modified utility systems, panel work, fabricated supports, or integrated process equipment changes to make IIoT deployment truly useful. A partner with experience in process equipment, utilities, and field installation can solve bottlenecks that pure software vendors often miss. In many cases, the data problem is tied to a process problem: poor instrumentation on a CIP system, limited access around a tank farm, weak panel layout, or utility instability. Fixing the data layer sometimes means improving the mechanical or electrical layer as well.
From a service perspective, the strongest implementations include front-end feasibility, design support, on-site coordination, commissioning, startup, and post-launch optimization. That service depth is particularly valuable when the project spans multiple trades and the plant cannot afford schedule drift. Companies evaluating partners should look for end-to-end capability rather than isolated consulting.
| Specification Area | Recommended Standard | Engineering Requirement | Food Facility Relevance | Risk if Ignored | Owner |
|---|---|---|---|---|---|
| Sensor enclosure and rating | NEMA/IP fit for washdown zone | Corrosion and moisture resistance | Critical in wet rooms | Premature failure | Engineering and maintenance |
| Data frequency | Match process criticality | High-resolution logging where needed | Needed for thermal and line events | Missed root causes | Controls and QA |
| Gateway redundancy | Local buffering and failover plan | Preserve continuity during outages | Useful for audits and investigations | Historical data gaps | OT and IT |
| Cybersecurity | MFA, VPN, segmentation, audit logs | Secure remote and internal access | Protects uptime and compliance | Operational disruption | IT and plant leadership |
| System integration | Open protocols and documented APIs | Future ERP and CMMS connection | Supports scaling | Vendor lock-in | IT and finance |
| Validation and testing | FAT, SAT, alarm tests, backup checks | Documented commissioning | Important for regulated processes | Unreliable go-live | Project manager |
| Change management | Version control and MOC process | Controlled deployment updates | Protects validated operations | Configuration drift | Engineering and QA |
The explanation is simple: technical specifications are what make a deployment repeatable, auditable, and scalable. Without them, every expansion becomes a custom project and ROI declines over time.
For plants seeking complete plant modernization, it is often useful to align IIoT deployment with broader process improvements such as utility upgrades, control panel replacements, filler expansions, CIP modernization, or sanitary piping projects. That is particularly effective when working with a company that can combine process engineering, project delivery, installation, and equipment integration under one plan. More information on these broader capabilities can be found in the company’s food and beverage engineering services and its process equipment solutions.
Implementation Roadmap and Project Best Practices
The best roadmap for a U.S. food facility is one that ties digital deployment to operational priorities and shutdown windows. In practice, that usually means starting discovery during live production, performing panel and gateway prep off-line, installing in planned maintenance windows, validating data quality before dashboard rollout, and only then enabling AI and enterprise integration.
Best practice number one is to establish a steering team with operations, maintenance, QA, IT, engineering, and finance representation. Best practice number two is to write success criteria before the project starts. Good success criteria may include a defined reduction in downtime, better thermal compliance visibility, a target cut in compressed air waste, or a reduction in emergency work orders. Best practice number three is to train users by role. Best practice number four is to treat naming conventions, data ownership, and cybersecurity as core design tasks rather than afterthoughts.
Procurement teams should also compare local supplier and integrator models carefully. In some regions, a software reseller may be enough for a simple dashboard project. In more complex facilities, especially older plants in manufacturing centers such as Milwaukee, St. Louis, Philadelphia, Fresno, or Houston, it is often better to select a deployment partner with field construction and process integration experience. That reduces the gap between what is specified and what can actually be installed.
As 2026 approaches, policy and sustainability trends are strengthening the business case. Utilities and insurers increasingly reward better monitoring and asset risk management. Water use scrutiny is rising in western states. Energy reporting is becoming more visible in board-level planning. And food manufacturers face growing pressure to make plants both more efficient and more resilient. IIoT, when properly implemented, supports all three goals.
For buyers, the best advice is this: do not purchase an IIoT platform first and then search for a use case. Start with the production and utility constraints that matter most, define the engineering requirements, and choose a deployment structure that can scale. A sound roadmap should connect process, controls, data, installation, and operating behavior.
Our Company
Disruptive Process Solutions supports food and beverage manufacturers across the United States and Canada with an approach built around profitable, well-planned capital execution. Rather than acting as a narrow contractor, the company works as an engineering-led partner that aligns plant improvements with operating realities and commercial goals. That is especially relevant for IIoT projects, where digital visibility only produces value when it fits the actual process, utility infrastructure, and production schedule.
From a technology standpoint, DPS brings expertise across process, controls, automation, PLC programming, SCADA, utilities, and complete system integration. That means sensor planning, gateway connectivity, line integration, and dashboard use can be tied directly to how the facility actually runs. From a manufacturing standpoint, DPS also supports complete processing environments across food and beverage sectors, including dairy, proteins, sauces, aseptic systems, brewing, spirits, RTD beverages, and co-packing operations. The team’s process familiarity helps ensure that IIoT projects do not live in isolation from thermal processing, blending, refrigeration, CIP, compressed air, or packaging performance.
From a service standpoint, DPS operates through a design-build-manage model that supports planning, engineering, installation coordination, execution oversight, and long-term project accountability. That model is valuable for manufacturers that need more than software support and want a partner that can help bridge feasibility, capital planning, implementation, and field execution. Companies interested in learning more can visit about DPS, review broader service capabilities, and explore selected project case studies relevant to processing and plant integration.
For food and beverage operators evaluating long-term modernization, the main advantage of this kind of partner is practical integration. The same organization can help identify whether the bottleneck is instrumentation, controls logic, utility capacity, equipment layout, or operational workflow, and then help execute the right fix rather than forcing every problem into a software-only solution.
FAQ
How long does a food plant IIoT implementation usually take?
A limited pilot can often be completed in 8 to 16 weeks, depending on the number of assets, controls complexity, and shutdown availability. Full-plant scaling can take several additional months.
What assets should be connected first?
Start with assets that create the highest downtime, compliance, utility, or quality impact. In many facilities, that means thermal systems, fillers, refrigeration, boilers, compressors, and CIP skids.
Do older U.S. plants need to replace their PLCs to deploy IIoT?
No. Many plants can start with read-only data collection from existing PLCs and supplement that with new sensors or metering where needed. Replacement is only necessary when legacy limitations block safe integration or long-term reliability.
What industries benefit most from this five-phase model?
Dairy, beverages, protein processing, prepared foods, aseptic operations, and co-packing facilities often see the fastest returns because uptime, sanitation, and utility performance have a direct effect on margin and compliance.
How should alerts be set in a food environment?
Alerts should reflect food safety limits, process capability, equipment health, and actual response workflows. Plants should avoid alarm overload and classify alerts by urgency and ownership.
Can IIoT data integrate with ERP and CMMS systems?
Yes. That is usually part of Phase 5. Good integrations can connect downtime, work orders, maintenance planning, utility usage, batch performance, and cost visibility.
What are the biggest buying mistakes?
The biggest mistakes are buying software before defining use cases, ignoring cybersecurity, skipping data governance, failing to involve maintenance and QA early, and underestimating physical installation requirements.
What should plants expect in 2026?
Expect stronger use of AI for predictive maintenance, higher pressure for sustainability reporting, more focus on utility optimization, tighter cyber expectations, and broader integration between plant-floor data and enterprise decision systems.
[/trp_language]
Complete Company Portfolio

About the Author: Disruptive Process Solutions (DPS)
The DPS team combines process engineering expertise with real-world food and beverage manufacturing experience. Our content focuses on process optimization, production efficiency, facility improvements, and practical solutions that help manufacturers operate more effectively in a rapidly evolving industry.
Share

