-
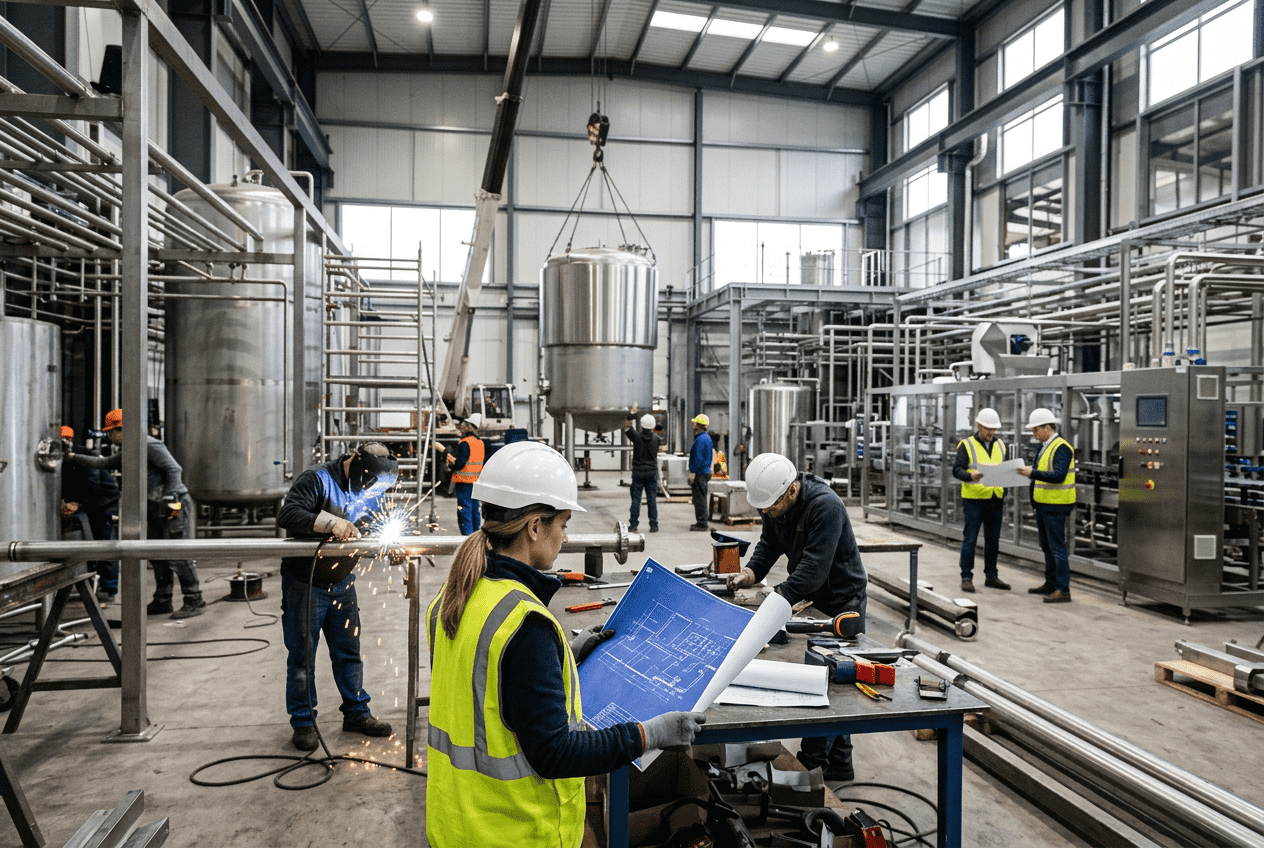
8 Types of Food Plant Conveyor Systems
Food manufacturers in the United States use several conveyor designs to move raw materials, packaged products, trays, totes, cartons, and pallets safely through production. The right choice depends on product fragility, sanitation risk, moisture, temperature, throughput, line layout, and cleaning requirements. In most food plants, the most common categories include belt conveyors, modular plastic belt conveyors, screw conveyors, vibratory conveyors, wire mesh conveyors, chain conveyors, roller conveyors, and pallet conveyors. Each serves a different role, from moving fresh poultry in Arkansas and beef in Kansas to handling bakery goods in Chicago, dairy products in Wisconsin, and bottled beverages moving out of Dallas-Fort Worth or the Port of Savannah. Across the U.S. market, conveyor decisions are no longer based only on speed and footprint. Labor pressure, food safety enforcement, retailer traceability demands, sustainability targets, and automation upgrades are pushing plants to specify conveyors that are easier to clean, simpler to maintain, and better integrated with controls. That is especially true in major food hubs such as California’s Central Valley, the Carolinas, Memphis, Atlanta, and the I-35 corridor in Texas, where production scale and shipping velocity require reliable material flow every day. The fastest answer is this: if a food plant needs a flexible and economical option for packaged or lightly handled products, belt conveyor systems are usually the starting point. If the line needs washdown durability, transfers, curves, and positive drive performance, modular plastic belt conveyors often deliver better long-term value. If the process involves powders, granules, seasonings, or controlled metering, screw and vibratory conveyors are often the better match. For high heat, drainage, cooking, cooling, or direct contact with harsh conditions, wire mesh and chain conveyors are common. For secondary packaging, accumulation, warehouse flow, and end-of-line movement, roller and pallet conveyors are typically the preferred solution. In the United States, the best conveyor is rarely an isolated equipment choice. It is part of a broader processing and utility strategy that includes layout, employee ergonomics, sanitation zoning, automation, maintenance access, and expansion planning. A meat processor near Omaha may prioritize USDA cleanability and raw-to-cooked segregation, while a beverage co-packer in North Carolina may prioritize can handling, line speed, palletizing, and integration with fillers, packers, and warehouse automation. The table below summarizes the main conveyor families used in U.S. food plants and where each typically fits best. In practical terms, most modern plants use several conveyor types together. A facility may receive ingredients through screw systems, process product on modular belts, pass it through wire mesh cooling or cooking conveyors, then transfer packed cases to roller systems and pallets to warehouse lines. This mixed approach is common in U.S. facilities trying to increase throughput without expanding the building envelope. Market demand also keeps rising. Food and beverage processors in the United States are investing in upgrades tied to labor savings, line automation, and sanitary improvements, especially where legacy conveyors are hard to clean or create unplanned downtime. The growth pattern shown above reflects a realistic industry trend: projects are increasingly tied to throughput optimization, sanitary redesign, and labor reduction. Plants near Los Angeles/Long Beach, Houston, and New Jersey distribution corridors are especially focused on keeping product moving efficiently from production to outbound logistics. Belt conveyor systems remain the broadest category in food manufacturing because they can handle many product shapes and package formats. Flat belts, incline belts, cleated belts, troughed belts, and sidewall belts are all variations used in different food applications. In U.S. plants, these systems are common in bakery, snack foods, produce packing, ingredient movement, and secondary packaging. Their popularity comes from simple design, competitive cost, and ease of integration with other equipment. A standard belt conveyor works best when products need stable support across a flat surface. For example, a tortilla plant in Texas may use belts between ovens, coolers, and stacking stations, while a salad processor in California may use incline belts to transfer washed produce from dewatering to packaging. In beverage and prepared food plants, belts are also useful where packages must move smoothly to vision systems, printers, or case packers. Not every belt is appropriate for food contact. Material choice matters. U.S. operators usually compare polyurethane, PVC, fabric, thermoplastic, and specialty hygienic belts based on cut resistance, oil resistance, release properties, and washdown durability. The framework also matters: stainless steel is often preferred in wet or high-care zones, while powder-coated or painted frames may still appear in dry packaging areas. One challenge with traditional belt systems is sanitation around tracking components, pulleys, supports, and hidden catch points. That is why many processors are moving away from legacy enclosed frames with hard-to-reach niches. Newer designs emphasize open construction, fewer hollow members, and faster belt removal for cleaning. Industry demand for different conveyor styles also varies by food segment. The next chart shows how common conveyor demand compares across major U.S. food sectors. Belt systems are often the right fit when budget sensitivity is high and product handling is straightforward. However, if sanitation intensity, curves, or positive engagement become more important, modular plastic belting frequently becomes more attractive. This comparison shows why “belt conveyor” is not one purchase decision but a family of design choices. Plants that treat all belts as interchangeable usually spend more later on sanitation retrofits and maintenance. Modular plastic belt conveyors are widely used in U.S. food processing because they combine good washdown performance with mechanical flexibility. The belt is built from interlocking plastic modules, allowing fast repair by replacing only damaged sections instead of an entire endless belt. This matters in high-throughput operations where downtime is expensive, such as poultry processing in Georgia, seafood in the Gulf Coast region, or prepared foods in the Midwest. These conveyors are especially strong in applications involving curves, transfers, drainage, and positive drive. Open-hinge designs can improve cleanability, while different belt surfaces can be selected for grip, release, airflow, or delicate handling. Plants running wet, oily, or protein-heavy products often prefer modular belts because they tend to hold up well in harsh cleaning environments. Another advantage is configurability. Straight runs, radius turns, incline sections, and spiral arrangements can all be built around production constraints. In a crowded urban facility near Newark or Philadelphia, that routing flexibility may be the only practical way to improve throughput without a building expansion. Still, modular plastic belts are not automatically the right answer. Some products can mark more easily on harder belt surfaces, and some configurations require careful design to avoid pinch points, difficult hinge cleaning, or transfer issues at infeed and discharge. Belt pitch, support wear strips, shaft alignment, and chemical compatibility all need attention. The shift toward modular belts has accelerated as plants replace hard-to-clean legacy systems. The chart below illustrates the trend away from basic legacy conveyors and toward sanitary, modular, and automated conveying platforms. This transition is driven by real operational priorities: shorter cleaning windows, reduced maintenance inventory, safer access, and better compliance with customer and audit expectations. For plants supplying large retailers or national restaurant chains, conveyor cleanability is now a procurement issue, not just an engineering detail. Typical U.S. applications include raw and cooked poultry lines, cheese and dairy handling, bakery cooling, pizza assembly, snack foods, seafood, produce processing, and even some beverage packaging where line routing is complicated. Radius modular systems are also common in facilities trying to make better use of overhead space or narrow floor plans. Screw conveyors and vibratory conveyors serve a different purpose from conventional belts. These systems are often selected for ingredients, bulk solids, dosing, distribution, dewatering, and gentle product movement. In the United States, they appear heavily in flour mills, spice blending, snack seasoning, frozen vegetable lines, dairy ingredient handling, and pet food plants. Screw conveyors move product by rotating a helical screw inside a trough or tube. They are compact and enclosed, which makes them useful for containing dusty or sensitive materials. Sugar, salt, starch, seasoning blends, cocoa, and dry dairy ingredients are common examples. Because they can meter product into mixers, blenders, fillers, or cook systems, they are valuable in controlled recipe environments. However, they can generate shear, heat, or breakage, so they are not ideal for fragile pieces. Vibratory conveyors move product through controlled oscillation. Their big advantage is gentle handling, which helps preserve product integrity for nuts, chips, frozen vegetables, IQF proteins, and delicate snack items. They can also spread product, remove fines, assist cooling, and improve distribution to downstream packaging lanes. In washdown environments, vibratory designs can be easier to inspect than some enclosed alternatives. Processors near major agricultural regions often use a combination of both. For example, an ingredient facility in Kansas may use screw conveyors for flour transfer and vibratory systems for final product distribution. A frozen food processor in Minnesota may use vibratory conveyors after cooking or freezing to maintain separation and reduce clumping. When selecting between the two, the core question is whether the plant needs containment and metering, or gentle product presentation and sanitation access. Often, the answer is both, but in different parts of the line. This table highlights why plants should not evaluate these systems as substitutes in every case. They solve different process problems, and performance improves dramatically when the right technology is matched to the material behavior. Wire mesh and chain conveyors are commonly chosen for demanding environments where heat, drainage, airflow, strength, or direct product support under harsh conditions is required. These systems are often found in U.S. bakeries, frying operations, protein cooking lines, spiral cooling systems, smokehouses, retort support areas, and heavy-duty container handling. Wire mesh conveyors are especially useful where air or liquid must pass through the belt. That makes them ideal for baking, frying, cooling, drying, and freezing. In a large bakery near St. Louis or a protein plant in the Carolinas, wire mesh may be the best option for oven discharge or cooling tunnels where airflow uniformity is critical. Stainless construction also helps in corrosive or wet environments, although product support must be evaluated carefully for small or soft items. Chain conveyors are broader in use. Tabletop chain conveyors are common in beverage packaging for bottles, cans, and jars. Heavy chain conveyors handle totes, trays, crates, and industrial carriers. Dual-strand or multi-strand chain systems can move large loads reliably through washdown and packaging areas. In breweries, dairies, and ready-to-drink facilities, chain-based conveyor platforms are often part of the line architecture around fillers, pasteurizers, and packers. For U.S. manufacturers shipping high volumes through hubs like Atlanta, Columbus, and Southern California, chain systems are also valued for their ability to maintain precise flow in tightly synchronized packaging lines. Still, chain wear, lubrication strategy, and transfer design all require careful planning, especially in hygienic zones. One useful way to compare conveyor families is by performance traits rather than by category names alone. The chart below rates several conveyor families across common buying priorities. The comparison makes the buying logic clearer: wire mesh dominates in high-temperature processing, modular plastic leads in sanitation and routing, and chain excels when load capacity and synchronized handling are priorities. Many projects also combine these systems with thermal equipment, utilities, and controls. In food and beverage plants, conveyor design has to coordinate with ovens, fryers, chillers, freezers, fillers, mixers, and CIP strategies so that the whole process works as one production system. Roller conveyors and pallet conveyors usually operate in secondary packaging, warehousing, and shipping rather than direct raw food contact areas. They are essential for case movement, accumulation, sortation, pallet handling, and end-of-line automation. In large U.S. plants, these systems link case packers, sealers, labelers, palletizers, stretch wrappers, and storage lanes. Gravity roller conveyors are cost-effective for simple manual handling zones. Powered roller conveyors support controlled accumulation and higher line speeds. Pallet conveyors, which may use chain or roller beds, are selected for heavy-load handling in beverage, dairy, protein, and shelf-stable food facilities. These systems are especially common where plants ship through high-volume logistics networks such as Chicago, Memphis, Indianapolis, and the Inland Empire in California. The main design objective is throughput without congestion. If cartons back up unpredictably or pallets queue inefficiently, the plant loses more than time: label quality suffers, forklifts make more interventions, and labor increases. A well-designed roller or pallet conveyor system should reduce touches, improve traffic flow, and create a stable interface between production and warehouse operations. For U.S. beverage producers, pallet conveyor reliability is particularly important because outbound volumes are high and SKU counts keep increasing. Facilities handling cans, PET, glass, and multipacks need carefully tuned accumulation and discharge logic to avoid jams during changeovers or downstream interruptions. This industry matrix shows that application context matters more than a generic equipment label. A conveyor that performs well in beverage packaging may be a poor choice in a raw protein room, even if the speed requirement is similar. Choosing among food plant conveyor systems should begin with process reality, not catalog preference. U.S. buyers should evaluate six core dimensions: product characteristics, sanitation level, line speed, layout constraints, maintenance strategy, and future expansion. Those variables affect cost far more than the initial quote alone. Start with the product. Is it sticky, hot, abrasive, fragile, wet, frozen, dusty, oily, or irregular in shape? Next, define the environment. Is the conveyor in a raw zone, ready-to-eat area, dry room, washdown room, freezer, oven discharge, or warehouse? Then define duty: continuous, intermittent, accumulation-heavy, or batch-fed. Finally, check transfer points, employee access, utilities, controls integration, and spare parts availability in the United States. Another critical buying factor is supplier support. Plants should ask whether a vendor can support installation, controls integration, startup, and troubleshooting across multiple states. For national processors, this becomes essential when lines are replicated in several facilities from California to North Carolina. The table below helps structure a practical buying review. A disciplined selection process usually produces lower lifecycle cost, even when initial capital is slightly higher. That is especially true in facilities where sanitation labor, downtime, and SKU changeovers affect profitability every shift. Case experience across the U.S. shows that many plants first assume they need new mechanical equipment, when the real bottleneck lies in system integration, controls, or line balancing. This is where an engineering-led approach matters. Companies that handle process design, utilities, automation, and physical installation together can often identify capacity gains that a conveyor-only quote would miss. That systems viewpoint is why many manufacturers look for partners that combine process engineering, project execution, and integration support rather than treating conveyors as isolated purchases. Local sourcing strategy also matters. Plants near major manufacturing corridors such as the Midwest, the Carolinas, Texas, and Southern California often benefit from suppliers with regional fabrication, field crews, and startup reach. When evaluating local suppliers, buyers should compare not just equipment price but response time, fabrication quality, sanitary design knowledge, and the ability to coordinate electricians, millwrights, controls programmers, and commissioning staff. This supplier comparison helps buyers align the purchase with project complexity. A simple conveyor replacement and a multi-line sanitary upgrade are not the same type of procurement decision. For plants researching broader project support, it is useful to review a partner’s food and beverage engineering services, look at proven project case examples, and verify whether the team can integrate utilities, controls, and installation around the conveyor scope. Sanitary design is often the deciding factor in modern food conveyor selection. In the United States, FDA expectations, USDA requirements, customer audit standards, and GFSI programs such as SQF and BRC all push processors toward better cleanability and risk reduction. A conveyor that is fast but hard to clean will eventually become an expensive problem. Good sanitary conveyor design starts with open frames, sloped surfaces, minimal harborage points, accessible bearings, suitable weld quality, and material compatibility with cleaners and sanitizers. Hollow tube misuse, exposed threads in product zones, flat surfaces that pool water, and inaccessible belt supports are common warning signs. In high-moisture environments, the ability to dry quickly after cleaning is almost as important as the washdown itself. Washdown requirements vary by zone. A dry snack room in Ohio does not need the same conveyor detailing as a raw poultry room in Mississippi or a ready-to-eat salad line in California. Overdesign raises capital cost, but underdesign raises contamination risk and sanitation labor. The best approach is zone-based specification tied to actual hazard analysis. Technology also plays a bigger role now. Plants increasingly expect conveyors to integrate with sensors, diagnostics, variable frequency drives, and plant-wide controls. In larger projects, conveyor systems are not just mechanical transport; they are connected assets within automation and data strategies. That is why technical capability matters. Teams with experience in mechanical, electrical, process, and controls engineering can align conveyors with PLC programming, SCADA visibility, utilities, and CIP logic instead of leaving those interfaces to chance. Looking toward 2026, three trends are shaping sanitary conveyor decisions in the United States: stronger documentation around hygienic design, wider use of water-saving washdown methods, and more interest in energy-efficient drives and predictive maintenance. Sustainability goals are increasingly tied to sanitation because water, chemicals, and downtime all have cost and ESG implications. For plants planning upgrades, it helps to pair sanitation goals with a broader equipment strategy. Reviewing available processing equipment capabilities can clarify how conveyors should connect with CIP systems, tanks, cookers, utilities, and other production assets instead of being engineered in isolation. Disruptive Process Solutions supports food and beverage manufacturers across the United States and Canada with an approach built around profitable, well-planned capital execution. Rather than acting only as a conveyor seller or a narrow installer, the company works as an engineering and project delivery partner for processors that need complete production thinking. You can learn more about the team and its operating philosophy on the company overview page. From a technological capability standpoint, DPS brings together process, mechanical, plumbing, structural, electrical, and controls expertise. That matters when conveyor projects touch more than material handling. In many U.S. plants, a conveyor change affects utilities, automation logic, batching flow, thermal processes, packaging synchronization, and line visibility. DPS supports integrated design work that can include PLC programming, SCADA coordination, utility planning, and process optimization so the conveyor system fits the whole operation. From a manufacturing capability standpoint, DPS also supports custom equipment fabrication as part of larger plant solutions. Its equipment portfolio includes process tanks, CIP systems, marination tumblers, and cooking vessels, which gives the team practical insight into how conveyors must interface with upstream and downstream production equipment. That manufacturing perspective is useful when plants need customized transitions, sanitary connections, and installation-ready systems rather than generic stand-alone hardware. From a service capability standpoint, DPS operates with a design-build-manage model that helps manufacturers move from concept through execution with fewer handoff gaps. Services can include process engineering and design, capital planning, owner’s representation, project and program management, general contracting where licensed, equipment supply, installation management, integration, and commissioning. For conveyor-related scopes, that means the company can help clients evaluate layout, utilities, sanitary requirements, controls, fabrication, field trades, and startup as one coordinated project instead of a disconnected list of vendors. This model is particularly valuable for food and beverage companies expanding capacity, relocating lines, modernizing legacy plants, or building greenfield operations in U.S. manufacturing centers. Whether the project is a packaging upgrade in the Midwest, a beverage expansion in Texas, or a sanitation-driven retrofit in the Southeast, the aim is the same: make sure capital is spent where it improves long-term plant performance. Looking ahead to 2026, conveyor investments will increasingly be judged by more than equipment uptime. Processors will want line flexibility, faster changeovers, lower water use, stronger hygienic documentation, digital diagnostics, and smarter integration between processing and end-of-line systems. Companies that can engineer, build, and manage across those disciplines will be in the best position to support profitable modernization. What is the most common conveyor used in U.S. food plants?Standard belt conveyors are still the most common overall because they fit many packaged and general product transfer duties. However, modular plastic conveyors are increasingly preferred in wet and sanitary zones. Which conveyor is best for raw meat or poultry processing?Many raw protein plants favor modular plastic belt conveyors or wire mesh conveyors depending on the process step. The final decision depends on washdown intensity, cuts of product, temperature, drainage, and transfer needs. Are screw conveyors sanitary enough for food use?They can be, especially for dry ingredient applications. But they are generally better for enclosed bulk handling than for open, ready-to-eat product movement. Cleanability should be evaluated carefully. When should a plant choose a vibratory conveyor instead of a belt?Use vibratory conveyors when gentle handling, product distribution, dewatering, cooling, or separation is important. They are especially useful for snacks, frozen foods, and fragile products. What conveyor is best for bottle and can lines?Tabletop chain conveyors are widely used in beverage applications because they support precise, high-speed package flow around fillers, labelers, and packers. Roller and pallet conveyors usually take over at case and pallet handling stages. How important is sanitary design in conveyor selection?It is critical. In many U.S. plants, sanitation labor, audit readiness, and contamination risk matter as much as throughput. Poor hygienic design often creates hidden lifecycle costs. Should buyers focus on initial price or total cost?Total cost is the better metric. Cleaning time, downtime, spare parts, labor, and changeover performance often have a larger financial impact than the purchase price alone. How do I know whether I need a local supplier or a full engineering partner?If the project is a straightforward replacement, a local supplier may be enough. If it involves layout changes, utilities, controls, sanitary redesign, or multi-line integration, an engineering-led delivery partner usually provides more value. What are the biggest conveyor trends for 2026 in the United States?Expect more hygienic open-frame designs, predictive maintenance sensors, energy-efficient drives, better water management in washdown, stronger automation integration, and more flexible systems for SKU growth. Can one company handle conveyor integration with broader plant systems?Yes. Many manufacturers prefer a partner that can connect conveyors with processing equipment, utilities, controls, installation, and commissioning so the project performs as a complete production system. -
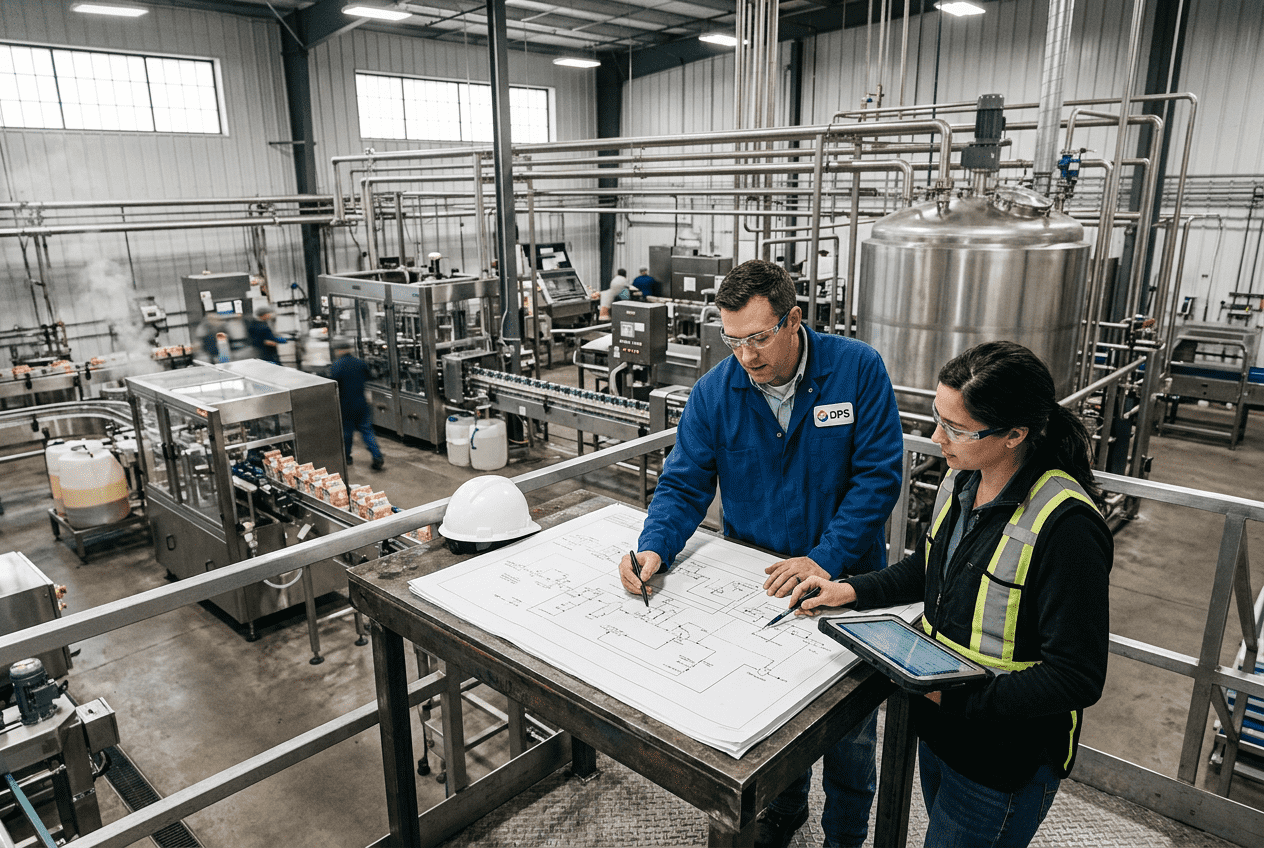
Food Plant Capacity Planning
Food plant capacity planning is the discipline of aligning demand, equipment, labor, utilities, storage, and compliance requirements so a processing facility can meet customer needs at the lowest practical cost and risk. In the United States, that means planning not only for throughput, but also for USDA or FDA oversight, retailer service expectations, labor availability, sanitation windows, energy constraints, and seasonal demand swings across regions such as the Midwest, Southeast, Texas, California, and the Northeast. For food and beverage manufacturers, strong capacity planning answers a practical question: can the plant make the right product mix, in the right quantities, at the right time, without sacrificing quality, food safety, or margin? Whether the operation produces sauces in Chicago, aseptic beverages near Charlotte, poultry in Arkansas, dairy in Wisconsin, seafood in the Pacific Northwest, or prepared meals in Texas, the planning framework is the same: understand constraints, forecast demand, calculate true line capacity, improve utilization, and invest capital only when operations data supports it. The quick answer is simple. Food plant capacity planning is the process of determining how much product a facility can safely and profitably produce, then matching that capability to market demand. It covers line speed, changeovers, sanitation, uptime, staffing, warehouse space, ingredients, utilities, and future growth. In the U.S. market, the best plans are built around three realities. First, nominal machine speed is not the same as true plant output. Second, bottlenecks often sit outside the obvious processing step, such as packaging, CIP timing, cold storage, steam generation, PLC logic, or labor coverage. Third, profitable growth usually comes from improving flow and utilization before buying new equipment. For buyers, operators, and investors, this matters because capacity mistakes are expensive. Underbuilding leads to missed orders, expedited freight, overtime, and retailer penalties. Overbuilding ties up capital in underused assets and oversized utility systems. A disciplined capacity plan protects cash while giving the plant a clear path from current production to future expansion. Across the U.S., manufacturers increasingly use phased expansion models. A new co-packing plant near Atlanta or Dallas may be designed for a first operating year volume and then engineered with room to scale utilities, tankage, or packaging lines later. That approach is especially valuable in categories such as RTD beverages, protein snacks, fermented products, sauces, dairy, and shelf-stable foods. The table above shows why capacity planning is broader than equipment sizing. It combines market demand, production engineering, operations management, and capital discipline into one decision framework. Food plant capacity planning in the United States sits at the intersection of market volatility and operational complexity. Demand can change quickly because of retailer promotions, private-label wins, foodservice recovery, export activity through ports such as Savannah, Houston, and Long Beach, or weather-driven spikes in categories like beverages, frozen foods, and grilling proteins. At the same time, production is constrained by sanitation rules, shelf-life requirements, cold-chain limits, allergen segregation, packaging availability, and workforce scheduling. A useful way to think about it is in layers. The first layer is market capacity: the sales forecast by customer, region, and product family. The second is production capacity: what each line, room, or utility system can truly support. The third is business capacity: what the company can fund, staff, maintain, and manage without eroding profit. Product type matters. Beverage plants often focus on syrup rooms, blending, carbonation, tunnel pasteurization, filler speeds, labelers, and palletizing. Protein processors may be constrained by deboning, marination, smoking, cooking, chilling, slicing, or packaging. Dairy plants must coordinate homogenization, separation, fermentation, filling, and refrigerated storage. Retort and aseptic facilities need balanced sterilization, holding, filling, and package integrity systems. In every case, capacity planning must reflect the specific process path. From an industry standpoint, the highest pressure categories in recent years have included ready-to-drink beverages, value-added proteins, contract manufacturing, plant-based products, sauces and dressings, and better-for-you convenience foods. These sectors tend to combine growth with SKU complexity, which makes line balancing and scheduling more difficult. For plant leaders comparing partners, buying advice is straightforward: choose an engineering and integration firm that understands both process and business economics. Capacity projects affect ROI, utility loads, layout, staffing, automation, and expansion sequencing. A good partner should be willing to challenge assumptions, not simply approve oversized capital requests. Manufacturers evaluating strategic support can review the company background of DPS to understand how an engineering-led, profit-focused approach differs from conventional project execution. Local supplier ecosystems also influence planning. Midwest processors may rely on packaging and ingredient networks around Chicago, Milwaukee, and Minneapolis. Southeast beverage and food producers often leverage freight and labor access around Charlotte, Atlanta, and the Port of Savannah. Texas operators benefit from strong industrial support in Dallas-Fort Worth and Houston. California processors often optimize around Central Valley agriculture, Los Angeles logistics, and the Port of Long Beach. A strong capacity plan accounts for these local supply realities, not just internal equipment limits. Most food manufacturers use one of three capacity planning strategies: lead, lag, or match. The right choice depends on growth confidence, customer commitments, available capital, and operational risk tolerance. A lead strategy adds capacity before demand fully arrives. This is common when a processor expects a major retail launch, a new co-pack contract, or a regional expansion. It reduces the risk of stockouts and creates room for scale, but it requires confidence in demand and access to capital. A lag strategy adds capacity only after demand has clearly materialized. This protects cash and avoids underused assets, but it can strain service levels, increase overtime, and delay onboarding of new business. A match strategy adds capacity in planned increments as signals become clearer. For many U.S. food plants, this is the most balanced approach, especially when utility systems, floor space, or controls architecture are designed for phased expansion. The most successful U.S. projects often blend these strategies. For example, a beverage site near Raleigh may install utilities, tank pads, and controls infrastructure for future fillers, while only purchasing one filling line in phase one. A protein plant outside Kansas City may add chilling and packaging in stages while using schedule optimization first. A California sauce facility may reserve floor space, drainage, and CIP routing for later kettles rather than overbuilding from day one. That is also where experience matters. DPS is known for approaching projects as a business-minded operations partner rather than a volume-driven contractor. In practice, that means helping clients determine whether the best next move is new equipment, line reprogramming, relocation, utility upgrades, or layout redesign. Manufacturers exploring this kind of support can review engineering and project services to see how feasibility, design, installation, and execution align around profitability. This line chart illustrates how U.S. food manufacturers are steadily increasing investment in data-driven planning, automation, and capacity visibility. The 2026 outlook is especially strong as labor constraints, retailer service expectations, and sustainability reporting push plants to improve planning sophistication. Capacity calculation starts with a baseline formula, but it must be adjusted for real operating conditions. The basic formula: Effective capacity = Rated speed × Available time × Performance factor × Quality factor. For example, if a line is rated at 10,000 units per hour, runs 16 scheduled hours per day, loses 2 hours to sanitation and changeovers, performs at 88% of rated speed, and delivers 98% good product, daily effective capacity is: 10,000 × 14 × 0.88 × 0.98 = 120,736 saleable units per day. That is the number management should use for planning, not the brochure speed. In food processing, the gap between theoretical and effective capacity can be large because of clean-in-place cycles, allergen washdowns, cook or cool dwell time, packaging material swaps, code date changes, and product viscosity differences. The explanation behind this table is critical: each step removes another layer of assumption. Plants that skip steps three through six almost always overestimate output. Another best practice is to calculate capacity at four levels: equipment, line, department, and site. A cooker may support 8,000 pounds per hour, but if packaging only clears 6,500 pounds, packaging is the real capacity. Likewise, a filling line may handle more volume, but warehouse cooler space or blast chilling may limit daily release. Applications vary by process: Case work often reveals that the cheapest capacity increase is hidden in controls or sequencing. One example from the industry involved a manufacturer planning a multi-million-dollar expansion for only a modest output gain, only to discover that programming logic and operational sequencing, not major equipment shortage, were constraining throughput. After reworking controls and line logic, capacity improved without the original capital burden. That type of diagnostic discipline is one reason manufacturers seek integration partners that combine process engineering with automation and project execution. Seasonality is a defining issue in U.S. food manufacturing. Beverage demand often climbs before summer. Baking ingredients rise ahead of holidays. Sauces and proteins can surge before grilling season. Dairy and school-related products may shift with academic calendars. Co-packers frequently experience promotions tied to retailer resets or regional launches. Capacity planning for peak and off-peak periods requires more than a bigger forecast. It requires scenario-based decisions on inventory, labor, packaging procurement, utility loads, and sometimes outsourcing. Plants near major freight corridors such as I-35 in Texas, I-95 in the Southeast, and the Inland Empire in California must also account for transportation constraints during peak shipping periods. The table shows that slow periods are not idle periods. They are the right time for preventive maintenance, line trials, training, facility work, and system upgrades. Plants that treat off-peak time as strategic preparation usually outperform during the next demand spike. In buying terms, this is also when flexible equipment and modular layouts pay off. Portable tanks, scalable CIP skids, spare filler heads, dual-use utilities, and configurable automation can help plants serve both peak volume and high-mix, lower-volume periods. Manufacturers evaluating processing hardware can explore process equipment options with an eye toward flexibility rather than just maximum nameplate speed. The area chart highlights a realistic seasonal pattern for many mixed-category U.S. plants: a rise into summer, stabilization in late summer, and renewed demand in holiday-related periods. The exact shape varies by category, but the planning logic remains the same. Utilization benchmarks must be interpreted carefully. Running at 95% utilization may sound efficient, but it often leaves too little room for maintenance, schedule changes, trial runs, or customer volatility. In food manufacturing, a healthier target usually depends on process type, SKU complexity, and perishability. These benchmarks are useful because they reflect sustainable operations, not theoretical maximums. Plants with complex sanitation or frequent pack format changes may intentionally target the lower end. Highly standardized facilities with stable demand and strong maintenance practices may operate at the upper end. The right target is the one that supports service, quality, and profitability together. Benchmarking should also include utilities. A line operating at 80% may still be overloading steam boilers, refrigeration, compressed air, or wastewater handling. This is especially common in older facilities in legacy industrial zones where the process line has been upgraded multiple times but site infrastructure has not kept pace. This bar chart compares likely capacity expansion pressure across major food and beverage categories. RTD beverages, protein, and prepared foods remain particularly active because they combine growth, promotional variability, and ongoing need for operational flexibility. OEE, or overall equipment effectiveness, is one of the best tools for unlocking capacity before spending capital. It combines availability, performance, and quality into a single operating metric. In food plants, OEE improvements often come from better changeovers, fewer micro-stops, tighter startup procedures, stronger preventive maintenance, smarter controls, and more disciplined production scheduling. Many facilities assume they need more equipment when they actually need better synchronization. A filler may wait on depalletizing. A cooker may wait on packaging. A retort may sit idle because of operator handoff timing. A marination system may be constrained by downstream chilling or case packing. When OEE is reviewed line by line and shift by shift, these hidden losses become visible. Common no-new-equipment gains include: This is where technological capability becomes essential. DPS supports projects that blend process engineering with controls, PLC programming, automation, and SCADA integration. Those capabilities matter because capacity is often limited by how systems communicate, not just by how fast individual assets can run. The company also works across utilities such as CIP, steam, compressed air, refrigeration, water treatment, and energy systems, which are frequently the hidden ceiling on throughput. Manufacturing capability matters as well. In both food and beverage environments, projects may include tanks, custom CIP systems, marination tumblers, cooking vessels, blending and batching systems, fermentation vessels, pasteurization systems, retort integration, and utility infrastructure. Capacity planning becomes far more accurate when the engineering team understands how those assets operate together in the field, not only on paper. For proof-oriented buyers, the most useful question is not “What is the equipment speed?” but “What output improvement can be achieved through debottlenecking before new equipment is purchased?” Real project examples often show meaningful gains through logic, flow, and layout changes. Labor is a core part of plant capacity. Two facilities with the same equipment can produce very different output depending on operator skill, maintenance coverage, sanitation execution, and supervisory consistency. Workforce capacity planning should therefore include headcount, skill depth, cross-training, absenteeism risk, onboarding speed, and schedule flexibility. The table explains why labor planning should be treated as a capacity lever, not just an HR issue. A packaging line with enough machinery but inconsistent staffing does not have secure capacity. For many U.S. plants, the winning approach is a mix of stable core labor and flexible surge options. That may include staggered start times, weekend crews, relief operators, or cross-trained mechanics who can support both process and packaging assets. Plants in competitive labor markets such as Southern California, Dallas-Fort Worth, or central Florida must be even more deliberate about retention and training because replacement cycles directly affect line performance. Service capability also matters here. DPS supports clients with capital planning, feasibility studies, owner’s representation, project management, general contracting where licensed, turnkey installation, and system integration. That broader service model helps workforce planning because line changes, utility modifications, controls updates, and schedule impacts can be managed as one coordinated project rather than fragmented work packages. Manufacturers interested in how integrated execution translates to plant results can explore project examples and case work showing how planning, engineering, and implementation connect in practice. Technology is now central to capacity planning. ERP systems provide demand, inventory, purchasing, and order visibility. MES platforms capture production data, downtime, yield, and genealogy. Advanced planning systems help model finite capacity, constraints, and scenario scheduling. Together, they give plants a more truthful picture of what can be made and when. The most important point is integration. If ERP says demand is rising, but MES shows persistent downtime and the maintenance system shows overdue work orders, leadership gets a much more realistic picture of expansion readiness. By 2026, more U.S. food manufacturers are expected to connect these layers with stronger analytics, energy monitoring, and sustainability reporting. Future trends shaping 2026 capacity planning include: The comparison chart illustrates a common buying reality: integrated partners usually create more value in planning-heavy capacity projects than fragmented supplier networks, especially when utilities, controls, process equipment, and construction must all work together on a live food site. For companies selecting a partner, local presence still matters even when service is national. A project team that can support work in North Carolina, Texas, California, the Midwest, and Canada while coordinating local trades and compliance requirements has an advantage in speed and accountability. That is particularly important for multi-site manufacturers standardizing capacity planning across networks. What is the first step in food plant capacity planning?Start with demand by SKU and customer, then compare it to actual line output data, not rated equipment speed. This quickly reveals whether the problem is demand, equipment, labor, scheduling, utilities, or storage. How often should a U.S. food plant update its capacity plan?At minimum, quarterly. High-growth or high-mix plants may need monthly updates, especially before summer beverage season, holiday demand, major retailer resets, or co-pack contract renewals. What is a good utilization target?Many food plants operate best between 70% and 85% sustainable utilization, depending on process complexity. The goal is to leave enough room for maintenance, changeovers, and demand swings while still generating strong asset productivity. Should we buy new equipment or improve OEE first?Usually improve OEE first. Many plants can unlock meaningful throughput through controls optimization, changeover reduction, maintenance discipline, and better scheduling before making major capital purchases. How do seasonal products affect capacity planning?They require prebuild decisions, supplier coordination, temporary labor plans, and warehouse strategies. Off-peak periods should be used for maintenance, training, and line improvement work. Why do utility systems matter so much?Because boilers, refrigeration, chilled water, compressed air, wastewater, and CIP systems often become the real bottleneck. A faster line adds little value if the supporting infrastructure cannot keep up. What industries benefit most from formal capacity planning?Nearly all, but especially RTD beverage, protein, dairy, sauces, prepared foods, co-packing, aseptic, and retort operations where demand volatility and process complexity are high. How do we choose a capacity planning partner?Look for a team that understands process engineering, automation, utilities, construction, compliance, and financial return. A partner should be able to challenge assumptions, quantify bottlenecks, and phase investments intelligently. What should be included in a 2026-ready capacity plan?Demand scenarios, actual line data, labor flexibility, utility loading, energy use, sustainability goals, food safety compliance, digital system integration, and a phased capital roadmap. Where does DPS fit in this process?DPS supports food and beverage manufacturers across North America with engineering, capital planning, owner’s representation, proprietary equipment, installation, controls integration, and project execution. The focus is on profitable, well-sequenced projects rather than overspending on the wrong fix. In summary, food plant capacity planning is not just about making more product. It is about making the right investments at the right time, using reliable data, and aligning plant capability with market opportunity. For U.S. manufacturers facing growth, labor pressure, compliance demands, and rising utility costs, that discipline is becoming a competitive necessity. -
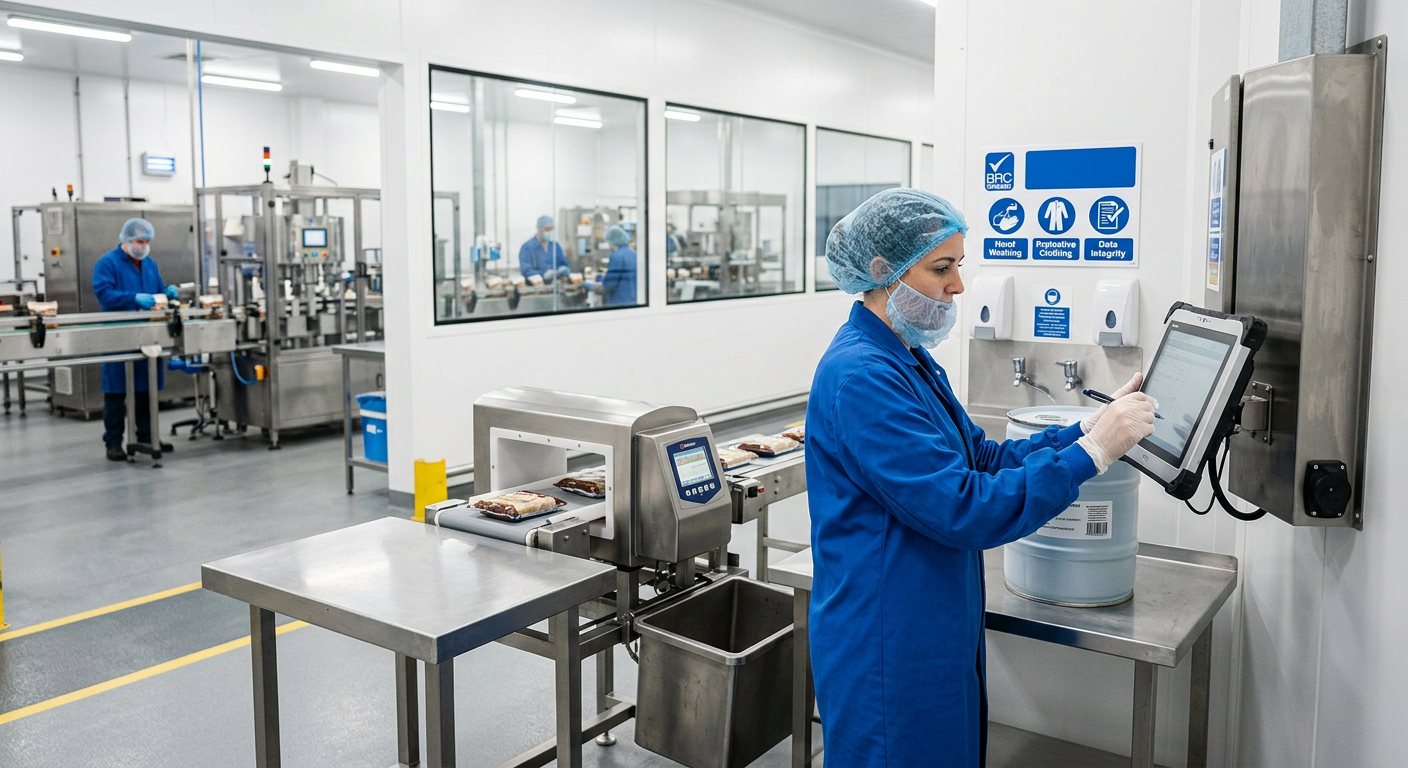
Food Plant Equipment Maintenance Strategies 2026
Food and beverage manufacturers in the United States are entering 2026 with a clear reality: maintenance is no longer a back-room function. It directly affects food safety, throughput, labor efficiency, utility costs, audit readiness, and capital planning. Plants in Chicago, Dallas-Fort Worth, Fresno, Atlanta, the Carolinas, Southern California, and the Gulf Coast are all dealing with the same pressure points: aging assets, tighter staffing, stricter documentation, and the need to produce more with fewer interruptions. This guide explains how modern food plant maintenance programs should be structured for U.S. processing environments, including proteins, dairy, sauces, prepared foods, aseptic lines, beverage plants, breweries, co-packers, and mixed-use manufacturing sites. It covers direct buying advice, market conditions, equipment categories, applications, case-driven recommendations, and practical standards for compliant execution. The strongest food plant equipment maintenance strategy in 2026 is a layered program that combines preventive maintenance, predictive and condition-based monitoring, disciplined corrective response, planned overhauls, and audit-ready documentation. In the United States, the best-performing facilities do not rely on emergency work alone. They schedule inspections by risk, use food-grade parts and sanitation-safe procedures, track failure history, and align maintenance planning with production windows, seasonal demand, and compliance requirements. For most U.S. plants, the priority order is straightforward: If a plant runs mixers, pumps, heat exchangers, fillers, retorts, conveyors, compressors, boilers, or CIP systems, maintenance should be built around asset criticality rather than simple calendar dates. A line that supports refrigerated ready meals in the Northeast or aseptic beverages near the ports of Los Angeles and Long Beach may require tighter controls than a non-critical support asset. The point is not to maintain everything the same way; it is to maintain the right assets with the right intensity. The table above shows why a balanced model performs better than a purely reactive one. Emergency maintenance has its place, but the most resilient plants use it as a last resort, not an operating philosophy. Preventive maintenance remains the foundation of food plant reliability. In U.S. facilities, this means developing task lists and frequencies tied to actual equipment duty, cleaning chemistry, temperature swings, washdown intensity, and production schedules. A poultry processor in Arkansas, a dairy plant in Wisconsin, and a beverage co-packer in North Carolina will not run identical PM schedules because their sanitation cycles, moisture exposure, and process loads differ significantly. Strong preventive maintenance programs usually include the following: Typical PM scopes in food plants include pump seal checks, motor alignment verification, conveyor tracking, valve seat inspection, heat exchanger inspection, retort instrumentation checks, tank gasket replacement, lubrication reviews, and compressed air leak surveys. In high-acid beverage plants, syrup rooms and batching skids may require closer review of elastomers and corrosion-sensitive components. In protein and prepared food plants, washdown-driven bearing and motor exposure often demands tighter inspection cycles. Maintenance leaders should be careful not to create oversized PM plans full of low-value tasks. The goal is not administrative volume. The goal is measurable uptime, lower contamination risk, and predictable labor use. The table above is most useful when linked to a computerized maintenance management system and revised by actual downtime history. Plants with multiple lines should compare repetitive failures by area instead of treating each incident in isolation. When plants need help designing PM structures that tie engineering, utilities, and operations together, working with an experienced processing partner can be more effective than relying on generic templates. Companies can review integrated planning approaches through food and beverage engineering services that connect equipment maintenance to broader plant performance. In 2026, predictive and condition-based maintenance is moving from a nice-to-have practice into a practical requirement for many U.S. food manufacturers. Tight labor markets, long lead times for specialty parts, and volatile demand make late discovery of equipment problems more expensive than before. Predictive maintenance uses measured data to estimate failure before it stops production. Condition-based maintenance acts when equipment condition crosses a threshold. In food plants, this often includes: These methods are especially valuable on critical assets such as boilers, refrigeration compressors, HTST systems, homogenizers, aseptic skids, tunnel pasteurizers, retorts, and high-throughput packaging lines. In regions with major distribution pressure such as the Midwest protein belt, the Central Valley, or the I-85 corridor, preventing one major outage during peak demand can justify much of the program cost. Technology also matters. Modern plants are increasingly combining PLC data, SCADA alarms, historian trends, and maintenance records to identify hidden losses. For example, repeated short stops on a filler may not appear catastrophic in isolation, but trend analysis can show an emerging component issue or controls limitation. The line chart illustrates a realistic investment trend: U.S. manufacturers are steadily increasing spending on monitoring, controls integration, and reliability tools. That trend is being accelerated by labor constraints, energy costs, and the need to prove compliance performance. From a technical capability standpoint, a full-scope engineering partner can add value beyond basic inspections. Disruptive Process Solutions, for example, operates across process, controls, mechanical, electrical, and utility systems, which matters because predictive maintenance often fails when data is reviewed in isolation. A vibration reading may point to a pump issue, but the root cause could be process conditions, controls logic, poor suction design, or utility instability. Integrated troubleshooting produces better decisions than single-discipline review. Plants evaluating sensors, automation upgrades, and predictive monitoring methods can explore process equipment solutions that support maintainability as well as production performance. Corrective maintenance is necessary in every plant. Not every defect requires immediate shutdown, and not every problem should be treated as a crisis. The key is to separate controlled corrective work from true emergency response. Corrective maintenance includes repairing known issues that have not yet caused a line stop, such as a leaking valve, a noisy bearing, declining heat transfer, damaged guarding, or recurring actuator faults. Emergency maintenance applies when safety, food quality, or production continuity is at immediate risk. U.S. plants should define emergency triggers clearly. Common triggers include: The most common mistake is allowing emergency work to consume the maintenance calendar until planning disappears. Once that happens, backlog increases, PM completion falls, spare parts become unreliable, and teams shift into permanent firefighting. Plants should maintain an emergency playbook that includes line ownership, escalation contacts, approved contractors, critical spares, lockout procedures, sanitation release requirements, and communication standards with quality and operations. This is especially important in high-output plants serving major retail or foodservice networks through hubs like Houston, Memphis, Chicago, or Savannah. The bar chart highlights where advanced maintenance demand is strongest. Aseptic, retort, protein, and beverage operations typically show the highest urgency because the consequences of downtime and compliance failure are more severe. Corrective work should also be ranked by business impact. A leaking non-critical water line is not equal to a homogenizer issue affecting a full production campaign. Good plants document these distinctions so maintenance labor is allocated where it protects margin, quality, and customer service most effectively. Major overhaul and refurbishment decisions are increasing across the United States because many facilities are balancing high replacement costs against the need to improve reliability. A well-planned overhaul can extend useful life, improve sanitation performance, lower utility consumption, and defer capital spending. However, not every old machine deserves rebuilding. Overhaul is usually appropriate when: Typical refurbishment scopes include replacing product-contact parts, upgrading controls, changing motors and drives, improving guarding, remachining wear surfaces, replacing bearings and seals, upgrading instrumentation, and redesigning CIP or drainage features to improve cleanability. In practice, overhauls often make the most sense in legacy dairy plants in the Upper Midwest, long-running beverage plants near East Coast distribution corridors, and protein operations where utility infrastructure is still viable but line reliability has declined. Facilities near ports such as Newark, Savannah, or Los Angeles may also pursue refurbishment to avoid long imported-equipment lead times. This table is useful because it reframes the overhaul decision as a business case, not merely a maintenance preference. Refurbishment should be approved only when it supports sanitary performance, uptime, and long-term operating economics. Manufacturing capability becomes important here. DPS not only supports engineered processing systems but also manufactures selected process equipment such as tanks, CIP systems, marination tumblers, and cooking vessels. That blend of manufacturing and integration can be valuable during refurbishments, where custom fabrication, utility tie-ins, and controls alignment often need to happen together instead of through disconnected vendors. Examples of integrated execution approaches can be reviewed through project stories and food and beverage case studies that show how engineering and field execution connect in real plant environments. Scheduling and planning are where maintenance strategy becomes operational reality. Many U.S. plants know what should be done but still struggle to complete work because production calendars, labor shifts, sanitation windows, and contractor access are not aligned. The most effective planning model uses three time horizons: Planning should include production, quality, sanitation, warehouse, and engineering stakeholders. If maintenance is planned in isolation, shutdown windows often fail. Plants in highly seasonal categories such as beverages, dairy, and prepared foods should also account for demand peaks tied to summer runs, holiday schedules, and customer promotions. The table above shows that planning structure should match plant type and commercial model. A co-packer with narrow customer windows needs a different approach than a multi-line campus with more scheduling flexibility. By 2026, better planning is also being shaped by sustainability and policy trends. Utilities are under closer review, water and energy intensity are being tracked more closely, and certain facilities are linking maintenance performance to ESG reporting and insurance expectations. That means steam trap audits, compressed air leak repair, refrigeration efficiency checks, and heat recovery maintenance are no longer optional extras. They affect operating cost and reporting quality. The area chart reflects a credible industry shift: reactive maintenance is declining as a percentage of total effort, while predictive and condition-based activity continues to rise. Plants that make this shift early usually gain better labor productivity and fewer compliance surprises. Maintenance in food plants is different from maintenance in general industry because every intervention must protect hygienic design and prevent contamination. Using the wrong gasket compound, lubricant, weld finish, fastener, sealant, or cleaning method can create both food safety and audit problems. Food-grade procedures should cover: In U.S. operations, maintenance and quality teams should align closely on all interventions involving product zones, allergen zones, aseptic boundaries, and kill-step systems. Facilities regulated by USDA or serving major branded customers often require especially tight signoff before restarting production. This table is important because food-grade maintenance is not just a parts issue; it is a procedure issue. The right materials still fail if work execution, inspection, and release steps are weak. Plants expanding or modernizing process systems often benefit from working with teams that understand both sanitary design and field installability. This is particularly useful for CIP systems, aseptic environments, retort support, dairy processing, and ingredient handling systems where maintainability should be engineered into the asset from the start. Documentation is now one of the clearest differentiators between average and high-performing maintenance organizations. In the United States, maintenance records support more than internal planning. They can also support regulatory response, customer audits, insurer review, root-cause analysis, and capital budgeting. Essential records include: Plants subject to FDA, USDA, SQF, or BRC expectations should ensure that maintenance records are complete, legible, reviewable, and linked to actual release practices. If a filler nozzle was replaced or an aseptic valve serviced, the record should show what was done, what parts were used, who approved restart, and whether any verification step was required. The explanation is simple: records create repeatability. Without documentation, even skilled technicians can leave knowledge trapped in memory, which becomes a major weakness during turnover, expansion, or audit activity. As policy and market expectations evolve in 2026, digital records will matter even more. Plants are moving toward mobile work orders, QR-linked asset histories, digital signoff, and maintenance dashboards tied to reliability KPIs. This trend is strongest in larger multi-site organizations, but mid-sized facilities are adopting it quickly because the labor savings and audit convenience are real. The comparison chart shows a common reality in complex plants: in-house teams are essential, but large maintenance and reliability improvements often happen fastest when they are supported by broader engineering and integration capabilities. Disruptive Process Solutions supports food and beverage manufacturers across the United States and Canada with an approach built around engineering, execution, and business outcomes. Rather than acting as a narrow contractor, the company works across design, build, and project management disciplines to help clients make better capital and operating decisions. From a service capability perspective, DPS supports process engineering, capital planning, owner representation, project and program management, equipment integration, installation coordination, and commissioning support. That broad scope is useful for maintenance strategy because many reliability issues are not just maintenance issues. They may stem from original design, utility constraints, controls logic, poor line balance, or difficult sanitation access. A partner that can see the entire system can usually solve the problem more effectively. From a technological capability perspective, DPS works across process, mechanical, plumbing, electrical, controls, PLC programming, automation, and SCADA. In practical terms, that means the team can connect maintenance findings to system design, utility behavior, and production performance instead of treating each symptom separately. This is especially valuable for beverage systems, dairy operations, aseptic processing, retort support, fermentation systems, batching and blending, filtration, and water treatment. From a manufacturing capability perspective, DPS also provides proprietary process equipment in selected categories, including tanks, custom CIP systems, marination tumblers, and cooking vessels. That manufacturing knowledge is useful when plants need maintainable designs, tailored replacement solutions, or equipment upgrades that fit existing process layouts and utility constraints. Companies that want to understand the team’s background and operating model can visit the DPS company overview. Organizations looking for broader support in project delivery, maintenance-related upgrades, or system integration can also review the full range of engineering and project services. In the U.S. market, this kind of support is especially relevant for manufacturers managing expansions, relocations, line retrofits, brownfield improvements, or new co-packing capacity in high-growth regions such as Texas, the Southeast, the Midwest, and California. Maintenance strategy works best when it is connected to profitability, not treated as a separate technical silo. The best strategy is a blended model: preventive maintenance for routine reliability, predictive and condition-based monitoring for critical assets, corrective maintenance for controlled defects, and planned overhauls for aging systems. It should also include strong documentation and food-grade procedures. It depends on criticality, sanitation exposure, operating hours, and process risk. High-use fillers, pumps, conveyors, and thermal systems may need daily or weekly checks, while other assets may be reviewed monthly or quarterly. A risk-based asset plan is better than a one-size-fits-all calendar. Start with assets that affect food safety, validated process steps, major utility systems, and line bottlenecks. In many U.S. plants, this includes boilers, refrigeration, compressors, pumps, fillers, retorts, pasteurizers, conveyors, and CIP systems. Yes, especially for assets where failure causes major downtime or quality risk. Mid-sized plants do not need every sensor on day one. A focused program on critical pumps, motors, compressors, and thermal systems usually delivers the best early return. Refurbishment makes sense when the core asset is mechanically sound, sanitary improvements are feasible, controls can be upgraded, and replacement lead times or capital costs are unfavorable. Replacement is often better when the design is obsolete, parts are unavailable, or future capacity needs are much higher. Auditors usually expect a current asset register, PM completion records, emergency repair logs, calibration records, approved parts traceability, and post-maintenance sanitation or release documentation where applicable. Directly. Better maintenance reduces energy waste, steam loss, compressed air leaks, water overuse, and unnecessary scrap. In 2026, more U.S. plants are tying maintenance performance to utility reduction and operational sustainability programs. Outside support is most helpful during chronic reliability problems, major shutdowns, utility issues, controls-related faults, expansions, relocations, or when a plant needs broader engineering coordination across process and facility systems. For U.S. food and beverage manufacturers, maintenance strategy in 2026 is no longer just about fixing equipment. It is about protecting production, compliance, labor efficiency, and capital performance. Plants that combine disciplined routines, smart monitoring, strong materials control, and integrated engineering support will be in the best position to compete. -
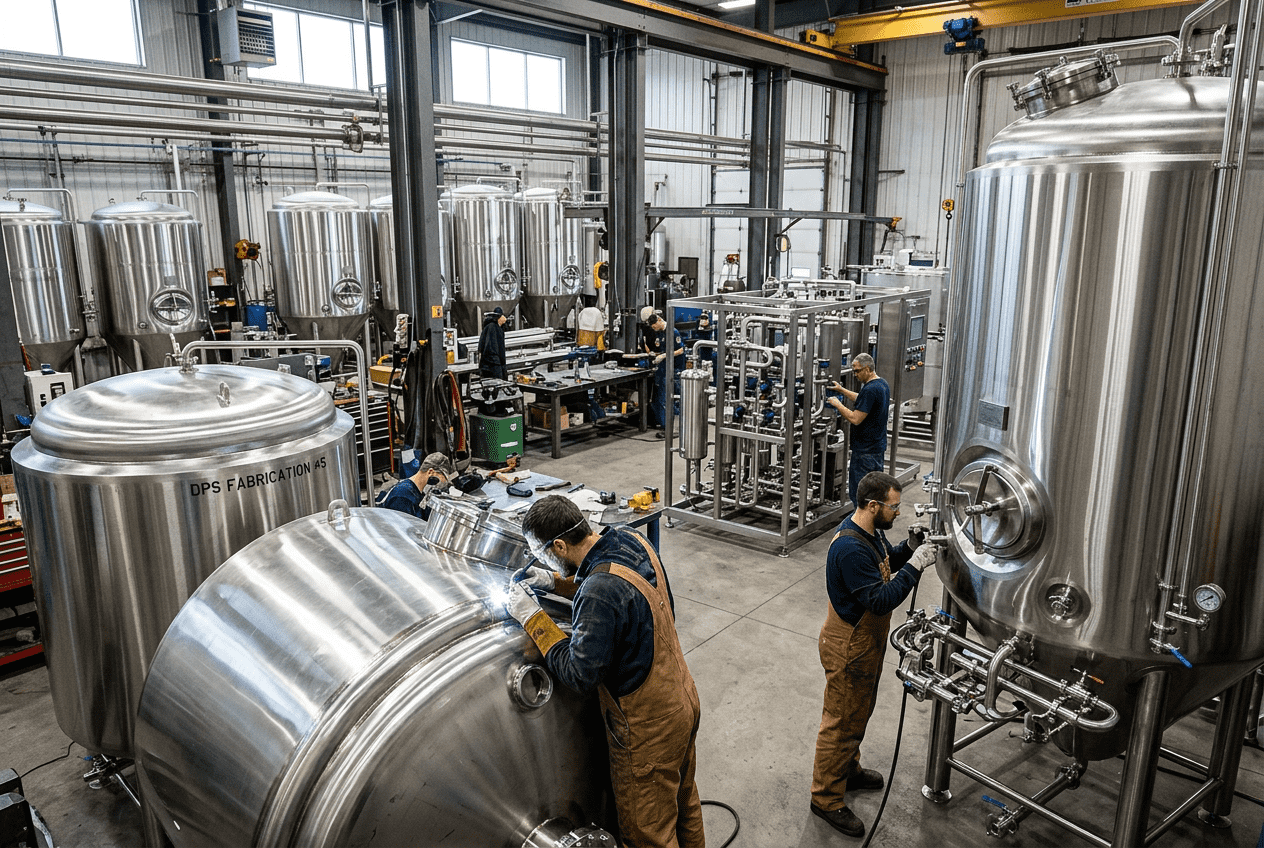
Food Plant ROI Modeling for Capital Projects
Food plant ROI modeling helps manufacturers decide whether a capital project will create measurable financial value. In the United States, food and beverage operators use ROI models to test expansion plans, utility upgrades, automation investments, new processing lines, facility relocations, and greenfield builds before committing capital. A strong model combines revenue assumptions, production throughput, labor efficiency, utility demand, maintenance costs, downtime risk, financing structure, tax effects, and resale or terminal value into one decision framework. For food processors in hubs such as Chicago, Dallas-Fort Worth, Fresno, Los Angeles, Atlanta, Charlotte, Kansas City, and the New Jersey distribution corridor, ROI modeling is no longer optional. With rising labor costs, volatile ingredient prices, stricter food safety compliance, and pressure to scale quickly, management teams need a disciplined method to compare projects and allocate capital where it produces the highest return. Companies that approach capital planning carefully often outperform those that buy equipment first and justify it later. That is especially true in regulated sectors such as dairy, proteins, prepared foods, sauces, aseptic processing, and beverage production, where layout, utilities, controls, sanitation, and commissioning all affect commercial outcomes. A well-built ROI model does not simply answer, “Will this project pay back?” It answers, “When, under which assumptions, and what operational conditions must be true for the project to be profitable?” At a practical level, food plant ROI modeling is a structured financial analysis used to estimate the expected return from a capital project over a defined period, usually five years. The model converts engineering choices into business outcomes. For example, a new HTST pasteurizer, a high-speed filling line, a retort upgrade, a protein marination line, or an automated CIP system changes throughput, labor needs, scrap, energy use, maintenance frequency, and product mix. Each of those variables affects cash flow. The quickest way to think about it is this: a manufacturer estimates total project cost, projects annual benefits, subtracts annual operating costs, applies taxes and financing where needed, and then calculates investment metrics such as NPV, IRR, payback period, and cash-on-cash yield. If those outputs clear the company’s hurdle rate and strategic requirements, the project is worth deeper development. In the U.S. market, the strongest models also reflect regional realities. A plant in California may face higher utility and labor costs than a facility in the Midwest. A Gulf Coast beverage operation tied to Houston logistics may have different freight assumptions than a Northeast co-packer shipping through the Port of Newark. A poultry plant in Arkansas may prioritize labor reduction, while a beverage project in North Carolina may emphasize fast commissioning and first-year profitability. Food manufacturers should also separate direct savings from strategic gains. Direct savings include labor reduction, yield improvement, waste reduction, energy savings, and lower maintenance. Strategic gains include higher capacity, entry into new channels, better food safety compliance, more reliable customer service, and the ability to attract larger retail or co-manufacturing contracts. The table above matters because many weak ROI models focus only on a single savings line and ignore the broader operating system. In food processing, the project is rarely just the machine. It includes utility loading, process integration, sanitation design, line balance, controls logic, startup performance, and workforce adoption. Food plant ROI modeling is the bridge between engineering design and capital decision-making. In a food or beverage environment, return on investment analysis must reflect the plant as an interconnected system, not a collection of standalone assets. A sauce blending line impacts vessel sizing, CIP duration, steam demand, batching accuracy, operator staffing, hold times, and finished goods scheduling. A dairy expansion affects homogenization, cooling, filler uptime, storage capacity, and sanitation windows. A protein system can alter labor, throughput, USDA inspection workflow, and waste streams all at once. Because of that complexity, ROI modeling should start with a business case, not a quote. Management teams need clarity on the commercial objective: increase volume, reduce conversion cost, improve product quality, enter a new package format, create redundancy, meet food safety requirements, or consolidate multiple sites. Once that objective is defined, the model should map each financial driver to a measurable plant outcome. For U.S. manufacturers, food plant investment analysis is often used in these situations: An effective partner can help align these operational questions with the financial model. Disruptive Process Solutions approaches capital projects from a profit-first perspective, helping food and beverage manufacturers evaluate whether a project is commercially smart before the project gains momentum. That matters because the best ROI model often reveals that the original scope is not the best use of capital. In real projects, it is common to discover that a throughput bottleneck sits in automation logic, line balancing, utility constraints, or material flow rather than in the piece of equipment a client initially wants to buy. That is why financial modeling should happen alongside process review, facility planning, and execution strategy. The line chart above illustrates a realistic upward trend in U.S. food plant capital spending, driven by reshoring, automation, compliance upgrades, and network expansion. For operators near major logistics hubs such as Memphis, Savannah, Long Beach, and Dallas, that trend raises the cost of delay and increases competition for contractors, long-lead equipment, and skilled trades. Most food plant ROI models in the United States use four primary metrics. Each metric answers a different executive question, so none should be used in isolation. Net Present Value (NPV) measures the present value of future cash flows minus the upfront investment. It tells you how much value the project creates in today’s dollars after accounting for the cost of capital. If a project has a positive NPV, it is creating value above the company’s hurdle rate. Internal Rate of Return (IRR) is the discount rate at which the project’s NPV equals zero. It is useful for comparing projects of different sizes, although it should not replace NPV when choosing between mutually exclusive alternatives. Payback Period measures how long it takes for cumulative cash flow to recover the initial investment. Many privately held manufacturers still rely heavily on payback because it is intuitive and linked to risk tolerance. Cash-on-Cash Yield compares annual pre-tax cash flow to the initial cash invested. This metric is especially useful when financing structure, phased rollouts, or staged equipment purchases affect how much actual cash leaves the business. The best practice is to use all of these together. For example, a large UHT beverage project in California may show a longer payback but still produce strong NPV because of durable multi-year cash flow. A lower-cost automation upgrade in Tennessee may have a very fast payback but a smaller absolute value contribution. Senior leadership needs both perspectives. For lender presentations, it is also useful to show debt service coverage impact, because banks and private credit groups want to understand whether the project strengthens the borrower’s ability to service obligations. Investor audiences often focus more on IRR, margin expansion, and scalability. A five-year model is common because it balances visibility with uncertainty. In food manufacturing, customer contracts, category shifts, ingredient volatility, and labor conditions can change materially over longer periods, so a five-year horizon often produces the most actionable forecast. The recommended structure includes these blocks: The most reliable models begin with physical process assumptions. If a new packaging line adds 120 units per minute, the model should test whether upstream blending, storage, utilities, labor, and warehouse flow can support that volume. A projected revenue increase is not credible if the full plant cannot run at the assumed rate. Below is a simplified structure for a five-year model that a food or beverage plant could use for a new process line, utility system, or expansion package. This example shows why five-year models are useful. Year 1 often includes ramp-up inefficiency, operator learning, validation work, and lower utilization. By Year 3 or Year 4, the project may generate its most meaningful returns. A model that only looks at Year 1 can badly undervalue a strategic investment. When manufacturers need support translating process design into a finance-ready model, the combination of engineering insight and project execution matters. DPS’s food and beverage engineering services are often relevant here because process engineering, capital planning, owner’s representation, and project management all influence the credibility of the financial forecast. Forecasting CAPEX and OPEX accurately is one of the hardest parts of ROI modeling. Many disappointing projects do not fail because the concept was poor; they fail because budgets overlooked integration, utilities, site readiness, controls, or startup support. CAPEX in a food plant model should include far more than equipment price. It typically covers process equipment, utility systems, structural work, MEP trades, controls integration, freight, rigging, installation, commissioning, validation, permitting, contractor conditions, contingency, and working capital effects if inventory grows. In retrofit projects, shutdown planning and temporary operations should also be considered. OPEX forecasting should account for labor, ingredients and packaging tied to added volume, water, wastewater, electricity, natural gas, steam, refrigerants, chemicals, CIP cycles, maintenance labor, spare parts, compliance testing, and sanitation time. For some product categories, waste disposal and giveaway can materially affect ROI. The explanation behind this table is simple: every underestimated line item weakens ROI credibility. In protein, dairy, and aseptic applications, utility and sanitation loads can be just as important as the core process equipment. A beverage line may require not only fillers and bright tanks, but also syrup rooms, carbonation control, compressed air, cooling towers, and water treatment to achieve promised throughput. This is where technological capability matters. DPS supports projects that require structural, mechanical, plumbing, electrical, process, and controls engineering, including PLC programming, automation, and SCADA. Those capabilities are important to ROI modeling because capital returns depend on integrated system performance, not just on equipment nameplate ratings. Manufacturing capability also affects ROI. Custom tanks, CIP systems, tumblers, and cooking vessels can reduce lead times or improve fit to the process if designed correctly. Manufacturers evaluating equipment alternatives can review process equipment solutions to compare packaged versus customized approaches in their business case. Every ROI model should include sensitivity analysis. Food manufacturing assumptions are inherently uncertain. Ingredient costs move. Retail demand changes. Labor markets tighten. Yields fluctuate. Utilities spike during hot summers or cold winters. A project that only works under one perfect assumption set is not a robust investment. Sensitivity analysis tests how outputs such as NPV and payback change when a single variable moves while others remain constant. The most common variables in food plant capital models are: For a beverage co-packer near Atlanta or Phoenix, volume attainment and startup timing may be the biggest risks. For a protein processor in Omaha or Sioux Falls, labor efficiency and yield may dominate. For a dairy plant in Wisconsin or Idaho, utility and refrigeration assumptions may be more material. The table shows that not all variables are equally important. Executives should identify the two or three assumptions that most heavily influence value and focus diligence there. If startup delay destroys the model, invest more in project management, commissioning, and operator readiness. If yield drives the economics, validate process performance before final approval. The bar chart indicates where capital demand is likely to be strongest across major U.S. food and beverage segments. High co-packing and beverage demand is consistent with current market behavior, especially in Sun Belt growth markets and major consumer distribution zones. Sensitivity analysis changes one variable at a time. Scenario planning changes several together to show realistic operating conditions. Every food plant ROI model should include at least three scenarios: base, optimistic, and pessimistic. This is especially important when project outcomes depend on customer wins, labor availability, commodity markets, or regulatory timing. The base case should reflect the most likely operating outcome using defendable assumptions. The optimistic case should not be fantasy; it should represent a plausible upside if commercial execution, startup, and utilization all go well. The pessimistic case should capture realistic downside risks such as delayed commissioning, lower contract volumes, higher utility cost, or slower labor savings capture. For U.S. manufacturers, scenario planning is particularly useful in these cases: The explanation behind scenario planning is that capital allocation is as much about resilience as upside. If the downside case still preserves positive value and acceptable leverage metrics, the project may be a strong candidate. If the downside case turns sharply negative, leadership should revisit scope, phasing, or contracting strategy. The area chart highlights a major 2026 trend: more food plant ROI models now assign explicit value to automation, data visibility, energy efficiency, water reuse, and sustainability-linked compliance. Companies in states with higher utility costs or ESG reporting pressure are increasingly quantifying those benefits rather than treating them as secondary. Most bad ROI models fail in predictable ways. They either overestimate benefits, underestimate installed cost, ignore operating complexity, or rely on assumptions that plant operations do not support. The first common mistake is using equipment vendor throughput numbers as if they were plant throughput numbers. A filler may run at a certain speed in a factory acceptance test, but actual plant output depends on product characteristics, changeovers, sanitation, upstream supply, operator skill, and downstream packaging constraints. The second mistake is excluding indirect costs. These include shutdown losses, permitting, freight, local code upgrades, foundation work, controls integration, spare parts, cybersecurity, or training. In retrofit projects, demolition and temporary production workarounds can materially affect total cost. The third mistake is assuming all added capacity will sell immediately. Revenue forecasts should reflect contract status, customer concentration, seasonality, freight economics, and market access. Plants serving the Midwest may have different margin assumptions than those shipping into coastal metropolitan areas such as New York, Los Angeles, or Miami. The fourth mistake is ignoring commissioning risk. In food and beverage, startup often determines ROI more than the design itself. Delays in water treatment, steam quality, CIP tuning, controls debugging, or operator training can move payback materially. The fifth mistake is building the model without operations input. Finance teams need plant managers, maintenance leaders, quality teams, and engineering stakeholders involved from the beginning. The comparison chart illustrates a common ROI tradeoff. Standard packages may look cheaper upfront, but integrated engineered solutions often outperform in lifecycle cost, customization, startup support, and scalability. In many food plants, that difference is what separates a quoted project from a profitable project. Service capability plays a direct role here. A design-build-manage approach can reduce the disconnect between concept, execution, and operating reality. When engineering, general contracting, equipment supply, installation, and project management are coordinated, the ROI model usually becomes more reliable because scope gaps are discovered earlier. Readers looking for implementation examples can review capital project case studies to see how execution strategy affects commercial outcomes. An ROI model is only useful if decision-makers trust it. Investors and lenders want clarity, discipline, and transparency. That means your presentation should be concise, assumption-based, and backed by plant logic. Start with the business problem. Explain whether the project is solving a capacity constraint, reducing conversion cost, entering a new category, improving compliance, or enabling geographic expansion. Then show the current-state operational bottleneck and the proposed future-state workflow. Next, present the cost summary and assumptions. Break CAPEX into equipment, installation, utilities, controls, building work, contingency, and startup. Show volume assumptions, margin assumptions, and ramp-up timing. Then walk through the base case, downside case, and upside case. For lenders, include financing needs, debt service impact, collateral considerations, and key project milestones. For investors, emphasize EBITDA uplift, scaling path, IRR, and strategic option value. Both groups appreciate a clear risk register that identifies what could go wrong and what management is doing to mitigate it. Use charts, but do not overwhelm the audience. One page on investment summary, one on assumptions, one on scenario outcomes, one on risks, and one on execution plan is often enough for the initial review. Also remember that credibility comes from humility. If your assumptions rely on winning a major account not yet signed, say so. If utility pricing is uncertain in a high-cost region, identify the range. If the project depends on specialized trades in a tight market like Southern California or parts of Texas, discuss that openly. Transparent models are funded more often than perfect-looking ones. For companies preparing a capital request, it also helps to work with a partner that understands both manufacturing realities and project delivery. In the U.S. market, that means engineering knowledge, execution management, compliance fluency, and an honest view of what the project should cost and when it can realistically come online. What is a good payback period for a food plant capital project in the United States?It depends on the project type and company strategy. Many private manufacturers seek payback within two to four years for automation or line upgrades. Larger strategic projects, such as greenfield facilities or aseptic expansions, may justify longer paybacks if they create durable margin and capacity benefits. Should food manufacturers use NPV or IRR?Use both, but prioritize NPV when selecting between alternatives. NPV measures actual value creation in dollars. IRR is useful for comparing attractiveness, especially when projects differ in scale. How detailed should CAPEX be in an ROI model?Very detailed. Include process equipment, utilities, controls, freight, installation, building work, commissioning, contingency, and local code or compliance upgrades. Many weak models fail because “soft” or indirect costs are left out. How do I model revenue for a capacity expansion?Start with realistic sell-through assumptions, not nameplate capacity. Build in utilization ramp, customer timing, seasonal effects, freight economics, and margin by product mix. If demand is uncertain, run multiple scenarios. What industries benefit most from food plant ROI modeling?Nearly all food and beverage sectors benefit, including protein processing, dairy, prepared foods, sauces, spirits, brewing, RTD beverages, juices, aseptic products, plant-based foods, co-packing, and shelf-stable operations. Does compliance spending belong in ROI analysis?Yes. Even if a project is primarily risk-reduction driven, the model should quantify avoided downtime, avoided non-compliance costs, improved audit readiness, insurance implications, and customer retention effects where possible. How often should the model be updated?At least at concept stage, budget validation stage, and pre-approval stage. It should also be updated during execution if installed cost, lead time, or startup assumptions change materially. How does 2026 affect food plant ROI modeling?2026 planning is increasingly shaped by automation, labor scarcity, digital controls, energy management, water stewardship, and sustainability-driven policy pressure. Models should include utility resilience, emissions-related upgrades, data visibility, and long-term operational flexibility. Why is integration so important in ROI?Because food plants operate as systems. A new vessel, filler, retort, or mixing line only creates returns if utilities, controls, sanitation, material flow, and staffing all support the expected performance. Integration errors often erase projected returns. When should a manufacturer bring in an external engineering and project partner?Early, ideally before scope is finalized. Early involvement improves feasibility, identifies hidden costs, tests bottlenecks, and creates a more defensible investment case. That is especially valuable for multi-discipline projects involving process, automation, utilities, and installation. In summary, food plant ROI modeling is most valuable when it is grounded in plant reality, commercial logic, and disciplined execution planning. For U.S. manufacturers competing in fast-moving categories and high-stakes production environments, a rigorous financial model is not just a finance document. It is a strategic operating tool that helps companies invest smarter, scale faster, and protect profitability. -
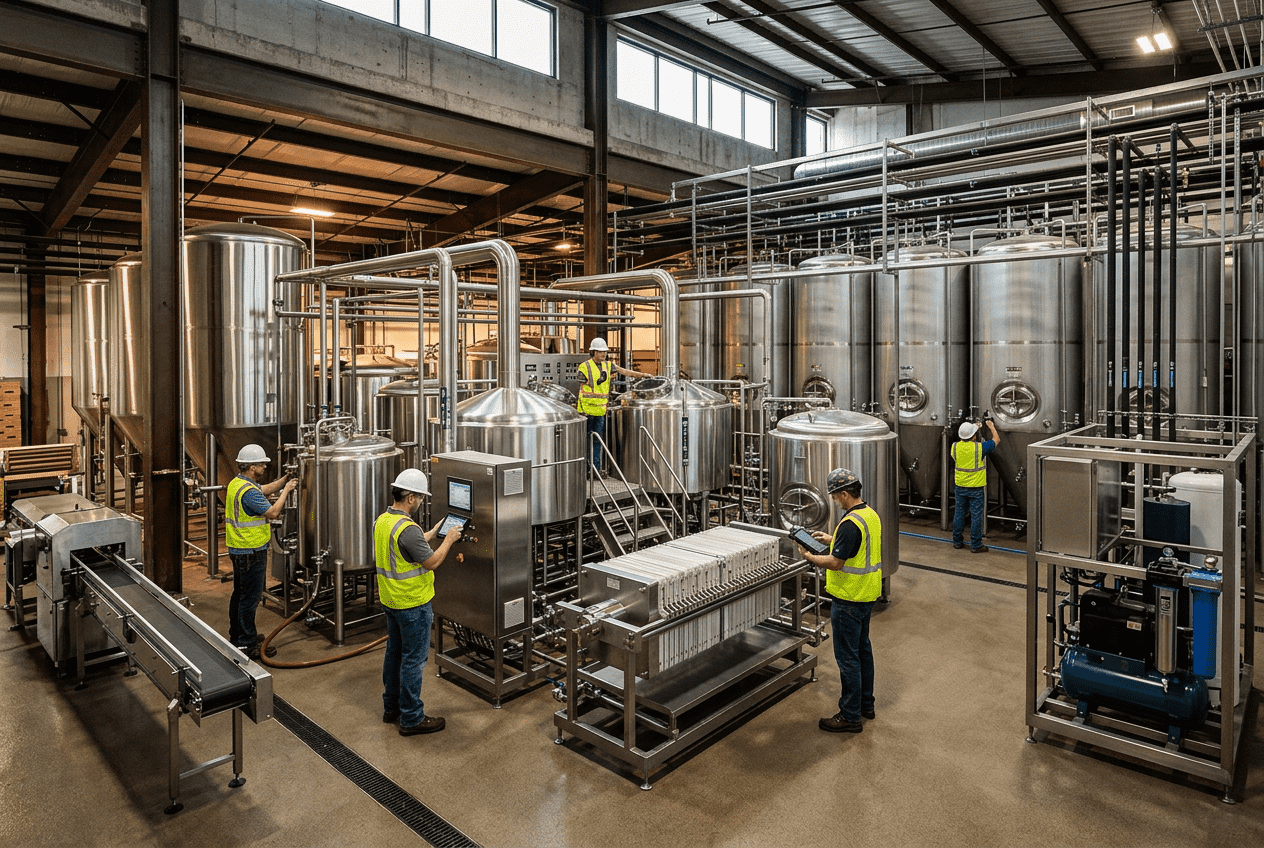
Beverage Manufacturing Capital Planning
Beverage manufacturers in the United States are under constant pressure to grow output, protect margins, improve reliability, and meet tighter sustainability and food safety expectations. Capital planning is where those goals are translated into projects, sequencing, budgets, and measurable business returns. In practice, strong beverage manufacturing capital planning aligns commercial demand with process capability, packaging throughput, utilities, labor, compliance, and resilience. It is not just a budgeting exercise. It is a disciplined method for deciding when to replace aging filling lines, when to expand syrup rooms, whether to add refrigeration capacity, how to stage wastewater upgrades, and which projects should move first. Across major beverage hubs such as Chicago, Dallas, Atlanta, Los Angeles, Charlotte, and the New Jersey corridor near the Port of Newark, producers are reevaluating CapEx through a wider lens. They are no longer looking only at direct output gains. They are also asking how a project affects changeover time, sanitation performance, energy intensity, operator safety, utility constraints, warehouse flow, and future product mix. This is especially important in segments such as craft brewing, spirits, RTD cocktails, juice, dairy beverages, aseptic products, carbonated soft drinks, and functional beverages, where demand patterns can change quickly. For manufacturers that need a practical partner, Disruptive Process Solutions approaches capital projects with a business-first mindset. Rather than forcing unnecessary spend, the company is known for identifying the true bottleneck, validating feasibility, and delivering projects through an integrated design-build-manage model. That approach is highly relevant in the United States market, where regional utility costs, local permitting, labor availability, and logistics access can materially alter the economics of a beverage expansion. Beverage manufacturing capital planning is the structured process of selecting, prioritizing, funding, and executing investments in production assets, process systems, packaging lines, utilities, automation, buildings, and compliance improvements. In the United States, it typically includes five core decisions: what the plant needs now, what demand will require later, which assets create the highest business value, what infrastructure must support those assets, and how projects should be phased to protect cash flow and operational continuity. A strong capital plan for a beverage facility should answer the following questions directly: When done well, beverage CapEx planning reduces reactive spending, avoids stranded capacity, and increases the odds that each project contributes to first-year profitability rather than creating hidden overhead. Beverage manufacturing capital planning is the long-range management of fixed-asset investment across process equipment, packaging machinery, utilities, plant infrastructure, controls, quality systems, and site improvements. In a beverage operation, these investments may include blending systems, bright tanks, unitanks, pasteurizers, fillers, cappers, conveyors, labelers, palletizers, CIP systems, boilers, cooling towers, ammonia or glycol systems, RO water systems, compressed air packages, wastewater treatment upgrades, and automation platforms. The reason this discipline matters is that beverage plants are tightly interconnected. A new filler does not create value if depalletizing, syrup batching, tunnel pasteurization, case packing, chilled water, or air supply cannot support it. Likewise, adding fermentation tanks in a brewery does not guarantee sellable output if filtration, packaging windows, or cold storage become the next constraint. Capital planning therefore looks at the entire operating system rather than individual machines in isolation. In the United States, capital planning also has to reflect local realities. A carbonated soft drink plant near Houston may have different steam economics and labor access than a co-packer in Southern California. A brewery in the Pacific Northwest may face different wastewater discharge requirements than a dairy beverage producer in the Midwest. Sites near logistics corridors such as I-85 in the Carolinas, the Inland Empire in California, or distribution nodes around Memphis and Columbus often make different packaging and warehouse investments than plants serving primarily local distribution. For many producers, the process starts with feasibility and data collection. This is where a multidisciplinary engineering partner adds value. Through its services, DPS supports owners with capital planning, feasibility studies, owner’s representation, project management, general contracting coordination, system integration, and execution oversight. That structure is useful because beverage projects usually require alignment between process engineering, mechanical and plumbing design, electrical distribution, controls, structural support, sanitation, and commissioning. The table above shows why capital planning is broader than maintenance replacement. It connects demand, risk, compliance, and flexibility into one investment framework. Most beverage facilities should rank projects in a disciplined order instead of approving them on urgency alone. In many cases, the best sequence is to stabilize reliability first, remove the largest capacity bottleneck second, upgrade enabling utilities third, and then invest in strategic flexibility and cost optimization. This order is not universal, but it often prevents a plant from buying visible production assets before addressing hidden infrastructure limitations. Priority setting should vary by product type: DPS brings useful depth here because its team works across both beverage and food environments and supports processing systems ranging from fermentation and carbonation to pasteurization, sterilization, water treatment, and automation. On the technology side, that means the ability to connect process, utilities, controls, and plant systems rather than treating them as separate scopes. On the manufacturing side, DPS also designs and supplies selected proprietary process equipment, including tanks and CIP systems, which can simplify integration when speed and fit matter. This prioritization table is especially helpful for portfolio reviews because it separates projects that must happen from those that should happen if capital remains available. The line chart reflects a realistic pattern for U.S. beverage manufacturing CapEx: steady expansion driven by automation, utility modernization, packaging flexibility, and sustainability-related projects. Lifecycle planning is one of the most overlooked parts of beverage capital planning. Many plants continue operating aging assets until failure, especially if the equipment still “runs.” The problem is that technical life and economic life are not the same. A filler may still operate, but if parts are difficult to source, controls are obsolete, changeovers are slow, sanitation time is high, and micro-stoppages are constant, the asset may already be destroying margin. Lifecycle planning should cover core production systems and enabling infrastructure together. In beverage plants, that usually includes: The right replacement decision often depends on four variables: downtime risk, cost to maintain, impact on performance, and compatibility with future product needs. For example, an outdated refrigeration system may not only be expensive to maintain; it may also limit tank turns and packaging schedules during peak summer demand. Likewise, an older filler may be acceptable for a narrow SKU set but become a severe constraint once slim cans, variety packs, or higher sanitation standards are introduced. The key message from the table is that lifecycle planning is not just about age. It is about the operational cost of continuing to defer action. The bar chart shows where demand for capital projects is currently strongest: RTD, aseptic, and spirits-linked growth continue to drive utility, blending, and packaging investment. One of the hardest choices in beverage capital planning is deciding whether to build for near-term demand or future scale. A phased investment model reduces initial cash outlay and may fit uncertain demand curves. A full-scale model can lower total installed cost, avoid disruption from repeat construction, and position the plant for major customer wins. The correct answer depends on market certainty, customer contracts, utility lead times, floor space, and the cost of being late. In the United States, phased investments are common in co-packing, brewing, and emerging beverage categories where SKU volatility is high. Full-scale investment is more common when a site has anchor customers, clear regional distribution plans, or strategic access to major freight lanes and ports such as Savannah, Long Beach, Houston, or Newark. DPS has direct experience supporting facilities designed to scale significantly over time, which is exactly where planning discipline matters. Instead of only sizing visible production equipment, the smarter approach is often to prepare the backbone infrastructure early: pad locations, utility corridors, electrical capacity, control architecture, and wastewater allowance. That prevents the second phase from becoming far more expensive than expected. This table is useful when presenting options to leadership because it makes the tradeoffs visible beyond simple sticker price. Utilities are where many beverage projects succeed or fail. Process and packaging teams may focus on production assets, but water treatment, steam, compressed air, electrical distribution, cooling, refrigeration, and wastewater are often the real gatekeepers of growth. In carbonated, brewed, dairy, and aseptic operations especially, utility shortfalls can create hidden bottlenecks long before a production line reaches nameplate speed. Water and wastewater deserve special attention in the United States because municipal conditions vary dramatically by region. A plant in Arizona or Southern California may face water cost and scarcity pressures that change the economics of reuse systems. Facilities in the Midwest may have different discharge structures than sites in North Carolina or Georgia. Steam needs also vary by product mix, with hot-fill, pasteurization, sanitation, and thermal processing driving larger boiler and condensate requirements. For utility-heavy projects, manufacturers should assess peak and average demand separately, identify single points of failure, and plan for 2026-era sustainability expectations. These include lower water intensity, heat recovery, energy monitoring, improved insulation, variable frequency drives, refrigeration optimization, and smarter control integration. This table highlights a critical truth: utility CapEx is rarely optional if a site expects reliable expansion. It is often the enabling investment that makes process and packaging projects viable. The area chart illustrates a realistic trend shift: a larger share of beverage capital portfolios is moving toward infrastructure, sustainability, and resilience rather than production machinery alone. A CapEx proposal should be easy for executives to compare across projects. The best business cases combine financial returns with operational logic and execution risk. Too many proposals focus narrowly on equipment cost and expected output without documenting assumptions, utility dependencies, labor effects, startup risk, sanitation implications, or sensitivity to demand. A practical business case template for beverage manufacturing should include: Manufacturers often improve approval quality by using a standard scorecard. That allows a filler replacement in Ohio to be compared fairly with a wastewater upgrade in California or a syrup room expansion in Texas. The table above works well as a template foundation because it forces proposal authors to think beyond purchase price and document the full operating impact. When organizations need support building stronger project cases, an integrated partner can help connect engineering assumptions to financial logic. That is one reason many manufacturers involve specialists early rather than after the budget is approved. From concepting through execution, DPS supports that bridge between technical feasibility and investment justification, while its equipment capabilities and integration knowledge help define realistic scope boundaries. Not every project should be funded only because it has the shortest payback. In beverage manufacturing, several categories deserve a formal non-financial score even when ROI appears modest. The most important are safety, quality protection, business continuity, customer service reliability, ESG performance, and resilience against utility, labor, or supply disruptions. For example, a wastewater pretreatment project may not show the same payback as a packaging-speed upgrade, but it can protect the site’s operating license and community standing. A backup refrigeration loop may not maximize IRR, but it can prevent catastrophic product loss. A controls migration may not add visible capacity, yet it may eliminate serious cyber or obsolescence risk. By 2026, more U.S. beverage producers will be expected to show progress on water intensity, energy performance, emissions visibility, and plant resilience. Major retailers, co-man customers, and private equity sponsors are increasingly asking for data on these issues. As a result, capital planning should explicitly score: On the service side, this is where experienced owner’s representation and project management are valuable. Strong project teams keep non-financial priorities from being cut during value engineering. That discipline is central to how DPS structures project oversight and execution support for food and beverage manufacturers. The comparison chart shows why many U.S. manufacturers prefer an integrated project model for complex beverage investments: it typically improves safety, scalability, and infrastructure coordination even if the equipment itself is not the cheapest line item. Capital planning should not happen once a year and then sit untouched. Beverage markets move too quickly for that. Ingredient costs change, customer demand changes, municipalities revise utility conditions, and equipment lead times shift. Best practice is to manage a living capital portfolio with quarterly or at least semiannual reviews. A dynamic portfolio review should revisit: This approach is especially useful for multi-site beverage companies in the United States. A project in the Southeast may suddenly outrank one in the Midwest if customer concentration shifts or if a utility upgrade creates a much faster path to volume. Portfolio discipline also helps organizations avoid chasing visible projects while ignoring less glamorous infrastructure needs. Continuous improvement becomes stronger when lessons from completed work are fed back into future planning. Manufacturers should track not only whether projects were on time and on budget, but also whether the expected OEE, labor, water, or quality gains actually appeared. Real post-audit data makes future business cases more credible. For companies seeking examples of how disciplined project execution translates to operating value, DPS shares practical experience through selected case studies. These kinds of examples matter because they show how smart capital planning often starts by identifying the real root cause rather than assuming new equipment is the only answer. The portfolio review table shows how capital planning should remain tied to actual plant performance and strategic context, not just annual budget cycles. In the current U.S. environment, local supplier and contractor strategy also matters. Plants in regions such as the Carolinas, Texas, the Midwest, and California often face different installation labor dynamics, code interpretations, and permitting timelines. That is why manufacturers benefit from a partner with broad North American reach but enough agility to coordinate local trades effectively. DPS operates that way, combining national beverage and food engineering experience with project-based execution tailored to site conditions. What is the biggest mistake in beverage manufacturing capital planning?The most common mistake is buying visible production equipment before validating utilities, controls, sanitation, and downstream handling. Many projects underperform because the real bottleneck was elsewhere. How far ahead should a U.S. beverage plant plan capital projects?Most facilities should keep a 3-year actionable plan and a 5-year strategic view. Utility-intensive sites may need even longer horizons because power, wastewater, and boiler-related upgrades can have long lead times. Should replacement projects always compete with growth projects on ROI alone?No. Replacement projects often protect continuity, food safety, and maintenance risk. They should be evaluated with both financial and non-financial criteria. What data should be collected before approving a capacity expansion?At minimum: current OEE, changeover time, true bottleneck analysis, utility loading, labor model, customer demand scenarios, floor-space constraints, and startup outage requirements. When is phased investment better than full-scale investment?Phased investment is often better when demand uncertainty is high, capital is constrained, or product mix is likely to change. Full-scale investment is often better when demand is contract-backed and infrastructure can be built more economically once. How important are wastewater and water systems in beverage CapEx?They are critical. In many beverage facilities, wastewater discharge, process water quality, and peak flow conditions are the hidden constraints that determine whether growth is feasible. What trends will shape beverage capital planning through 2026?Expect stronger focus on automation, SCADA visibility, utility efficiency, water reuse, heat recovery, hygienic design, cybersecurity, equipment modularity, and resiliency against power and supply disruptions. How can a manufacturer improve CapEx proposal quality quickly?Use a standard business case template, require do-nothing and alternative options, include full installed cost and utility effects, and score projects for safety, ESG, resilience, and strategic fit along with ROI. What types of beverage operations benefit most from integrated engineering support?Co-packers, breweries, distilleries, dairy beverage plants, aseptic processors, and fast-growing RTD manufacturers typically benefit the most because their projects involve strong interdependence between process systems, packaging, utilities, and controls. Why do manufacturers choose DPS for beverage capital planning and delivery?Because the company combines technical engineering depth, practical installation and integration knowledge, and a transparent, profitability-focused approach. Rather than pushing unnecessary spend, DPS helps manufacturers identify the right investment, sequence it intelligently, and execute it with accountability. -
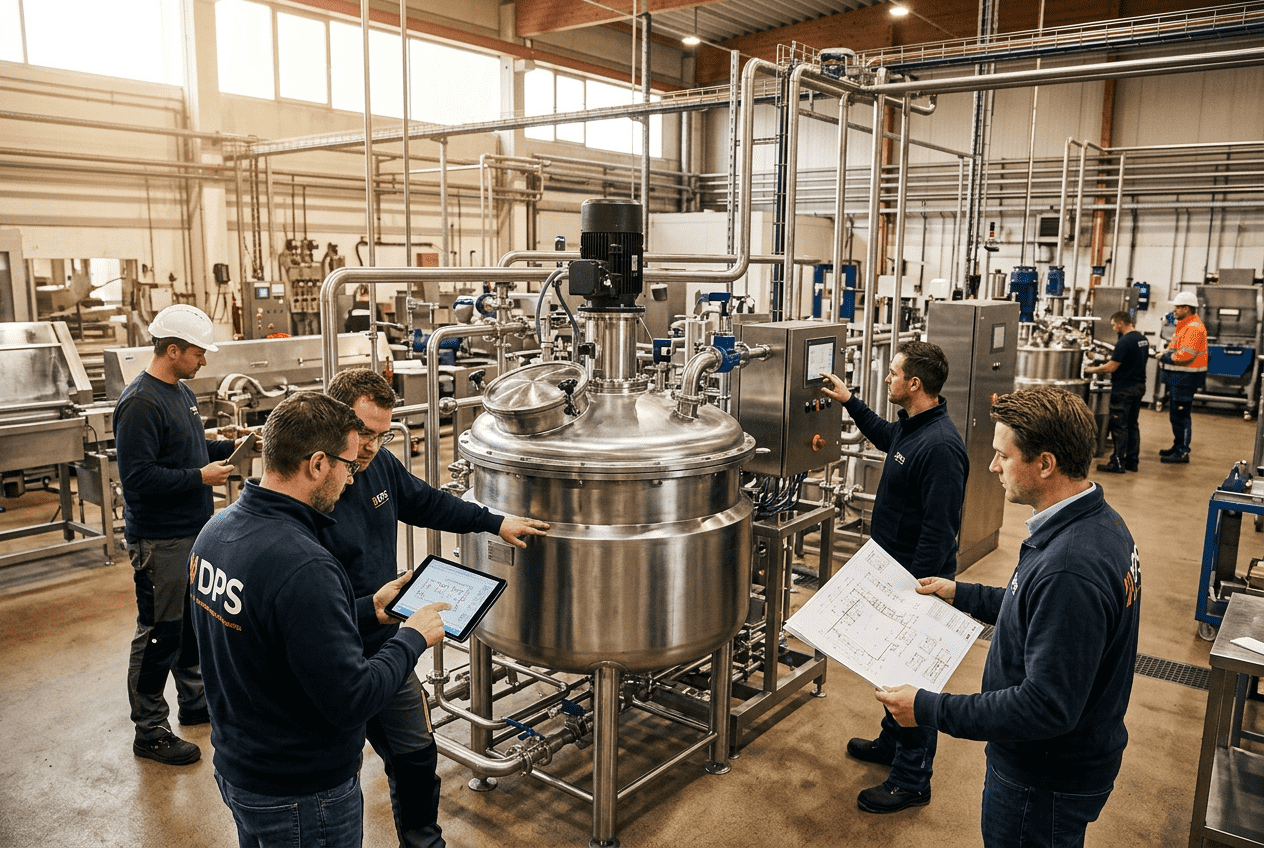
Food Manufacturing Capital Project Planning
Food manufacturing capital project planning is the structured process of turning a business need—more capacity, better food safety, lower utility costs, new product capability, or plant modernization—into an executable project with clear scope, budget, schedule, risk controls, and return targets. In the United States, successful planning usually starts long before equipment is ordered. It includes feasibility analysis, process definition, utility sizing, compliance review, cost modeling, stakeholder alignment, and commissioning strategy. For food and beverage manufacturers, good planning reduces change orders, protects uptime, improves regulatory readiness, and helps leadership invest capital where it produces the strongest operational and financial return. Whether a processor is building a greenfield plant near Dallas, expanding a protein line in Kansas City, modernizing dairy operations in Wisconsin, or upgrading a beverage facility near the Port of Savannah, the same principle applies: smart capital must be tied to smart manufacturing outcomes. That means a project should not simply “fit the budget.” It should support throughput, labor efficiency, food safety, maintenance access, utilities, automation, and future expansion without creating hidden bottlenecks. Food manufacturing capital project planning is the front-end and execution framework used to evaluate, design, fund, and deliver physical improvements in a processing operation. These projects can include new processing lines, plant expansions, utility upgrades, warehouse additions, packaging automation, wastewater systems, aseptic processing suites, retort systems, refrigeration upgrades, CIP skids, and full facility relocations. In the United States market, capital planning is especially important because food manufacturers operate under demanding production economics and strict compliance requirements. Projects often must satisfy FDA expectations, USDA inspection requirements, customer quality programs, SQF or BRC certification needs, local building codes, wastewater discharge limits, and utility provider constraints. A plan that looks strong on paper can fail in practice if it ignores sanitary zoning, process flow, compressed air demand, steam load, chilled water balance, or labor availability. The best capital planning process connects four levels of decision-making: This structure is where an engineering partner can add outsized value. Disruptive Process Solutions approaches planning as a profitability exercise, not just a construction exercise. That distinction matters because many food projects succeed or fail based on decisions made before detailed design begins. A practical capital planning model for food processors in the United States can be organized into five stages. These stages create a disciplined path from concept to startup. Stage 1 begins with the business trigger. Is the company adding SKUs for a national retailer? Is a co-manufacturer trying to support a new aseptic beverage customer? Is a protein processor losing yield because of outdated forming or slicing equipment? Capital planning must translate those pressures into measurable goals such as lines per minute, pounds per hour, OEE improvement, labor reduction, margin lift, or utility cost savings. Stage 2 evaluates alternatives. This is often where companies discover that the original assumption was incomplete. A new packaging line may require electrical service upgrades, compressed air storage, additional floor drains, or revised ingredient handling. A relocation project may need a new syrup room, boiler capacity, wastewater pretreatment, and controls integration. In many cases, the least expensive equipment quote is not the lowest total installed cost. Stage 3 is the transition from possibility to execution logic. Here, planners define sanitary zoning, process adjacency, traffic flow, control architecture, maintenance access, allergen separation, and phasing strategy. This stage often makes or breaks a brownfield project because production continuity must be balanced with construction access. Stage 4 focuses on engineering depth, procurement timing, local permitting, and field execution. In major U.S. manufacturing hubs such as Chicago, Charlotte, Fresno, Houston, and Indianapolis, contractor availability and lead times can materially affect budget and schedule. Long-lead items like boilers, switchgear, fillers, tanks, retorts, chillers, and automation hardware should be tracked early. Stage 5 covers commissioning, operator training, control tuning, punch list closure, and performance verification. For food processors, startup is not complete when the line turns on. It is complete when the line produces safe product at expected throughput with acceptable scrap, labor, and cleaning time. One of the first planning decisions is selecting the right project type. Food manufacturers usually choose between a greenfield build, an expansion of existing space, or a renovation/retrofit of current operations. Each has different economics, risks, and speed profiles. A greenfield project is often the best choice when a manufacturer needs a highly efficient process flow, modern utility infrastructure, higher automation, or large-scale expansion. This is common in fast-growing beverage, dairy, and prepared foods operations near logistics corridors such as Atlanta, Nashville, Phoenix, or the Inland Empire. Greenfield allows better segregation of raw and ready-to-eat zones, cleaner forklift routes, improved wastewater strategy, and future line installation space. An expansion works well when the existing site has strong labor retention, favorable tax position, good utility service, and enough land. Manufacturers near established trade hubs like Columbus, Memphis, or the Port of Houston often prefer this option because they can preserve current operations while adding capacity. Renovation is usually driven by aging infrastructure, sanitation concerns, compliance gaps, or automation needs. It can deliver excellent returns, especially when the core business is strong but the plant was not designed for current SKU complexity. However, renovations carry significant execution risk because hidden field conditions, utility congestion, and production downtime can erode the budget fast. Choosing among these options should be based on total business impact, not just initial capital. If an expansion saves $2 million but limits future throughput or creates an unmanageable sanitation workflow, the “cheaper” option may be more expensive over five years. Cost estimating for food processing projects is often where optimism causes trouble. Realistic capital estimates should include direct process equipment costs, installation, utilities, automation, building modifications, permitting, startup support, contingency, and internal owner costs. In live manufacturing environments, temporary systems, weekend shutdown labor, overtime, and sanitation controls can add meaningful cost. In the United States, cost estimates are heavily influenced by region, local labor rates, contractor competition, freight, utility interconnection requirements, and lead times. A beverage project in Southern California may face different electrical, mechanical, and permitting costs than a similar project in North Carolina or Iowa. A reliable estimate usually improves through stages. A rough order of magnitude estimate may be acceptable for early portfolio screening, but a funding request should be tied to a defined basis of design. That means the company understands the process capacities, utility assumptions, equipment list, site constraints, shutdown windows, and project delivery model. Food processors should also distinguish between capital efficiency and cost cutting. Removing CIP automation, under-sizing refrigeration, or minimizing drainage improvements may reduce initial spend but create long-term operating losses. The right estimate reflects lifecycle value. This is where service capability matters. Firms like DPS support capital planning, feasibility, owner representation, project management, and full execution, which helps align the estimate with how the project will actually be built and operated. The result is usually better budget confidence and fewer surprises in the field. Capital projects fail when departments agree too late. Engineering may prioritize technical robustness, operations may focus on uptime and labor, while finance may pressure for lower capital intensity and faster payback. Effective planning aligns these groups early around common assumptions. Engineering needs to define what the process requires: vessel sizing, thermal process design, controls architecture, utility demand, sanitary design, and maintainability. Operations needs to validate shift patterns, cleaning windows, staffing, changeover time, warehouse flow, and operator capability. Finance needs clear cost categories, cash flow timing, ROI logic, and risk-adjusted alternatives. Cross-functional planning should also include procurement, quality, maintenance, safety, IT/OT, and in some cases commercial teams. For example, a new beverage line may be justified based on customer demand, but if packaging material lead times, recipe control, and utility reliability are not aligned, the project may miss launch dates. Strong capital teams use decision gates. At each gate, leaders confirm scope, budget confidence, major risks, and go/no-go criteria. This keeps enthusiasm from outrunning evidence. Technological capability is especially relevant here. A food and beverage engineering partner should understand structural, mechanical, plumbing, electrical, process, and controls integration—not just one discipline in isolation. DPS is positioned in this space with capabilities spanning PLC programming, automation, SCADA, process engineering, utility systems, and full project engineering, which is valuable when the project depends on system-level coordination instead of standalone equipment procurement. Manufacturing capability matters too. Planning is stronger when the project team understands fermentation systems, pasteurization, aseptic processing, carbonation, blending, retort, dairy systems, protein handling, marination, cooking, slicing, and CIP from an operating perspective. That experience reduces the gap between drawings and real plant behavior. Risk management in food manufacturing capital projects is not just about safety and construction claims. It includes food safety, utility resilience, startup performance, labor readiness, regulatory timing, and commercial exposure. A delayed launch for a retailer program or co-packing contract can have larger consequences than the direct construction overrun. The most common risk categories include scope risk, schedule risk, cost escalation, utility insufficiency, process integration failure, sanitary design gaps, vendor delays, contractor coordination issues, and staffing readiness. Brownfield work adds hidden field conditions, shutdown dependency, and contamination control risks. Good planning creates a live risk register with assigned owners, probability and impact ratings, mitigation actions, and trigger dates. For example, if switchgear lead time is 40 weeks, electrical procurement becomes a critical path risk. If the project requires USDA inspection layout approval, that review must be built into the schedule early. If the facility is in a water-stressed or wastewater-sensitive region, discharge capacity must be verified before detailed design. Service capability is again important here. An end-to-end model that covers design, build, and management can reduce handoff risk. DPS uses a design-build-manage approach that combines engineering, contractor oversight, installation coordination, and execution control. For owners, this can improve accountability across the project lifecycle, especially when multiple trades and process vendors must be synchronized. Food manufacturing project schedules vary widely, but many U.S. processors underestimate the time required for front-end planning, permitting, procurement, installation sequencing, and startup stabilization. A realistic timeline depends on project type, site conditions, utility upgrades, OEM lead times, and whether production continues during construction. A small line addition might move from concept to startup in 6 to 10 months. A major expansion often takes 12 to 18 months. A greenfield facility can easily require 18 to 30 months depending on complexity, site development, and equipment lead times. Ports, freight corridors, and labor markets also influence timing. Projects tied to import equipment through Long Beach, Savannah, Houston, or Newark should consider transport and customs timing. Facilities in high-growth regions may face tighter contractor availability and longer permit cycles. Commissioning should be treated as a business milestone, not a final construction activity. SATs, utility verification, CIP validation, alarm testing, recipe checks, and production trials must all be planned in detail. If the project includes proprietary equipment, custom controls, or unusual process integration, the startup plan should include extra buffer. For manufacturers seeking outside support, it helps to work with partners who can manage the full sequence from engineering through installation and turnover. DPS also manufactures selected process equipment, including tanks, CIP systems, marination tumblers, and cooking vessels. That manufacturing capability can simplify coordination on projects where custom equipment fit, lead time, and integration are critical. More detail on available systems can be found through its process equipment offerings. Many companies approve projects using careful financial models, then fail to measure whether the promised value was delivered. Post-project review is essential because it turns a one-time project into organizational learning. ROI review should compare approved assumptions against actual outcomes in at least six areas: throughput, yield, labor, downtime, utility cost, and quality performance. It should also measure whether the project improved strategic position—such as winning a new customer, enabling a new package format, or reducing compliance exposure. A good review usually occurs in stages: at mechanical completion, after initial startup, after 60 to 90 days of operation, and again after a full business cycle. The last review is especially important for seasonal products or plants with fluctuating SKU mix. Case examples often show that the best returns come from identifying the real constraint, not the most visible one. Sometimes a processor thinks it needs building expansion, but the actual issue is controls logic, packaging balance, utility instability, or sanitation downtime. This is one reason owners value firms that challenge assumptions. DPS has built its reputation around that style of engagement, including project work where detailed analysis uncovered a lower-cost path to meaningful capacity gain before larger capital was committed. Additional examples of project thinking and execution can be explored in its project case studies. Looking ahead to 2026, post-project ROI analysis will increasingly include sustainability and digital metrics. More U.S. food and beverage companies are evaluating energy intensity, water reuse, emissions impact, traceability readiness, cyber-resilience of controls, and data quality for predictive maintenance. Policy pressure, retailer expectations, and utility pricing will keep these factors in the capital planning conversation. Future-ready projects are likely to prioritize modular utility systems, smarter SCADA layers, recipe and batch visibility, energy management dashboards, heat recovery, improved wastewater strategies, and layout flexibility for shifting product mix. In sectors such as RTD beverages, dairy alternatives, prepared proteins, and aseptic foods, the plants that win will usually be those designed for both efficiency and adaptation. What is the first step in a food manufacturing capital project?The first step is defining the business problem clearly. That may be capacity growth, compliance improvement, labor reduction, margin protection, or a new product launch. Without a defined objective, the project can become an equipment shopping exercise instead of a strategic investment. How long does capital project planning take?Early planning can take a few weeks for a small line project or several months for a major expansion or greenfield plant. The more complex the process, utility, and compliance requirements, the more important front-end planning becomes. What is the difference between a ROM estimate and a final budget?A ROM estimate is a rough early-stage budget based on limited definition. A final funding budget should be built on a clearer basis of design, known site constraints, utility assumptions, schedule logic, and vendor or contractor input. When should food manufacturers choose renovation instead of expansion?Renovation is often the right choice when the existing building has strong strategic value and the main issues are sanitation, compliance, aging utilities, or outdated process flow. Expansion is better when the site can support additional footprint and future growth without major operational conflicts. Why do food projects go over budget?Common causes include incomplete scope, underestimated utilities, poor existing-condition data, uncontrolled changes, late vendor decisions, weak shutdown planning, and insufficient contingency for brownfield conditions. How important is automation in capital planning?Very important. Controls, PLC logic, SCADA, recipe management, and integration often determine whether a project delivers the expected throughput, consistency, and labor savings. Automation should be planned as part of the process, not added at the end. What should be included in a commissioning plan?A commissioning plan should include mechanical completion checks, utility verification, controls testing, CIP confirmation, alarm testing, operator training, production trial criteria, documentation, and performance acceptance standards. How do I evaluate an engineering and project delivery partner?Look for food-industry process knowledge, multidisciplinary engineering depth, utility and controls expertise, field execution capability, regulatory familiarity, transparent estimating, and a track record of solving root problems rather than simply selling scope. What U.S. market trends will shape food capital planning in 2026?Expect stronger focus on automation, energy efficiency, water stewardship, resilient domestic supply chains, cybersecurity for industrial controls, modular expansion strategies, and projects that can flex across multiple SKUs and channels. Why does location matter in U.S. project planning?Location affects labor cost, access to trades, freight, utility availability, wastewater capacity, tax incentives, permitting speed, and logistics. A project near Charlotte, Chicago, Los Angeles, Houston, or Savannah may have very different constraints and opportunities than one in a rural processing corridor. -
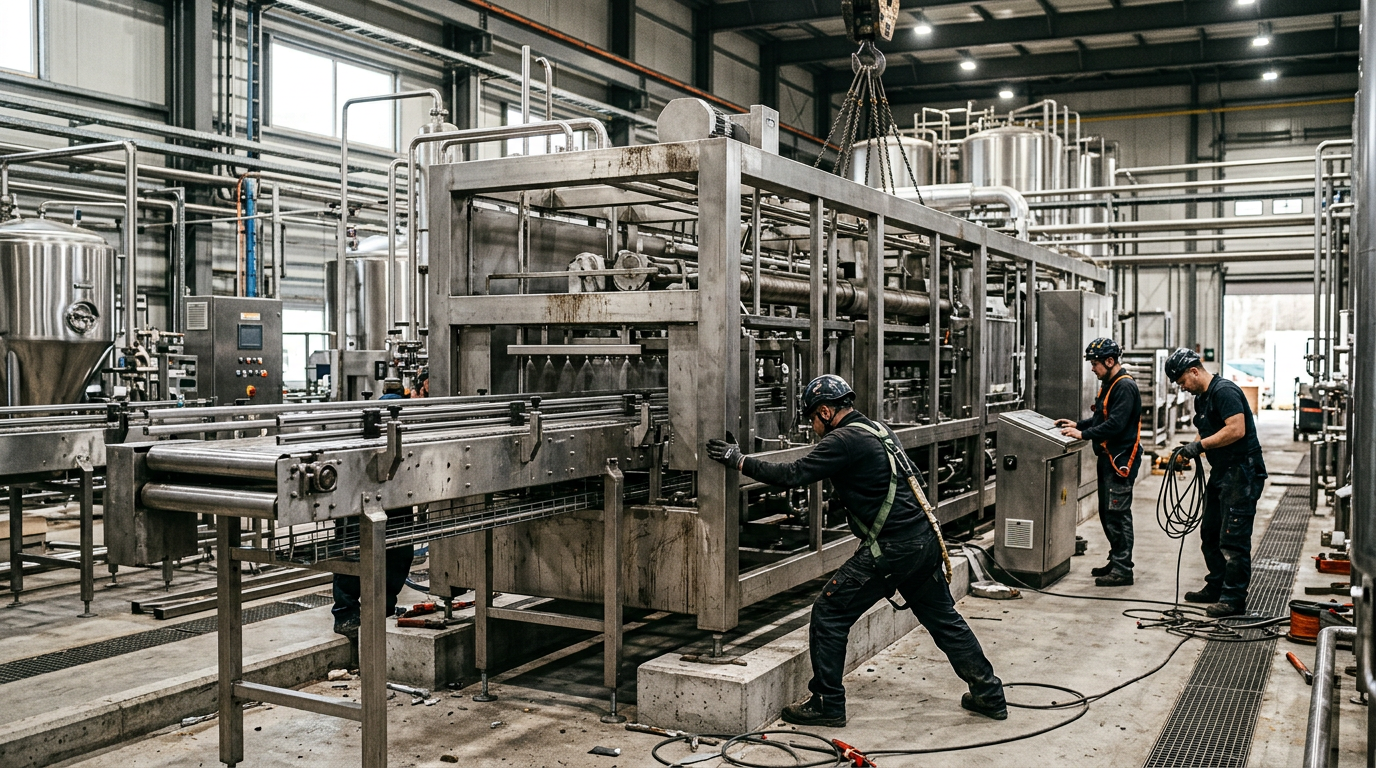
Food Plant Capital Planning Services
Food manufacturers in the United States rarely fail because they buy too little equipment. More often, they miss production, margin, or schedule targets because the full capital picture was not defined early enough. Food plant capital planning is the process of aligning plant investments with throughput, compliance, labor, utilities, cash flow, and long-term business goals. In practice, that means turning growth ideas into a disciplined roadmap for processing lines, utilities, buildings, controls, installation, and startup while protecting return on investment. For processors in markets such as Chicago, Dallas, Los Angeles, Atlanta, Fresno, Charlotte, and the broader Midwest and Southeast manufacturing corridors, capital decisions are shaped by freight access, labor conditions, water and wastewater constraints, utility capacity, and retailer or co-manufacturing demand. Facilities near the Port of Savannah, Port of Los Angeles, Port of Houston, and rail-connected hubs across the United States often face different cost and schedule pressures than inland greenfield sites. A strong capital plan accounts for those realities before money is committed. Disruptive Process Solutions (DPS), a North Carolina-based food and beverage engineering partner serving all 50 states and Canada, approaches capital planning as a profitability exercise rather than a simple procurement exercise. That mindset matters because in food and beverage manufacturing, the right answer is not always “buy more steel.” Sometimes the answer is process redesign, automation changes, utility debottlenecking, or phased execution. Companies that think this way typically invest better, start up faster, and avoid expensive rework. Food plant capital planning is the structured process of deciding what a food or beverage facility should invest in, when it should invest, how much it will cost, and what business return it should produce. In the United States, a complete capital plan typically covers three cost buckets: fixed capital costs, startup and commissioning costs, and ongoing support or transition costs. It should also include a 1-year action plan, a 3-year investment roadmap, and a 5-year strategic capacity view. For most processing projects, equipment is only part of total spend. Site work, utilities, controls, permitting, installation, contractor management, contingency, commissioning, operator training, and production ramp-up often represent 50% or more of the real investment. That is why effective capital planning should connect engineering, operations, finance, maintenance, quality, and commercial demand forecasting from the beginning. The table above shows why capital planning is both a financial and operating discipline. A project that looks attractive on equipment quotes alone can become weak once downtime, utility upgrades, wastewater, and labor are included. Conversely, a well-planned modernization may deliver better return than a large expansion. Food plant capital planning is the process of translating business growth, replacement needs, compliance requirements, and efficiency goals into a practical plant investment strategy. It usually covers line additions, line relocations, packaging upgrades, utility expansion, refrigeration, steam, compressed air, wastewater, automation, storage, sanitary design improvements, and building modifications. In the United States market, capital planning is especially important because food and beverage facilities operate under tight margin pressure, strict food safety expectations, and growing retailer demands for service reliability. Processors handling protein, dairy, sauces, aseptic beverages, ready-to-drink products, frozen foods, retort products, ingredients, or co-packing programs all face a mix of regulatory and operational risks that can turn a poorly planned project into a major margin drag. A sound capital planning effort normally addresses five questions: This is where integrated engineering support becomes valuable. DPS supports clients with capital planning, feasibility, project management, and integration services so investment decisions are grounded in process reality. The firm works across food and beverage applications ranging from brewing, distillation, dairy, and aseptic systems to protein processing, prepared foods, and plant-based operations. That cross-category experience is useful because many processors now blend technologies, for example combining beverage-style clean utilities with food-style thermal processing and hygienic packaging. Capital planning also depends on local market context. A processor expanding near California’s Central Valley may focus heavily on water reuse, energy rates, and seasonal labor. A Gulf Coast or Texas facility may prioritize resilience, refrigerant strategy, and port-linked inbound supply. A Midwest protein plant may put more emphasis on wastewater loading, cold-chain capacity, and USDA inspection flow. Capital planning only works when those location-specific factors are reflected in the business case. Many project teams think in terms of one number: the purchase price. Effective food plant capital planning breaks total investment into three cost buckets so approvals are realistic and surprises are reduced. The table clarifies that a “capital budget” should not be limited to tangible equipment and piping. It must reflect the full cost to put the asset into stable production. That is especially true when manufacturers are retrofitting older facilities in places like New Jersey, Wisconsin, Ohio, or Pennsylvania, where hidden building and utility constraints are common. Bucket one, fixed capital costs, covers everything needed to physically create the solution. Bucket two, startup and commissioning, accounts for the cost of making the solution work consistently under commercial conditions. Bucket three, transition and support, protects continuity by covering spare parts, process documentation, maintenance readiness, and inventory or scheduling adjustments. Plants that fund only bucket one often end up “saving” money on paper while losing much more during startup. In many U.S. food and beverage projects, purchased equipment represents only 40% to 50% of total installed cost. The rest comes from integration. That includes sanitary piping, electrical distribution, MCC or VFD upgrades, PLC and HMI work, structural supports, floors and drains, HVAC changes, refrigeration tie-ins, compressed air, steam, condensate, water treatment, fire protection, permits, and contractor supervision. This reality surprises companies that rely too heavily on vendor quotations. A filler may cost $900,000, but if the room needs drainage upgrades, utility rerouting, air balancing, conveyor changes, line controls, and a weekend shutdown window, the all-in project could easily land at $1.8 million to $2.4 million. The same pattern appears in protein, dairy, aseptic, and thermal processing projects. The explanation is straightforward: equipment does not operate in isolation. A line is only productive when utilities, controls, product flow, quality checks, sanitation access, and packaging interfaces are all designed together. DPS is effective in this area because its technical capabilities span process, mechanical, structural, electrical, plumbing, and controls engineering, including PLC programming and SCADA. That integrated view helps clients evaluate total installed cost rather than partial cost. Another reason equipment is only part of total investment is compliance. In FDA, USDA, SQF, and BRC environments, installation details matter. Hygienic zoning, access for cleaning, allergen separation, utility reliability, and documentation can add cost, but they also reduce audit exposure and product risk. A low equipment quote that creates a sanitation or inspection problem is not a low-cost solution. The line chart illustrates a realistic upward trend in food plant capital activity, driven by automation, modernization, reshoring, and supply chain resilience. While individual years vary by product category, most processors are now prioritizing selective, ROI-focused capital over reactive spending. Strong capital plans do not stop at next year’s budget. They create a phased roadmap that balances urgent needs with long-term scale. For food plants in the United States, the most practical format is a 1-year, 3-year, and 5-year planning structure. The 1-year roadmap is tactical. It focuses on must-do projects such as risk reduction, compliance upgrades, utility stabilization, critical replacement, and near-term customer demand. The 3-year roadmap is portfolio-oriented. It should align capacity additions, process redesign, packaging automation, cold storage, and digital upgrades with expected sales growth. The 5-year roadmap is strategic. It asks whether the current facility footprint, labor model, and utility backbone can still support the business or whether major relocation, expansion, or greenfield investment is more rational. The purpose of this table is to show that each horizon answers a different business question. When all capital requests are forced into a single annual budget format, strategic projects compete unfairly with emergency replacements. A multi-year structure improves visibility and gives procurement, operations, and finance time to act intelligently. DPS often supports companies that want both strategic planning and execution speed. That combination matters when a manufacturer is growing quickly but cannot afford disruption to current output. Through its design-build-manage approach, the team can help define the roadmap, coordinate local trades, and manage execution across geographies. More on the company’s background is available on the about page, but the key point is that the company is built around project-based decision making and practical capital outcomes. The area chart highlights a clear trend shift: a larger share of food plant CapEx is moving toward controls, data, automation, and labor-reduction technologies. By 2026, this trend is expected to intensify as labor costs, traceability requirements, and energy management priorities continue to rise. One of the best ways to improve capital budget accuracy is to use historical location data from your own facility network and from comparable regional projects. U.S. costs vary materially by geography. Labor rates, permit timelines, freight, utility interconnection, local subcontractor depth, and environmental requirements can change the budget by double-digit percentages. Start by building a site-level history for at least five years. Track project type, budget, approved amount, final spend, downtime, production gain, and hidden scope categories. Then normalize those results by plant size, line type, and region. For example, a sanitary piping project in Southern California may carry different labor and inspection assumptions than a similar project in North Carolina or Missouri. The value of this table is practical: historical location data helps move the process from guesswork to patterned estimating. It also supports better governance because each new project can be compared against past performance rather than defended with isolated vendor quotes. In food and beverage environments, location data should also include sanitation and compliance history. If one site consistently spends more on drains, floor repairs, or HVAC balancing after installations, that pattern should shape future scope assumptions. Similarly, if a region has recurring delays from electrical service upgrades or wastewater discharge negotiations, that delay risk belongs in the budget and schedule from day one. DPS helps manufacturers connect facility history with future project design, especially when the plant needs more than equipment procurement. Because the company also handles project and program management, owners’ representation, and integration execution, historical lessons can be translated into actual project controls rather than left in a spreadsheet. Many processors blur the line between maintenance capital and operating maintenance expense. That creates confusion, underfunding, and poor asset decisions. The distinction should be clear. An operating maintenance budget covers routine spending required to keep current assets functioning: lubricants, minor repairs, standard parts, inspections, calibration, sanitation support, and normal labor. A maintenance capital plan covers larger asset renewal, reliability upgrades, and replacements that extend useful life, improve safety, or materially change performance. This comparison helps finance and operations classify spending consistently. It also matters for planning because maintenance capital competes with growth capital. If every large replacement is hidden inside operating budgets until failure, executives lose visibility into the true state of the asset base. Food plants with aging infrastructure in older industrial regions often need a formal maintenance capital plan covering utilities first: boilers, refrigeration, electrical distribution, air systems, and wastewater. These assets do not always drive excitement, but they determine whether production lines can perform. In many cases, a utility or controls upgrade creates more value than a new process unit. For manufacturers evaluating replacement and modernization paths, DPS’s technology capabilities are especially relevant. The company supports process and controls engineering across utilities, CIP, thermal systems, refrigeration-related interfaces, automation, and SCADA. That allows clients to compare repair, rebuild, and replace options on a system level rather than asset by asset. Strong governance does not slow good projects down. It helps the right projects move faster by clarifying requirements early. Food plant CapEx approval in the United States should combine stage-gate discipline with enough flexibility to respond to commercial timing and plant realities. Best practice starts with a common business-case template. Every project should define problem statement, scope boundaries, alternatives considered, total installed cost, schedule, downtime assumptions, food safety implications, labor impact, utility needs, and expected financial return. Projects should also identify what happens if the company does nothing. Useful governance usually follows these gates: Post-audits are often skipped, but they are essential. If a line was expected to increase throughput by 20% and delivers only 9%, leadership needs to know why. Was the problem the equipment, the controls logic, operator training, utility constraints, or demand assumptions? That learning improves future capital plans. The bar chart shows where demand for plant investment is likely to remain strong. RTD beverages, protein, and aseptic or shelf-stable categories continue to attract capital because they combine growth potential with operational complexity. Governance also depends on execution structure. DPS’s service capabilities are relevant here because the company can act as engineer, general contractor in licensed jurisdictions, owners’ representative, equipment supplier, and project manager. That broad role can simplify accountability if the owner wants one partner coordinating design, trade management, and startup readiness. To reduce approval friction, companies should rank projects in three portfolios: mandatory, maintenance capital, and growth capital. Mandatory projects cover safety, regulatory, and existential risks. Maintenance capital protects reliability. Growth capital targets margin expansion, volume growth, or strategic capability. That portfolio view makes board and executive decisions much cleaner. Food plant capital projects in the United States can be funded through several structures depending on project size, balance sheet strategy, and expected return. The best choice is not always the lowest headline interest rate. It is the structure that aligns capital cost, tax treatment, cash flow, and operating flexibility. Common financing options include cash funding, term loans, equipment leasing, sale-leaseback structures, state and local incentives, utility rebates, tax-advantaged programs, and in some cases vendor financing. Mid-market manufacturers often combine these methods. For example, they may use internal cash for engineering and site prep, then lease packaging equipment while financing utility backbone upgrades through a conventional facility loan. The table shows that financing should be chosen by asset profile, not habit. A utility plant, wastewater system, or building addition behaves differently from a mobile packaging machine or standard tank set. Matching funding structure to asset reality can materially improve the economics of a project. By 2026, financing decisions are expected to be influenced more heavily by sustainability metrics, energy resilience, and domestic supply chain strategy. Lenders and incentive programs are increasingly receptive to projects that reduce water usage, improve energy efficiency, add automation, or support reshored manufacturing capacity. Food processors planning boiler optimization, heat recovery, water reuse, advanced controls, or low-emission utility upgrades should evaluate incentive pathways early, not after design is complete. How often should a food plant update its capital plan?At minimum, once a year. High-growth manufacturers, co-packers, and facilities under customer-driven expansion pressure should review it quarterly. What is the right contingency for a food plant project?It depends on project phase and site condition. Early-stage concepts may need 15% to 25%. Detailed, well-defined projects in predictable environments may require less. Brownfield sites usually need more contingency than greenfield sites. What industries benefit most from formal capital planning?Protein, dairy, aseptic beverages, brewing, distillation, prepared foods, sauces, ingredients, frozen foods, shelf-stable foods, and contract manufacturing all benefit because process integration and compliance requirements are significant. Should engineering be engaged before equipment selection?Yes. Early engineering helps confirm process fit, utility load, layout, sanitation access, controls scope, and actual installed cost. It often prevents expensive misalignment between equipment choice and site reality. Can capital planning reduce downtime during expansion?Yes. A phased plan can sequence shutdowns, temporary bypasses, tie-ins, offsite fabrication, and startup windows so existing production is protected as much as possible. How do you compare local suppliers and integrators?Evaluate more than price. Compare sanitary expertise, schedule performance, controls depth, field supervision, geographic reach, documentation quality, and experience with FDA, USDA, SQF, or BRC projects. The comparison chart reflects a common U.S. procurement reality: equipment-only vendors can be valuable, but integrated project partners typically perform better where process complexity, site coordination, and startup risk are high. What should be included in a food plant feasibility study?Demand assumptions, process flow, site constraints, utility assessment, preliminary layout, ROM cost estimate, phasing plan, schedule, compliance considerations, and expected return. Is there a difference between food and beverage capital planning?Yes, but there is also overlap. Beverage projects often emphasize clean utilities, filling, blending, carbonation, thermal treatment, and high-speed packaging. Food projects may emphasize material handling, cooking, forming, thermal processing, washdown, and allergen management. Integrated firms with experience in both categories can often spot useful crossover solutions. What product types most often trigger a new capital cycle?RTD beverages, fermented products, aseptic products, co-packed items, value-added proteins, sauces, dairy-based beverages, and shelf-stable foods frequently trigger new investment because they demand specialized process and utility infrastructure. How should a company choose a planning partner?Choose a partner that understands process, utilities, installation, commissioning, and business return. Also look for honesty. The best partner is willing to challenge unnecessary spending if a lower-cost operational fix can solve the problem. That last point is central to DPS’s reputation. The company supports clients throughout North America with a business-first approach that emphasizes profitable projects, transparency, and execution discipline. Its manufacturing capabilities include proprietary process equipment such as tanks, CIP systems, tumblers, and vessels, while its field execution model supports turnkey installation and integration. You can review selected project examples and case studies or explore available process equipment offerings to see how planning and physical delivery connect. In practical terms, food plant capital planning is not about creating a perfect forecast. It is about making better decisions with clearer assumptions. For U.S. manufacturers facing labor pressure, retailer service demands, rising utility complexity, and stricter compliance expectations, the strongest capital plans will be the ones that tie engineering detail to business strategy. By 2026, the winning projects are likely to be those that combine throughput growth with automation, resilience, sustainability, and disciplined governance. Whether the project is a new beverage facility in the Southeast, a protein line upgrade in the Midwest, a dairy expansion in the Northeast, or an aseptic retrofit on the West Coast, the same rule applies: plan the whole system, not just the equipment. That is where capital turns into profitable manufacturing capacity. -
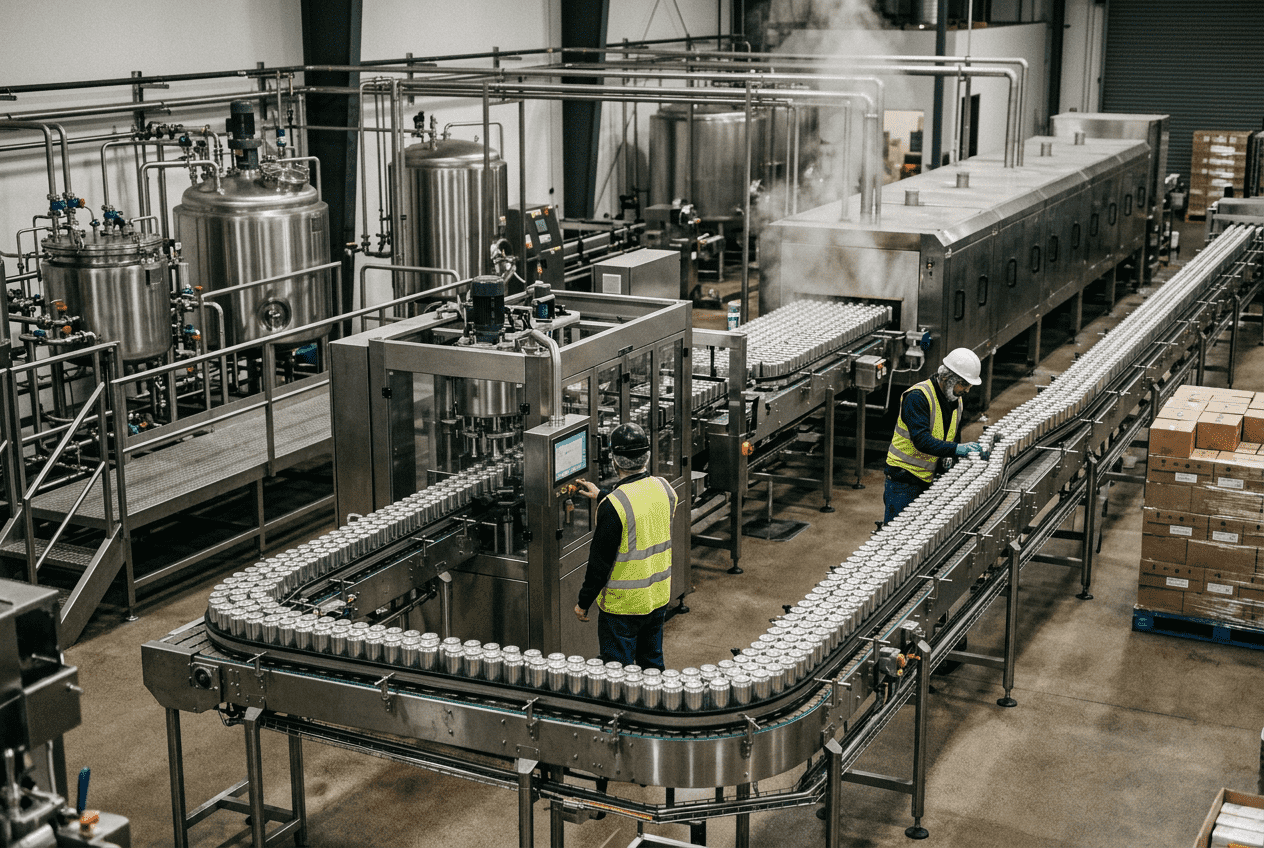
Beverage Processing Feasibility Study
Launching or expanding a beverage operation in the United States requires more than a good formula and a strong brand story. A beverage processing feasibility study tests whether the product can be made safely, profitably, and at the right commercial scale. It connects market demand, process design, packaging selection, utilities, labor, compliance, capital planning, and operating economics before major money is spent. For manufacturers evaluating juice, RTD coffee, energy drinks, functional beverages, dairy-based drinks, kombucha, carbonated soft drinks, spirits, or aseptic products, a strong feasibility study reduces risk and improves speed to market. A beverage processing feasibility study is a structured pre-project analysis used to determine whether a beverage product, plant, line expansion, or co-packing strategy is technically achievable, commercially viable, and financially sound in the United States. It usually examines product category fit, consumer demand, production volumes, pasteurization and filling requirements, packaging formats, water and wastewater infrastructure, utility loads, staffing, regulatory obligations, CAPEX, working capital, and the tradeoff between co-packing and in-house production. In practical terms, it answers questions such as: For U.S. beverage investors, founders, and plant operators, the feasibility phase is often where the best decisions are made. It is also where costly mistakes are avoided. A beverage processing feasibility study is a decision-making document that combines engineering, operations, and business planning. Unlike a simple market report, it goes into plant-level reality: ingredients, batch size, process sequence, thermal treatment, clean-in-place design, carbonation, blending, packaging speed, warehouse needs, utility demand, and compliance. In the United States, a robust study generally covers the following: For many manufacturers, the feasibility phase is the bridge between concept and execution. It is also where a partner with both engineering depth and project delivery experience becomes valuable. Disruptive Process Solutions supports beverage and food manufacturers across the United States and Canada with capital planning, feasibility studies, process engineering, installation, and project leadership built around profitability rather than equipment-first selling. Whether the project is in North Carolina, California, Texas, Illinois, New Jersey, or near logistics hubs such as the Port of Los Angeles, Port of Long Beach, Port of Savannah, Port of Houston, or Port Newark, site realities can shift feasibility outcomes dramatically. Freight costs, utility rates, labor availability, and local discharge limits all affect the business case. Beverage feasibility work overlaps with food processing in sanitation, utilities, automation, and compliance, but several factors make beverage projects different. Liquids move continuously, often at high speed, and slight changes in pH, dissolved oxygen, carbonation, or fill temperature can change shelf life and product quality. Packaging also has a much larger impact on throughput economics. The table below highlights major differences between beverage and broader food processing feasibility analysis. Because of these differences, copying a food plant evaluation framework into a beverage project can create blind spots. Beverage feasibility needs greater attention to package-line integration, utility balance, syrup or blend room design, clean product pathways, and high-speed filling performance. At the technology level, DPS brings cross-functional engineering across structural, mechanical, plumbing, electrical, process, and controls disciplines. That matters in beverage projects because process design cannot be separated from compressed air sizing, glycol demand, boiler capacity, clean steam, plant automation, or CIP return routing. Its teams also work with fermentation systems, distillation systems, carbonation, in-line blending, filtration, clarification, aseptic environments, and water treatment systems, making the feasibility work grounded in execution reality rather than theoretical layouts. Market feasibility asks a simple question with expensive consequences: what category should you actually build around? In the United States, category growth is uneven. Carbonated soft drinks remain large, but growth pockets are often stronger in functional beverages, zero-sugar formats, premium hydration, energy, RTD coffee, protein drinks, botanical beverages, and better-for-you sparkling products. Regional factors also matter. Wellness-forward launches may perform well in Southern California, Austin, Denver, Seattle, Boston, and Miami, while value-oriented or convenience-driven formats may do better in large grocery and club channels across the Midwest and Southeast. A feasibility study should compare category size with channel access and manufacturing complexity. A fast-growing category is not automatically a good entry point if it requires expensive aseptic filling, refrigerated distribution, or highly specialized ingredients. The table shows why category selection cannot be separated from process and packaging strategy. An attractive consumer trend may still be a poor fit if startup volume is too low for the equipment required. Below is a market growth view using realistic directional data for key U.S. beverage categories from 2022 through 2026. Industry demand also varies by customer type. Club stores, foodservice, c-stores, e-commerce, and direct-to-consumer all place different demands on pack size and line scheduling. For 2026, the strongest market signals are likely to center on reduced sugar, functional positioning, cleaner labels, localized sourcing stories, recyclable packaging, AI-supported demand planning, and automation that supports smaller, more frequent SKU runs. Technical feasibility is where the product concept meets engineering reality. The right process depends on acidity, shelf-life target, package type, product sensitivity, production volume, and route-to-market. A low-acid dairy beverage and a high-acid juice shot do not belong on the same process path without careful design logic. Common thermal and package approaches in U.S. beverage projects include: Packaging system selection is equally important. Cans dominate many growth categories because of shelf presence, recyclability, and strong logistics performance. PET remains important for value and high-volume formats. Glass still matters in premium, specialty, and some alcoholic beverage segments. Cartons and aseptic packs can win when shelf stability and brand position align. Trend shifts in the United States show growing preference for portable, recyclable, and premium-looking formats. Technical feasibility must also include utilities and controls. Beverage operations depend on well-designed CIP systems, steam or hot water generation, compressed air, process cooling, refrigeration where needed, electrical capacity, and production automation. DPS is especially relevant here because its process technology experience spans pasteurization and sterilization platforms, carbonation and bright tank systems, blending with in-line Brix monitoring, filtration, clarification, water treatment, PLC programming, SCADA, and full system integration. That depth helps ensure the selected process can actually be installed, controlled, cleaned, and scaled. From a manufacturing standpoint, DPS also designs and integrates complete systems for brewing, spirits, wine, kombucha, RTD, juices, soft drinks, dairy beverages, and aseptic applications. For projects requiring custom tanks, CIP skids, or purpose-built process vessels, its proprietary equipment capability can help reduce coordination gaps between design intent and delivered hardware. More about its equipment scope can be found through its process equipment solutions. Financial feasibility should not stop at quoted equipment prices. Many beverage projects fail financially because founders underestimate installation, controls integration, startup losses, utility tie-ins, spare parts, sanitation systems, warehousing, and the cash required to survive the ramp-up period. Typical U.S. beverage CAPEX categories include process equipment, packaging equipment, utilities, building modifications, automation, installation, commissioning, and contingency. Working capital then covers inventory, packaging materials, labor, receivables, and startup inefficiency. The table above shows why budget accuracy requires integrated engineering. It is also why owners often benefit from a partner that can move from feasibility into design-build execution. DPS uses a Design Build Manage model that aligns front-end planning with construction oversight and project management, helping clients avoid the disconnect between paper estimates and field conditions. Its broader engineering and project services are especially useful when timing, compliance, and capital discipline are all important. Working capital is just as important as CAPEX. The following table provides a practical framework. Buying advice for the U.S. market: do not approve a beverage project based only on vendor quotations. Ask for a full installed cost model, a ramp-up cash model, and a sensitivity analysis for line efficiency, ingredient pricing, and freight. A feasibility study should show best case, expected case, and downside case economics. Water is often the most underestimated variable in beverage processing feasibility. In many beverages, it is both a utility and a primary ingredient. Even when municipal water is available, hardness, alkalinity, chlorine residual, seasonal variability, and microbial profile can affect flavor and process consistency. Water feasibility in the United States should examine: Different regions present different water realities. The Southwest may face scarcity and higher scrutiny on usage efficiency. Parts of the Midwest may offer lower-cost utilities but require attention to hardness. Coastal industrial corridors can provide logistics advantages while imposing stricter discharge expectations. In locations such as Houston, Los Angeles, Chicago, Atlanta, and New Jersey manufacturing corridors, utility and wastewater discussions should begin early, not after process equipment is selected. This is an area where service capability matters more than isolated equipment supply. DPS supports feasibility, capital planning, owner’s representation, project management, system integration, and installation with strong regulatory fluency across FDA, USDA, SQF, and BRC environments. For beverage clients, that means water, utilities, compliance, and plant execution can be handled within one coordinated project strategy rather than in disconnected pieces. One of the biggest strategic decisions in beverage feasibility is whether to launch through a co-packer or build internal capacity. The right answer depends on volume, margin, process complexity, brand control, and funding. Co-packing can lower upfront capital and accelerate launch, but it may limit scheduling flexibility, margin, proprietary process control, and long-term scalability. In-house manufacturing offers control and asset value but requires more capital, more management depth, and more execution risk. The comparison below helps frame the decision. For many brands, the best path is staged: begin with co-packing, prove demand, then transition selected SKUs in-house once volume and margin justify investment. This is especially useful for founders testing regional demand in markets like the Northeast corridor, Southern California, Texas, or the Southeast before committing to a full plant. Supplier and operating model comparison can also be visualized by scoring key criteria. Case experience matters in this decision. DPS has supported both beverage manufacturers and co-packing environments, including large-scale beverage infrastructure programs built around first-year profitability and future capacity expansion. Examples of project thinking and execution style can be explored through selected project case studies. Timing is often underestimated. In the United States, beverage projects can move quickly when decisions are clear and utility or permit constraints are limited, but many projects stretch because of package changes, building surprises, long-lead equipment, or late-stage regulatory issues. A realistic feasibility-to-startup timeline should include gates, not just dates. Important milestone advice: Looking toward 2026, beverage feasibility studies should also account for AI-assisted maintenance, more advanced plant data integration, sustainability reporting expectations, greater pressure for water efficiency, expanded interest in electrification where practical, and stronger retailer emphasis on resilient supply chains. For owners choosing a project partner, buying advice is straightforward: work with a team that can challenge assumptions, not just validate them. A technically strong and commercially grounded feasibility effort should sometimes tell you not to spend money, or to spend it differently. That business-first mindset is central to how DPS approaches projects across North America, combining process engineering, capital planning, project management, installation, and owner-side advocacy with a lean structure that supports faster decisions and practical execution. What does a beverage processing feasibility study cost in the United States?Costs vary by project size and complexity. A narrow assessment for a single SKU and co-packing path may be modest, while a full greenfield or brownfield analysis with process design, utility review, and CAPEX modeling is more substantial. The right scope depends on investment risk and decision value. How long does a beverage feasibility study usually take?Many studies take 4 to 10 weeks. Complex projects involving site selection, wastewater analysis, multiple package formats, or aseptic processing can take longer. When should I choose co-packing instead of building a plant?Co-packing is often better for lower initial volumes, uncertain demand, limited capital, or fast market entry. In-house production becomes more attractive when volume stabilizes, margins matter more, and process or quality control is strategically important. What is the biggest mistake in beverage plant planning?Underestimating utility, wastewater, packaging, and working capital requirements. Many projects focus too heavily on the filler and not enough on the full system that supports profitable operation. Why is water such a major issue in beverage feasibility?Because water affects both product quality and operating cost. It influences taste, sanitation, treatment systems, and wastewater discharge. A poor early water assessment can derail budgets and timelines later. Do all beverage products need pasteurization?No. The required process depends on product chemistry, microbiological risk, shelf-life target, package type, and distribution method. Some products need HTST or UHT, others may use hot fill, tunnel pasteurization, HPP, or aseptic systems. Can one line run multiple beverage categories?Sometimes, but only if product chemistry, allergen profile, cleaning validation, package type, and throughput needs are compatible. Multi-category flexibility is valuable but should not be assumed without engineering review. How important is automation in a feasibility study?Very important. PLC programming, SCADA visibility, recipe management, in-line quality measurement, and CIP validation all affect consistency, labor use, troubleshooting speed, and long-term profitability. What U.S. regions are attractive for beverage manufacturing?It depends on your channels and ingredients. The Southeast offers strong logistics and growing manufacturing bases. Texas offers scale and central access. Southern California provides market proximity and innovation energy. The Midwest can offer efficient distribution and labor advantages. Port proximity matters for imported ingredients and packaging. How do I know if a feasibility partner is credible?Look for practical experience in beverage process design, utilities, packaging integration, compliance, installation, and startup support. The strongest partners connect engineering decisions directly to commercial outcomes and can support implementation after the study. A well-built beverage processing feasibility study is not just a report. It is a decision framework for capital, timing, process choice, and market entry. In the United States, where speed, compliance, and margin pressure all matter, disciplined front-end planning remains one of the most valuable investments a beverage company can make. -
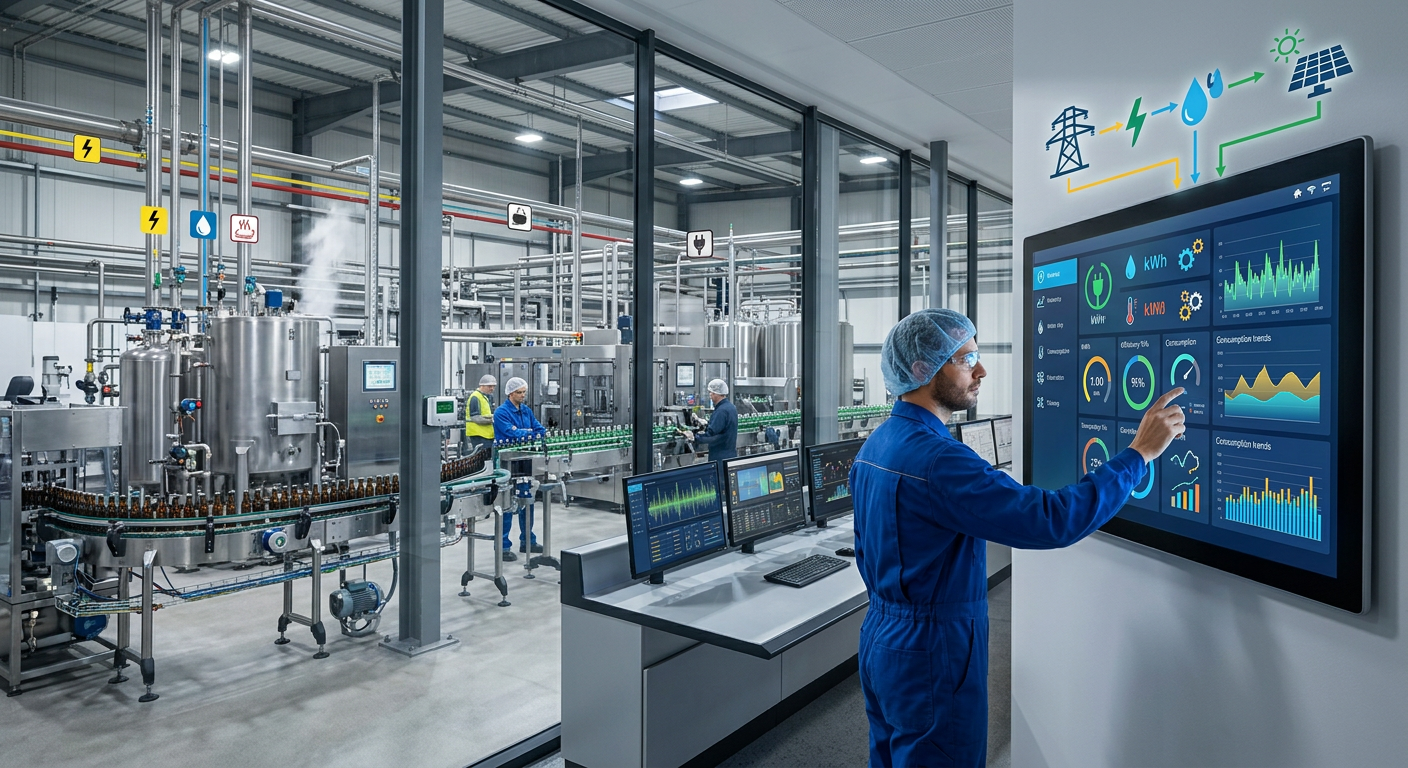
2026 Food Facility Post-Construction Support Services Guide
Bringing a new food or beverage facility online is only the beginning. Once construction, installation, and commissioning are complete, the real commercial test starts: keeping equipment stable, operators confident, documentation current, and output profitable. In the United States, post-construction support is now a decisive factor for plants in Chicago, Dallas-Fort Worth, Fresno, Charlotte, Atlanta, Philadelphia, and major logistics corridors tied to ports such as Los Angeles, Long Beach, Savannah, Houston, and New York/New Jersey. For processors launching new lines or expanding existing capacity, the difference between a strong first year and a painful ramp-up usually comes down to how well support is planned after handoff. This guide explains what manufacturers should put in place after project completion, including preventive maintenance planning, spare parts management, performance optimization, operator continued training, equipment calibration scheduling, regulatory audit support, and technology upgrade pathways. It also outlines how to evaluate partners, where regional support matters, which product categories need the most attention, and how a company such as Disruptive Process Solutions can help manufacturers protect capital investments over the long term. The quickest answer is this: a food facility in the United States should not treat project completion as the end of the job. A practical post-construction support program should begin before startup and continue through the first 12 to 24 months of operation. At minimum, it should include a site-specific preventive maintenance plan, a critical spare parts list, line performance reviews, repeated operator training, a calibration schedule, compliance document control, and a roadmap for future automation or capacity upgrades. For most U.S. processors, especially those running proteins, dairy, sauces, aseptic beverages, ready-to-drink products, brewing, distillation, or co-packing operations, the first year after construction determines whether the project delivers its intended return. Plants that lack structured support often see more unplanned downtime, higher ingredient losses, longer changeovers, missed sanitation windows, and audit pressure from FDA, USDA, SQF, or BRC expectations. By contrast, facilities that actively manage support can stabilize OEE, reduce emergency maintenance costs, and improve throughput without immediate new capital spending. Market conditions also make this more important in 2026. U.S. labor remains tight, utility costs are volatile, traceability expectations are increasing, and many manufacturers are under pressure to produce more SKUs with less downtime. In cities with major cold-chain, ingredient, and packaging networks such as Kansas City, Minneapolis, Memphis, and Jacksonville, speed to stable production is a major competitive advantage. A post-construction support strategy is no longer an optional service add-on; it is part of the capital project itself. The table above shows why the first support decisions should be tied directly to operating risk and financial return. Plants often focus heavily on startup acceptance testing but leave too much undefined after that point. A stronger model sets ownership, timing, and measurable objectives before the project closes. Preventive maintenance planning is the backbone of post-construction support. New equipment often enters production with OEM manuals, basic startup settings, and warranty guidance, but not with a plant-specific maintenance system. A meat processor in Omaha, a dairy plant in Wisconsin, or a beverage co-packer near the Inland Empire all face different operating realities. Run hours, washdown intensity, allergen changeovers, utility variability, and local technician availability all affect maintenance needs. An effective U.S. maintenance plan should combine OEM recommendations with real process conditions. It should include asset criticality ranking, lubrication routes, sanitation-related wear points, sensor verification checks, utilities inspections, and documented parts replacement intervals. The best plants also connect this plan to CMMS workflows so work orders, downtime codes, and parts consumption can be tracked from day one. For food and beverage plants, maintenance planning must go beyond the primary process line. Utility systems often create the most expensive failures. Boilers, compressors, glycol systems, refrigeration skids, process water systems, CIP sets, HVAC, steam traps, and controls panels can all interrupt production even when core processing equipment is technically available. In humid regions such as the Gulf Coast, corrosion control and enclosure sealing deserve extra attention. In colder markets such as Minnesota or upstate New York, freeze protection and seasonal utility reliability can shape maintenance priorities. The table above illustrates how maintenance planning should reflect the interaction between process equipment and site utilities. Plants that formalize this early generally see smoother ramp-up, more accurate labor planning, and better warranty conversations with suppliers. If the original project partner also understands engineering, installation, and operating context, the transition from startup support into long-term maintenance is typically more efficient. Buying advice for U.S. manufacturers: when evaluating a support provider, ask whether they can translate design intent into maintainable plant practice. The best partners do not simply hand over manuals. They help define PM tasks based on actual process risk, sanitation realities, and production goals. Spare parts management is where many otherwise well-built facilities lose money. A plant can invest millions in process equipment yet delay stocking the few sensors, seals, drives, valves, and control components most likely to stop the line. In the United States, freight access is strong but not universal. A processor in Southern California may source some items quickly through regional distribution, while a rural Midwest site may face longer lead times, especially for imported controls, specialty pumps, heat transfer components, or custom fabricated parts. The right approach is to classify spares into critical, operational, and strategic inventory. Critical items can halt food safety, utilities, or production immediately. Operational items support wear replacement and routine PM. Strategic items cover long-lead equipment or obsolescence risk. This is especially important in sectors such as aseptic processing, retort, dairy homogenization, carbonation, distillation, and protein portioning where a single failure can take down an entire value stream. Facilities should also think regionally. Plants in New Jersey or Pennsylvania may have better access to East Coast industrial support; sites in Texas benefit from central freight routes and broad contractor coverage; facilities near Sacramento, Fresno, or Modesto often depend on strong local agricultural processing supply networks; and plants around Charlotte, Raleigh, and Greenville can leverage growing manufacturing support ecosystems. Local supplier depth matters, but it should not replace central planning. This table is useful because it separates common spare types by urgency and practical handling. One of the best ways to reduce unnecessary inventory is to align the spare strategy with asset criticality and actual lead times instead of guesswork. Manufacturers that need integrated support after buildout often benefit from working with a firm that understands both process design and equipment sourcing. A partner with experience in tanks, CIP systems, utility equipment, and line integration can often define a smarter spare list than a distributor focused on only one category. To compare project examples and support approaches, facilities can review project case studies that show how engineered systems behave in real operating environments. System performance optimization is where post-construction support starts paying back capital. Many facilities assume that once a line meets startup acceptance criteria, it is already optimized. In practice, acceptance testing only confirms that the system can run under defined conditions. It does not mean the plant has reached the best combination of throughput, labor efficiency, utility use, quality performance, and changeover speed. Optimization should begin with baseline KPIs: OEE, first-pass quality, pounds or gallons per labor hour, utility intensity, giveaway, CIP cycle time, and scheduled versus unscheduled downtime. Then, the team should examine constraints. In some plants, the bottleneck is obvious, such as a filler, cooker, retort, tunnel pasteurizer, or packaging machine. In others, it may be less visible, such as recipe logic, line balancing, compressed air instability, ingredient staging, or operator sequence errors. This matters across product types. Beverage facilities often focus on syrup rooms, carbonation stability, filler efficiency, and CIP turnarounds. Dairy processors may prioritize temperature control, homogenization consistency, and aseptic reliability. Protein plants often target yield, marination consistency, slicing or portioning efficiency, and sanitation recovery time. Prepared foods and sauce manufacturers may focus on batching accuracy, thermal profiles, scrape-surface exchanger behavior, and packaging synchronization. The strongest optimization programs include controls review. Small PLC or SCADA changes can unlock measurable gains, especially when alarms, recipes, or interlocks were built conservatively during startup. In the United States, where many processors are trying to grow within existing footprints rather than build entirely new facilities, this type of performance review is often the fastest route to added capacity. The table shows why optimization needs to be measured in both technical and financial terms. Plants should tie each improvement effort to margin, capacity, labor efficiency, or compliance resilience. It is also wise to schedule formal reviews at 30, 90, and 180 days, then again after one full seasonal production cycle. For U.S. manufacturers thinking about future growth, 2026 trends point toward more predictive maintenance, expanded edge data collection, recipe analytics, energy dashboards, and digital traceability. Sustainability targets are also shifting optimization priorities. Water reuse in CIP, heat recovery, better compressed air management, and more efficient refrigeration control are becoming mainstream topics rather than special projects. Operator continued training is one of the most overlooked parts of support planning. New facilities usually receive initial startup training, but turnover, shift changes, line modifications, and production pressure quickly erode consistency. In food and beverage manufacturing, the operator is often the first control point for uptime, quality, sanitation readiness, and safety response. Training should be structured in layers. First is startup qualification for the original team. Second is post-startup reinforcement focused on actual plant conditions, not classroom assumptions. Third is recurring cross-training for new hires, relief operators, maintenance staff, sanitation teams, and supervisors. Finally, there should be retraining after process changes, software revisions, new SKUs, or audit findings. In the U.S. market, training should also reflect workforce realities. Multilingual workforces are common in California, Texas, Florida, and parts of the Midwest. Fast-growth co-packers near major distribution nodes often add staff quickly. Plants in highly regulated sectors such as dairy, aseptic processing, and USDA-inspected protein operations need training records that hold up during external review. Video job aids, line-specific SOPs, visual control boards, and short competency checks are often more effective than one-time manuals. Continued training is especially important when automation is expanding. As more processors adopt advanced PLC logic, SCADA dashboards, recipe control, inline sensors, and remote diagnostics, the skill gap between “can operate” and “can operate profitably” becomes larger. Training should therefore include process understanding, not just button-pushing. This training table helps facilities connect learning topics to measurable operating outcomes. The best programs keep training tied to the plant’s actual bottlenecks and recent incidents instead of running generic modules. From a buying perspective, ask whether your support partner can provide line-specific operator retraining after commissioning. Partners with field engineering, controls knowledge, and process experience are usually more effective than trainers who only understand documentation. Equipment calibration scheduling supports both product quality and regulatory defensibility. Every plant depends on trusted measurements: temperature, pressure, flow, conductivity, pH, weight, fill volume, Brix, metal detection, and more. If those measurements drift, decision-making drifts with them. In a pasteurized dairy system, a bad temperature signal can create safety risk. In a beverage batching system, poor Brix calibration can damage consistency and margin. In a protein operation, weight inaccuracies can affect giveaway and label compliance. A strong schedule should define critical instruments, calibration intervals, acceptable tolerance, reference standards, and response actions when a device is found out of tolerance. Plants also need a system for labeling status, managing due dates, retaining certificates, and evaluating product impact when deviations are discovered. For facilities serving national retailers or high-audit customers, calibration discipline is often reviewed in detail. In 2026, digital calibration logs and connected asset registers are becoming more common across U.S. plants, especially in larger operations around major manufacturing clusters such as the Carolinas, Southern California, the Great Lakes region, and Texas. This shift supports traceability, trending, and remote review, but the basics still matter most: correct interval, trained personnel, documented standards, and quick corrective action. The value of this schedule is that it aligns calibration frequency with product and process risk rather than treating every device the same. That allows plants to prioritize their most critical measurements and control audit exposure. Regulatory audit support is essential for food facilities in the United States because startup documentation alone rarely satisfies ongoing compliance needs. Once the line is running, plants must maintain evidence that systems are controlled, validated where needed, calibrated, sanitized, and operated according to approved procedures. Requirements differ by product category and oversight structure, but nearly every processor faces expectations linked to FDA preventive controls, USDA inspection environments, and customer or GFSI-based schemes such as SQF or BRC. Post-construction support should therefore include document organization, SOP review, PM and calibration record integrity, utility verification, change control, and readiness reviews before audits. This is particularly important after plant modifications. A seemingly simple change to a filler, batching routine, or thermal process can create documentation gaps if it is not handled through a formal review path. Plants should also prepare for growing attention to cybersecurity, traceability, environmental management, and sustainability claims. In 2026, more customers are asking not just whether a plant can produce safely, but whether it can document energy usage, water stewardship, and process accountability. Facilities shipping through national retail networks or export channels via ports like Houston, Savannah, or Los Angeles often face even stronger customer documentation demands. When choosing support, manufacturers should look for teams that can bridge engineering and compliance. That means understanding utilities, controls, sanitation, process flow, and line change impacts while also supporting documentation expected by quality teams and auditors. Technology upgrade pathways should be defined early, even if the initial project budget is tight. Many U.S. plants open with a practical first-phase system and plan to automate further as volume grows. That is a sound strategy, but only if the original architecture leaves room for future expansion. The most expensive upgrade is the one that requires ripping out recently installed assets because there was no scalable plan. A good roadmap identifies what can be upgraded in phases: PLC standardization, SCADA visibility, recipe and batch control, additional tankage, advanced CIP automation, inline quality monitoring, energy metering, warehouse integration, packaging robotics, and predictive analytics. For a co-packer in the Southeast, the priority may be fast SKU flexibility. For a dairy processor in the Midwest, it may be aseptic reliability and thermal data integrity. For a beverage site near Phoenix or Southern California, water efficiency and utility optimization may lead the list. Policy and sustainability trends are shaping 2026 planning. Water use scrutiny is increasing in drought-sensitive regions. Energy management is drawing more executive attention as utility costs fluctuate. More retailers and investors are also asking for measurable progress on emissions, waste reduction, and responsible capital use. Upgrade planning should therefore consider not just growth, but resilience and resource efficiency. When evaluating upgrade options, manufacturers should ask four questions. First, will the upgrade improve throughput, quality, utility cost, labor efficiency, or compliance? Second, can it be integrated without major disruption? Third, is the existing controls and utility infrastructure ready? Fourth, does the supplier understand both process operations and future business goals? That last question is often the difference between buying isolated equipment and building a scalable manufacturing platform. Companies looking for full-scope support often benefit from reviewing the range of engineering and project services available from partners that can design, build, and manage upgrades over time rather than treating each change as an isolated job. Disruptive Process Solutions, often called DPS, is relevant in this space because it approaches projects and post-construction support as a long-term manufacturing and profitability challenge, not just a construction exercise. For U.S. processors that need continuity between design, installation, startup, and operational improvement, that matters. From a technological capabilities standpoint, DPS works across process, mechanical, plumbing, structural, electrical, and controls disciplines. That means support can extend from utilities and process flow to PLC programming, automation logic, SCADA visibility, and integrated system troubleshooting. For facilities trying to optimize HTST, UHT, retort, aseptic processing, blending, batching, carbonation, fermentation, distillation, or clean utility performance, this kind of cross-functional understanding is especially valuable because many problems sit at the boundary between process and controls rather than within a single machine. From a manufacturing capabilities standpoint, DPS supports both food and beverage environments and also manufactures selected process equipment. That includes tanks, custom CIP systems, marination tumblers, and cooking vessels, which helps when standard equipment does not fully match site conditions. Food applications can include proteins, prepared foods, dairy, sauces, plant-based products, and shelf-stable systems. Beverage applications can include brewing, spirits, wine, kombucha, juices, functional beverages, soft drinks, dairy-based beverages, and aseptic lines. A processor that needs support for utilities, vessel integration, sanitary process flow, or future capacity additions can benefit from working with a team that understands how these systems fit together physically and operationally. Facilities evaluating custom process assets can explore available equipment solutions as part of a broader support strategy. From a service capabilities standpoint, DPS offers engineering, capital planning, owner’s representation, project and program management, general contracting where licensed, equipment supply, installation, and full integration support across the United States and Canada. This is important after project completion because support needs are rarely limited to one discipline. A plant may require PM structuring, controls revisions, utility tuning, documentation updates, vendor coordination, or phased expansion planning all at once. DPS is built for project-based execution with a practical, lean model that can move quickly while still aligning decisions to long-term business performance. What also sets DPS apart is operating philosophy. The company emphasizes transparent guidance and is willing to recommend operational fixes in place of unnecessary capital spending when that is the better answer. That mindset is useful in post-construction support, where a plant may not need a new line at all, but rather smarter programming, better balancing, improved training, or a more disciplined maintenance and calibration system. For manufacturers seeking a partner that can bridge support, optimization, and future capital planning, the DPS approach reflects the reality of modern food and beverage operations in the United States: profitability depends on integrated thinking. More details on the company’s background and working model are available on the company overview page. What is the most important post-construction support activity in the first 90 days?The most important activity is establishing disciplined operating control through preventive maintenance, operator retraining, and line performance review. These three actions usually reveal the majority of startup-related issues before they become chronic losses. How much spare inventory should a new plant carry?There is no single number. Inventory should be based on asset criticality, lead time, sanitation wear, and production risk. Plants with imported controls, custom thermal systems, or remote locations usually need deeper strategic coverage. How often should calibration be scheduled?It depends on risk. Critical food safety measurements may require monthly or even more frequent verification, while lower-risk devices may be scheduled quarterly, semiannually, or annually. The key is documented rationale and fast response to out-of-tolerance findings. When should system optimization begin?Immediately after startup stabilization. A good pattern is a structured review at 30 days, 90 days, 180 days, and after a full seasonal demand cycle. Waiting too long allows wasteful routines to become standard practice. Do all facilities need ongoing operator training after commissioning?Yes. Turnover, staffing changes, SKU complexity, and controls updates make one-time training insufficient. Ongoing refreshers are especially important for aseptic, dairy, USDA-inspected, and high-mix packaging environments. How does support differ by industry?Beverage sites often emphasize syrup rooms, fillers, carbonation, and CIP speed. Protein plants focus more on yield, sanitation recovery, and handling robustness. Dairy, retort, and aseptic operations place heavier emphasis on validation, calibration, and process integrity. What should buyers ask before selecting a support partner?Ask whether the partner understands your product, utilities, controls, compliance environment, and future capacity plan. Also ask how they manage documentation, training, and measurable optimization after startup. Can a plant improve output without new equipment?Often yes. Many U.S. facilities recover meaningful capacity through PLC changes, line balancing, PM discipline, better changeovers, and utility optimization before adding new capital. What future trend will shape post-construction support most in 2026?The biggest trend is the convergence of predictive maintenance, digital documentation, resource efficiency, and automation-ready upgrade planning. Plants will need support systems that are both audit-ready and data-driven. -
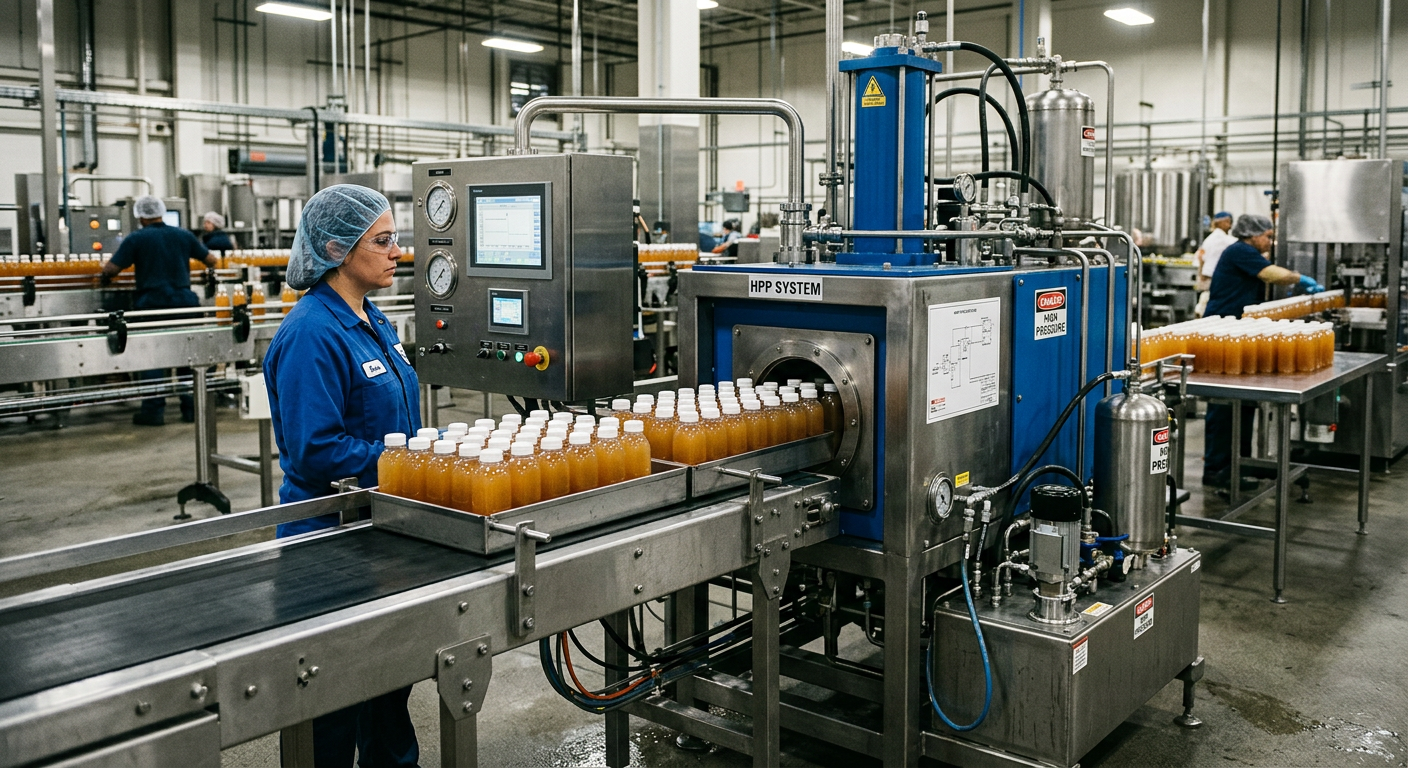
Food Processing Feasibility Study
Food and beverage manufacturers in the United States face a more complex capital planning environment than ever before. Inflation in utilities and labor, retailer pressure on margins, FSMA enforcement, changing consumer demand, and supply chain volatility all make it risky to approve a new processing line or plant expansion without disciplined analysis. A well-built food processing feasibility study reduces that risk by testing whether a project is commercially, technically, operationally, financially, and regulatorily sound before major capital is committed. This guide explains how decision-makers in the United States should evaluate food processing projects, from greenfield plants in Texas or North Carolina to brownfield retrofits in legacy industrial corridors like Chicago, New Jersey, or California’s Central Valley. It also shows how a practical engineering partner can turn feasibility from a paper exercise into a profit-focused execution roadmap. Companies that need integrated support for planning, engineering, and installation often start by reviewing the team and approach behind DPS, then align study assumptions with real construction and commissioning realities. A food processing feasibility study is a structured evaluation of whether a proposed manufacturing project should move forward, how it should be designed, what it should cost, how it should be supplied, and when it can generate acceptable returns. In the United States, a credible study typically assesses market demand, product mix, plant location, utility capacity, process flow, equipment needs, labor availability, food safety compliance, capital cost, operating cost, and five-year financial performance including payback, NPV, and IRR. For executives, the quick test is simple: if the study cannot clearly answer who will buy the product, how the plant will run, where raw materials will come from, what compliance framework applies, and whether returns exceed capital risk, the project is not yet ready for approval. The table above shows why feasibility is not just a market study. It is the decision framework connecting sales assumptions to engineering, compliance, and project execution. A food processing feasibility study is a pre-investment analysis used to determine whether a new plant, expansion, line conversion, co-packing operation, utility upgrade, or equipment relocation is commercially viable and operationally executable. In the United States market, this work often sits between early business planning and full detailed engineering. The strongest studies are interdisciplinary. They combine sales strategy, process engineering, industrial utilities, automation logic, food safety controls, labor planning, and capital economics. For example, a sauce plant in New Jersey may look attractive based on customer demand alone, but feasibility may reveal inadequate wastewater capacity, limited dock circulation, or poor CIP design assumptions that would make the original plan far more expensive than expected. A serious study usually includes: In practice, feasibility is most valuable when it is grounded in execution experience. A study written without understanding installation sequencing, commissioning realities, controls integration, or sanitation design often creates false confidence. That is why many manufacturers prefer a group that can move from planning into implementation through one operating model. A broader look at food and beverage engineering services helps illustrate how feasibility should connect directly to design, construction, and startup. In the United States, most food processing feasibility studies fall into two broad categories: greenfield and brownfield. A greenfield project starts with undeveloped land or a shell building and creates a new operating platform. These projects are common in growth corridors such as Texas, Tennessee, the Carolinas, Arizona, and parts of the Midwest where land, labor pools, and highway access support long-term expansion. Greenfield feasibility usually focuses on master planning, utility infrastructure, permitting timeline, zoning compatibility, wastewater strategy, labor access, and future modular expansion. A brownfield project upgrades, repurposes, or expands an existing facility. These projects are common in established food hubs such as Chicago, Minneapolis, Fresno, Los Angeles, Philadelphia, Atlanta, and the I-95 corridor. Brownfield feasibility emphasizes current utility constraints, structural limitations, sanitation zoning, equipment relocation complexity, production continuity during construction, and hidden site conditions. The table makes one point clear: there is no universally better choice. A greenfield beverage co-pack site near Dallas can be ideal for long-term scale, while a brownfield protein facility near Kansas City may deliver faster returns if enough utilities and cold storage already exist. The right answer depends on timing, capital, existing assets, and commercial demand. Many of the most successful brownfield projects in the United States come from recognizing that the true constraint is not floor space but controls, flow, or scheduling. In one common scenario, line throughput appears maxed out, yet the real bottleneck lies in PLC programming, hold times, or changeover logic. A feasibility study must identify these hidden constraints before recommending expensive expansion. Market analysis is where many project teams become overly optimistic. A processor may assume growth because a category looks strong nationally, but plant-level feasibility requires much tighter validation. The study should test customer concentration, pricing power, retailer shelf dynamics, co-manufacturing alternatives, regional freight economics, and whether product demand is durable enough to support capital payback. In the United States, some of the strongest current and near-term categories include value-added proteins, better-for-you beverages, sauces and dressings, functional drinks, dairy-based beverages, premium prepared foods, aseptic shelf-stable items, and contract manufacturing for established brands seeking flexible capacity. Regional patterns matter too. Seafood processing opportunities differ sharply between the Gulf Coast, Pacific Northwest, and Northeast. Dairy economics differ between Wisconsin, Idaho, and upstate New York. Beverage freight advantages change around major intermodal hubs and ports like Savannah, Houston, Long Beach, and Newark. The explanation behind this table is simple: category attractiveness is not only about growth. Capex intensity, technical difficulty, and location-specific logistics can turn a promising market into a poor investment if the project is not properly structured. The line chart illustrates a realistic growth pattern in U.S. food processing capital demand. This does not mean every project should proceed. It means competition for capacity, labor, utilities, and equipment will likely stay elevated through 2026 and beyond. The bar chart compares practical project demand across key categories. High scores reflect where manufacturers are most actively evaluating new capacity, expansions, and co-packing partnerships. Technical feasibility determines whether the desired product can be manufactured at the right throughput, quality standard, and cost structure. This stage should define process flow diagrams, utility loads, material balances, sanitation strategy, line rates, automation needs, changeover design, labor touchpoints, and packaging integration. For U.S. processors, technical feasibility often includes choices such as HTST versus UHT, retort versus aseptic, batch versus continuous mixing, manual versus automated ingredient handling, hot fill versus cold fill, or fresh versus frozen distribution. The right answer depends on shelf life goals, customer specifications, labor economics, and facility constraints. This is also where technological capabilities matter. DPS supports projects with process, mechanical, plumbing, structural, electrical, and controls engineering, including PLC programming, automation, SCADA, batch control, and utility integration. Its technical base extends across fermentation, distillation, pasteurization, retort, aseptic systems, blending, Brix monitoring, filtration, water treatment, grinding, mixing, forming, cooking, smoking, slicing, emulsification, dairy systems, plant protein processing, and complete utility infrastructure. In feasibility work, that breadth matters because the process line cannot be evaluated in isolation from steam, chilled water, compressed air, CIP, wastewater, refrigeration, or controls architecture. The explanation here is crucial: food plant economics are often won or lost in process design details. An oversized kettle, undersized CIP skid, weak wastewater estimate, or poorly sequenced filler can destroy expected margins long before the business team notices. Manufacturing capabilities also deserve attention at the feasibility stage. DPS not only integrates third-party systems but also manufactures selected process equipment such as tanks, CIP systems, marination tumblers, and cooking vessels. That practical manufacturing perspective helps teams validate what can be standardized, what must be customized, and where equipment lead times may affect startup. For companies exploring custom systems, reviewing available equipment capabilities can help align budget assumptions with actual fabrication and integration considerations. A feasibility study should translate engineering assumptions into an investment case. In the United States, lenders, boards, private equity sponsors, and operating executives usually expect at least a five-year model with downside scenarios. That model should cover revenue by SKU or customer, raw material costs, labor, packaging, utilities, maintenance, sanitation, freight, QA, overhead, depreciation, working capital, and debt assumptions where relevant. The most important metrics typically include payback period, EBITDA impact, free cash flow, net present value, and internal rate of return. A project with positive EBITDA can still fail capital review if startup losses, working capital strain, or inflated retrofit costs erode value. Below is an illustrative five-year operating model for a mid-sized U.S. processing expansion. This table shows why five-year modeling matters. Year one may be cash-negative due to startup costs and working capital needs, yet the project can still create strong value over time if ramp-up assumptions are credible. Supply chain feasibility is often underestimated. A project can be technically excellent and still fail because ingredient quality fluctuates, inbound freight is unstable, or packaging lead times are too long. In the United States, sourcing analysis should consider dual-sourcing options, seasonal supply swings, regional crop or protein dynamics, cold chain requirements, intermodal access, and exposure to ports or border crossings. For example, beverage plants shipping nationwide may favor proximity to PET, cans, sweeteners, and flavor houses in the Southeast or Midwest, while seafood or protein processors may need direct links to Gulf Coast, Pacific Northwest, or Midwest cold chain corridors. Imported ingredients routed through Long Beach, Savannah, Houston, or Newark require different buffer stock strategies than domestic agricultural inputs sourced from California, Idaho, Nebraska, or Georgia. The area chart reflects an important 2026 trend: more processors are regionalizing sourcing and reducing single-point dependency, especially for packaging, ingredients, and utility-critical consumables. Supplier and product comparison can be visualized as follows. This comparison chart highlights how sourcing regions can differ across cost, resilience, lead time, and logistics fit. The lowest nominal price is not always the best feasibility choice. Food safety compliance is a core feasibility dimension, not a final checklist. U.S. project teams must decide early whether the operation falls under FDA, USDA, or both, what preventive controls apply, how zoning and hygienic design will be managed, what environmental monitoring is needed, and whether customers require SQF, BRCGS, or other third-party certification. HACCP remains essential in many processing environments, but under the Food Safety Modernization Act, preventive controls, supply-chain programs, sanitation controls, allergen management, traceability, and documentation systems often drive facility design. A dairy beverage plant, RTE protein line, or aseptic filling room will each require different hygienic design assumptions and validation plans. Service capabilities are especially important here. DPS works across capital planning, feasibility, owner’s representation, project and program management, general contracting support, proprietary equipment supply, installation, integration, and commissioning, with experience in FDA, USDA, SQF, and BRC-oriented projects across the United States and Canada. In a feasibility setting, that means compliance requirements can be connected to practical line layout, utility routing, sanitation access, and startup planning rather than treated as theoretical add-ons. The key lesson from the table is that food safety is a design input. If it is considered too late, projects often require expensive rework in walls, drainage, airflow, personnel flow, or automation records. The most common failure in food processing feasibility is starting with a desired answer and asking the study to justify it. Good feasibility should challenge assumptions, not protect them. Frequent mistakes in the United States market include: Another avoidable error is selecting partners only by lowest upfront fee. A cheap study can become very expensive if it omits constructability, controls logic, utility routing, or commissioning realities. That is why many manufacturers value teams that think like operators and capital stewards, not just contractors. Readers who want practical examples of execution-linked planning can review selected project case studies and outcomes to see how feasibility decisions influence delivery. Looking toward 2026, three trends are reshaping feasibility studies in the United States: These trends mean feasibility studies are becoming more integrated and more strategic. They are no longer only about whether a line fits in a building. They are about whether capital can create resilient, profitable, compliant manufacturing capacity under future operating conditions. Most studies take four to twelve weeks depending on project size, data availability, number of product categories, and whether site visits, utility reviews, or pilot validation are required. Greenfield and aseptic projects often need more time. The best team usually includes operations, finance, quality, procurement, engineering, maintenance, sales, and executive leadership. For regulated categories, food safety and compliance leadership should be involved from the start. Feasibility determines whether and how a project should proceed at a strategic level. Detailed engineering turns that direction into final drawings, specifications, controls architecture, procurement packages, and construction-ready scope. Brownfield is often the better option when the site has enough utility capacity, a usable building envelope, solid logistics access, and limited sanitation or structural constraints. It is especially attractive when speed to market matters. They are typically directional rather than final. Accuracy depends on scope maturity, equipment specificity, site conditions, and vendor engagement. Early studies should clearly identify assumptions, exclusions, and contingency levels. There is no universal rule, but many U.S. manufacturers screen projects using target payback periods, internal hurdle rates for IRR, positive NPV at the company discount rate, and acceptable downside performance under stress scenarios. Yes. Co-packing studies need stronger attention to customer mix, scheduling complexity, line flexibility, sanitation transitions, packaging variety, margin by account, and the risk of underloaded shared infrastructure in early years. Because many apparent capacity issues are really sequencing, batching, or controls problems. Better PLC logic, integrated recipes, and SCADA visibility can unlock throughput at much lower cost than a major expansion. Look for partners with real food and beverage process experience, compliance fluency, utility and controls depth, installation awareness, and the willingness to challenge bad assumptions. The strongest partner is often the one most focused on long-term profitability, not simply selling more equipment. A well-executed feasibility study helps manufacturers avoid unprofitable builds, underscoped retrofits, and compliance-driven redesign. In the United States, the highest-value studies connect market demand to process design, equipment integration, supply chain resilience, and disciplined financial modeling. When those pieces align, capital moves with confidence and the project stands a far better chance of becoming a profitable operating asset rather than an expensive lesson.


