-
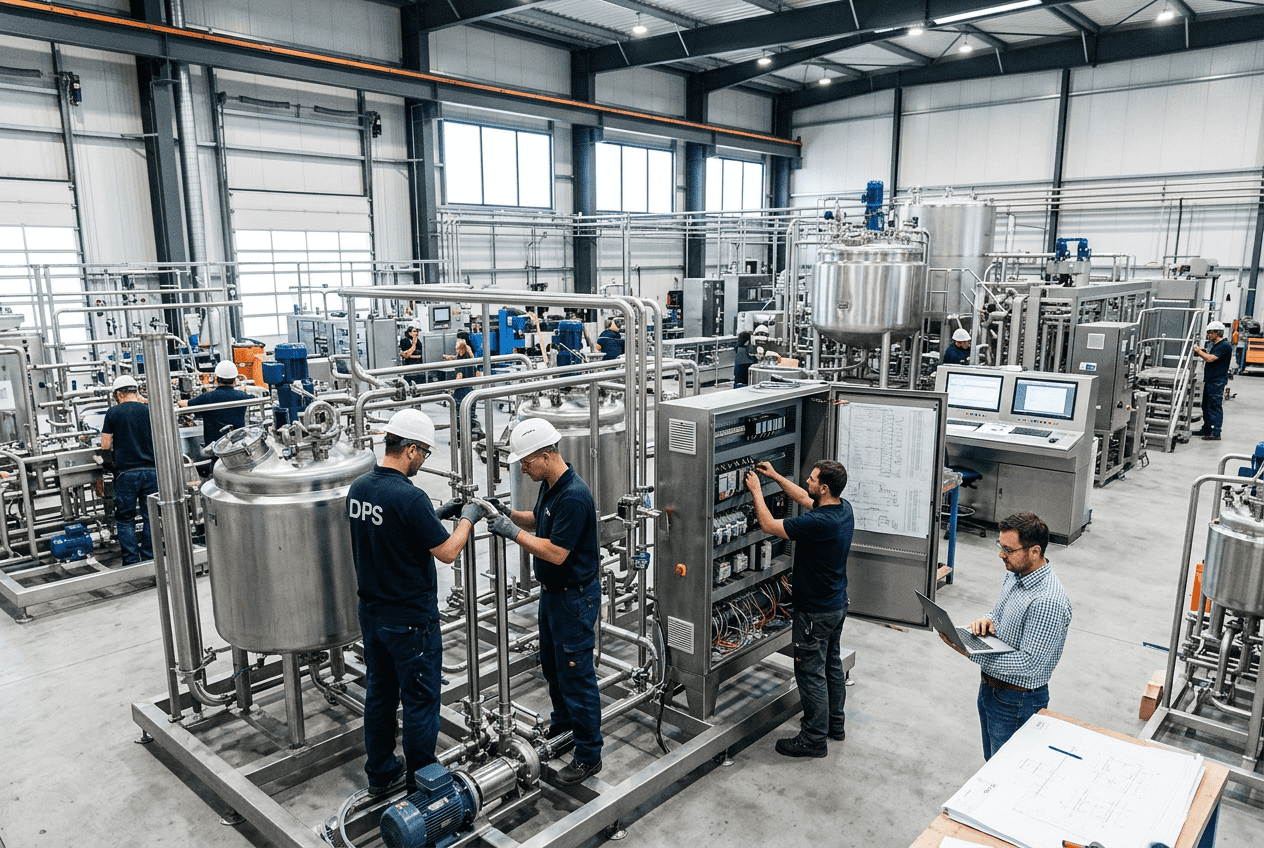
7 Stages of Food Facility Effluent Treatment Explained
Food and beverage manufacturers in the United States face increasing pressure to control wastewater strength, reduce sewer surcharges, meet permit limits, and improve sustainability. Effluent from meat, dairy, beverage, prepared food, and ingredient plants often contains fats, oils, grease, suspended solids, sugars, proteins, salts, and cleaning chemicals that cannot be discharged untreated. A reliable treatment train typically moves from coarse removal and flow balancing to dissolved air flotation, biological treatment, polishing, disinfection, and final solids handling. The exact sequence depends on plant location, municipal pretreatment rules, product mix, daily flow swings, and whether the facility discharges to a publicly owned treatment works or directly under a National Pollutant Discharge Elimination System permit. Across U.S. manufacturing hubs such as Chicago, Dallas-Fort Worth, Fresno, Charlotte, Atlanta, Los Angeles, Houston, Milwaukee, and the I-95 corridor, food processors are revisiting wastewater systems because utility costs, discharge fees, and enforcement expectations continue to rise. Facilities near ports and trade centers including Long Beach, Savannah, Newark, and Houston also face expansion pressure as production volumes increase. In this environment, a treatment system should not be viewed as a standalone utility. It is part of overall plant profitability, capacity planning, sanitation design, automation, and risk management. For owners planning expansion, retrofit, or greenfield construction, it helps to work with an engineering partner that understands both process manufacturing and utility integration. Disruptive Process Solutions supports food and beverage capital projects across the United States and Canada with a business-focused approach that links treatment decisions to throughput, compliance, and long-term operating performance. The seven core stages of food plant effluent treatment in the United States are: preliminary screening, grit and grease separation, equalization and pH control, primary solids and FOG removal, biological treatment, tertiary polishing and disinfection, and sludge handling with compliant disposal. In many food factories, dissolved air flotation is the preferred primary clarification step, while membrane bioreactors are selected when tighter effluent quality, water reuse goals, or small footprints matter more than lowest capital cost. For most processors, the best system is not the most complex one. It is the system sized for actual hydraulic loads, peak CIP events, product loss risk, future line additions, and local permit requirements. A poultry plant in Arkansas, a dairy processor in Wisconsin, and a beverage co-packer in North Carolina can all require different designs even when average flow appears similar. Treatment planning should therefore begin with sampling, load characterization, utility mapping, and a practical review of operational staffing. The table above shows why treatment design must connect each pollutant type to a clear unit operation. Overdesign increases capital and operating expense, while underdesign leads to permit issues, odor complaints, and production constraints. The growth trend above reflects a realistic increase in wastewater upgrade spending as older plants modernize utilities, expand production, and prepare for stricter sustainability expectations through 2026. A complete food facility wastewater treatment train usually follows seven practical stages. Some plants combine steps into packaged systems, while larger sites distribute them across several structures. The best arrangement depends on influent variability, land availability, sludge outlets, odor sensitivity, automation requirements, and reuse goals. In the United States market, these stages are influenced by local industrial pretreatment programs, state environmental agencies, water scarcity concerns in regions such as California and Arizona, and utility cost escalation in major manufacturing regions like the Midwest and Southeast. Food categories also change design priorities. Meat and poultry waste tends to be strong in FOG and solids. Beverage facilities often have high sugar loads and lower solids. Dairies can present heavy fat, protein, and cleaning chemistry loads. Prepared foods may create both high solids and high salt conditions. This comparison shows why no single flow sheet fits every plant. Product type directly affects equipment selection, chemical demand, aeration strategy, and sludge volume. Primary treatment is where food processors win or lose downstream stability. If large solids, fibrous material, packaging fragments, sand, bone particles, starch clumps, or grease are allowed to pass unchecked, they create pump failures, clog diffusers, overload biological systems, and drive up sludge costs. Most U.S. food plants begin with a coarse screen followed by a finer screen or rotary drum screen. The opening size depends on product type and the need to protect downstream pumps and DAF units. Meat, vegetable, and prepared-food plants often benefit from fine mechanical screening because recoverable solids can be diverted from the wastewater stream early. In some plants, especially older facilities in industrial corridors around Cincinnati, Kansas City, or central California, retrofitting modern screening can reduce treatment loads without major civil work. After screening, the next tasks are flow separation and conditioning. Equalization tanks dampen slug loads from sanitation shifts, dump events, and product changeovers. Agitation prevents septic conditions and solids settling. pH adjustment is frequently necessary because CIP acids and caustics can drive strong swings that damage biological performance. Grease management is another major concern. Gravity separators can remove some free oil and floatables, but many food plants move quickly to DAF because emulsified fats and light suspended solids are otherwise difficult to capture. Chemical addition using coagulants and polymers often improves separation, though dosage should be optimized through jar testing and live operating data rather than assumption. The table makes clear that primary treatment is not one tank or one machine. It is a sequence of defenses against hydraulic and contaminant variability. Plants planning line expansions should design this section for future peak flow, not just average daily flow. Secondary treatment removes the dissolved and fine particulate organic matter that primary systems cannot capture. In food and beverage applications, this usually means reducing biochemical oxygen demand, chemical oxygen demand, and residual suspended solids through microbial activity. The two broad options are aerobic treatment and anaerobic treatment, with some facilities using both in series. Aerobic systems such as activated sludge, sequencing batch reactors, moving bed biofilm reactors, and membrane bioreactors are common when discharge quality must be high and when operators are comfortable managing air systems, sludge age, and nutrient balance. These systems work well for many dairies, beverage plants, and prepared-food processors. Anaerobic treatment can be attractive for very high-strength wastewater because it reduces aeration energy and can produce biogas, but it typically requires careful control, consistent loading, and downstream polishing. Biological selection should consider more than pollutant removal. Temperature range, salt content, cleaning chemistry carryover, shock load frequency, space constraints, odor tolerance, and staffing capability all affect success. For example, a high-growth beverage co-packing plant in the Southeast may value fast-install packaged aerobic treatment with strong automation, while a large protein plant in the Midwest may justify a more complex multi-stage system because of very high organic loading. Operationally, food facilities should monitor dissolved oxygen, oxidation-reduction potential where relevant, nutrient ratio, mixed liquor suspended solids, sludge age, influent equalization quality, and foam conditions. Many biological failures are not due to the reactor itself but to inadequate upstream control or poor operator visibility. The bar chart highlights realistic demand patterns in the U.S. market. Meat, poultry, and dairy plants often push the hardest on secondary treatment upgrades because their wastewater strength, solids carryover, and surcharge exposure are usually high. Each process has a place. The right choice comes from balancing effluent goals, footprint, operator capability, energy profile, and long-term expansion plans rather than following industry trends blindly. Tertiary treatment is the polishing stage that prepares water for compliant final discharge or, in some facilities, internal reuse. After biological treatment, remaining issues may include fine suspended solids, turbidity, nutrients, color, trace organics, or microbial risk. Filtration and disinfection are therefore common finishing steps in modern food plant wastewater systems. Filtration options include sand filters, cloth media filters, cartridge systems, and membranes depending on the required final quality. For facilities in drought-sensitive states like California, Nevada, Arizona, or parts of Texas, reuse planning may justify advanced polishing because every gallon recovered can reduce freshwater demand. Non-product-contact reuse applications can include cooling tower makeup after proper treatment, washdown for defined uses, or landscape irrigation where permitted. Disinfection methods commonly include ultraviolet systems, sodium hypochlorite, and less often ozone for specialized applications. UV avoids chemical residuals and works well with low-turbidity water, while chlorination offers residual protection but demands careful dosing and dechlorination where required. The best choice depends on permit language, reuse objectives, and operator preference. Tertiary treatment also provides a margin of protection against plant upsets. If primary and secondary systems occasionally experience peak loading, final polishing can help prevent permit excursions for TSS, fecal indicators, or turbidity-related parameters. The table above shows that tertiary treatment should match the final water objective. If the goal is only sewer discharge compliance, a simpler arrangement may suffice. If the goal is onsite reuse or a stringent outfall permit, filtration and disinfection become central design elements. This area chart reflects the shift toward water reuse, tighter final polishing, and sustainability-driven investments expected through 2026. Two of the most discussed technologies in food plant effluent treatment are dissolved air flotation and membrane bioreactors. They serve different purposes, but they are often evaluated together because both are used when conventional treatment struggles with footprint limits, variable loads, or higher quality expectations. DAF is usually a primary treatment technology. It excels at removing fats, oils, grease, and fine suspended solids after chemical conditioning. For dairies, meat processors, sauce plants, seafood operations, and many prepared-food lines, DAF can dramatically reduce the loading sent to biological treatment. That translates into lower aeration demand, better stability, and smaller downstream equipment. DAF is especially useful where municipal surcharge formulas penalize high TSS and FOG. MBR is a biological and solids-separation technology combined. Instead of relying on secondary clarifiers, it uses membranes to retain biomass and produce very low-TSS effluent. MBR systems fit facilities that need excellent effluent quality, have limited real estate, or want future water reuse capability. They are increasingly relevant for urban and high-cost sites near Los Angeles, New Jersey, Chicago suburbs, and other dense industrial areas where land is expensive and discharge expectations are tight. Choosing between them is not truly an either-or decision in many plants. A DAF may sit upstream of an MBR, with the DAF protecting the membrane biology from fats and solids. The real design question is how much pretreatment is needed before biology, and how clean the final water must be. The table clarifies that DAF and MBR are complementary more often than competing. Buyers should examine influent composition, permit limits, staffing, and future reuse before making a decision. This comparison chart gives a practical visual summary. DAF dominates where grease and suspended solids are the early bottlenecks. MBR stands out where final water quality and reuse potential drive the investment case. When evaluating suppliers, processors should ask for pilot data where possible, realistic chemical and membrane replacement assumptions, automation philosophy, spare parts access in the United States, and clear startup support. Firms that understand both process operations and utility integration can often prevent expensive mismatches between treatment equipment and plant production realities. For broader project planning and integration support, manufacturers can review engineering and project services that connect wastewater decisions to total facility performance. Sludge is the hidden cost center of food wastewater treatment. Every pound of solids or FOG removed upstream eventually becomes residual material that must be thickened, dewatered, hauled, beneficially reused, or otherwise managed in compliance with local rules. Plants that focus only on water quality while ignoring residuals often face unpleasant surprises in hauling fees, odor complaints, and storage limitations. Common sludge streams in food plants include screen solids, DAF float, primary sludge, waste activated sludge, and spent filter backwash solids. DAF float can be particularly challenging because it may contain high fat content, polymers, and entrained water. Dewatering technologies such as screw presses, belt presses, centrifuges, and geobag-style solutions each have tradeoffs in dryness, labor, footprint, and maintenance. Disposal routes vary by region. Some processors use land application where permitted, some send dewatered cake to landfill, and others pursue rendering or energy-related recovery opportunities depending on sludge composition. In dense urban areas, hauling logistics and odor control can strongly affect the best option. In rural parts of the Midwest or Southeast, land availability may allow different economics. No matter the route, storage time should be minimized to control odor and vector issues. Plants should also remember that better primary separation can sometimes reduce total sludge handling cost by making biosystems more stable, even if DAF float volume increases. The goal is whole-system optimization, not just minimizing one waste stream on paper. The right sludge plan should be decided early, not after the treatment train is fixed. Dewatering performance, local disposal contracts, and storage design affect total project economics as much as reactor selection. In the United States, compliance starts with understanding whether the facility discharges to a municipal sewer system or directly to surface waters. If wastewater goes to a publicly owned treatment works, the plant is usually subject to local industrial pretreatment requirements and surcharge formulas in addition to any state or federal expectations. If it discharges directly, the permit framework is typically more demanding and may include flow, pH, TSS, BOD, oil and grease, nutrients, fecal indicators, residual chlorine, and other site-specific parameters. EPA standards and state implementation programs shape the overall framework, but the practical day-to-day compliance obligations come from the permit itself, local ordinances, sampling protocols, recordkeeping, and response procedures. Food plants should keep a strong focus on the following: Facilities near major receiving waters, coastal zones, or rapidly growing metropolitan areas often face heightened scrutiny. A processor expanding near Tampa, Sacramento, or the Delaware River industrial belt should confirm whether local sewer authorities or state regulators have upcoming tighter expectations. Looking ahead to 2026, three trends are clear: stronger emphasis on water reuse and conservation, greater digital monitoring and reporting, and more pressure to quantify sustainability performance as part of capital decisions. Future-ready compliance strategies may include online analyzers, SCADA integration, predictive maintenance, nutrient optimization, reduced chemical usage, and system flexibility for future line additions. Food and beverage companies already modernizing utilities often pair wastewater upgrades with broader capital planning, controls improvements, and sanitation redesign. This integrated approach is particularly valuable when treatment interacts with CIP, process water, boilers, refrigeration, and production scheduling. Manufacturers seeking complete project alignment can also review project case examples to see how integrated engineering, construction oversight, and execution planning support compliance and profitability together. Disruptive Process Solutions supports food and beverage manufacturers across all 50 U.S. states with an approach built around profitable, well-managed capital execution rather than isolated equipment sales. For wastewater and effluent treatment projects, that matters because treatment systems only perform when they are correctly tied into the plant’s process loads, utilities, controls, sanitation programs, and growth plan. Technological capabilities: DPS brings multi-discipline engineering across structural, mechanical, plumbing, electrical, process, and controls scopes. That means a wastewater project can be evaluated alongside automation, PLC logic, SCADA visibility, utility balance, CIP interactions, and process line expansion. This is especially important in food and beverage plants where influent variability is often created by production scheduling rather than by the treatment equipment itself. Manufacturing capabilities: DPS also designs and supplies branded process equipment, including tanks and CIP-related systems, which supports practical integration between treatment-adjacent infrastructure and production operations. That manufacturing mindset is useful when a project requires custom vessels, utility tie-ins, staged installation, or compact skid concepts suited to existing facilities with limited space. Service capabilities: DPS provides end-to-end support ranging from feasibility and capital planning to owner’s representation, project management, general contracting functions, installation, and system integration. For wastewater-related projects, that can help processors avoid the common gap between design intent and field execution. Rather than treating effluent treatment as a separate utility island, the company aligns it with the larger business case of capacity, compliance, startup speed, and long-term operating success. More information is available on the equipment solutions page and the company overview. This integrated model is particularly relevant for U.S. food and beverage projects in fast-moving markets where expansion timelines are short, contractor coordination is difficult, and utility infrastructure must scale with production from day one. Whether the project involves a beverage site in North Carolina, a protein facility in Texas, or a dairy expansion in the Upper Midwest, the underlying value is the same: better planning, faster decision-making, and clearer accountability. Complete a representative wastewater characterization study. Measure flow, pH, TSS, BOD or COD, FOG, nutrients where relevant, temperature, and cleaning-chemical impact across multiple production conditions. Without this, equipment selection is guesswork. No. DAF is highly effective when wastewater contains significant fats, oils, grease, and fine suspended solids. Low-solids beverage plants may prioritize equalization and biological treatment instead. However, many dairies, meat plants, and prepared-food facilities benefit substantially from DAF pretreatment. MBR is a strong option when footprint is limited, final effluent quality must be very high, or the facility wants a pathway toward water reuse. It usually involves higher capital cost and more disciplined operation than simpler aerobic systems. Start by cutting product loss to drain, optimizing screening, balancing flow, and improving FOG and TSS removal upstream. In many facilities, basic source control and stronger primary treatment reduce monthly costs before major downstream upgrades are completed. Common mistakes include designing around average flow instead of peak events, ignoring pH swings from CIP, underestimating sludge volume, failing to maintain instrumentation, and expanding production without rechecking permit and treatment capacity. Yes, especially in water-stressed regions and large campuses with significant utility demand. Reuse usually starts with non-product-contact applications and requires treatment polishing, clear quality targets, and site-specific regulatory review. Compare them on actual food industry experience, pilot or reference data, U.S. service coverage, controls integration, operator training, spare parts support, startup methodology, and whole-life cost rather than only purchase price. Expect stronger focus on automation, remote monitoring, reuse-oriented polishing, lower-energy treatment strategies, carbon and water reporting, and more integrated capital planning that links wastewater to overall plant profitability and resilience. -
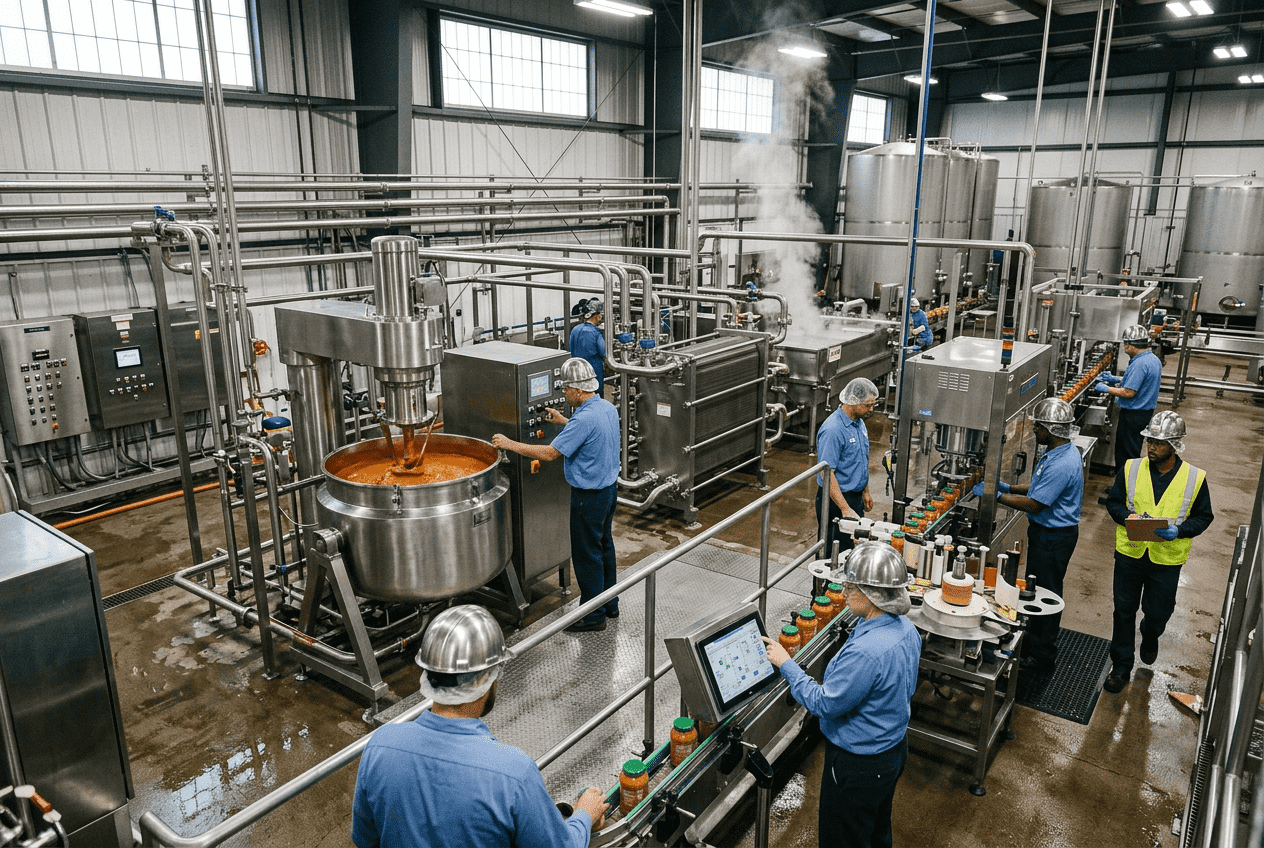
Food Plant Air Emission Control: Technologies and Compliance
Food manufacturers in the United States face growing pressure to control air emissions from cooking, drying, fermentation, wastewater handling, boilers, roasting, frying, smoking, ingredient handling, and packaging operations. The right solution is rarely a single device. Most successful projects combine source capture, process optimization, treatment technology, monitoring, and a permitting strategy that aligns with EPA rules and state air quality requirements. For facilities in major manufacturing corridors such as California’s Central Valley, the Chicago region, the Carolinas, Texas, Georgia, the Midwest protein belt, and port-linked processing hubs near Los Angeles, Houston, Savannah, Newark, and Seattle, air compliance can directly affect production uptime, expansion plans, and community relations. This guide explains where emissions come from in food plants, how VOC, odor, particulate matter, and NOx are typically managed, and how to evaluate scrubbers, biofilters, oxidizers, and filtration systems for U.S. operations. It also covers buying advice, industry applications, future 2026 trends, and how an engineering partner can integrate emission controls into broader plant utility and process upgrades. The fastest answer is this: food plant air emission control in the United States usually starts with identifying the emission type, the process source, and the permit trigger. Odors and volatile organic compounds often come from frying, roasting, smokehouses, seasoning, solvents, fermentation, and wastewater systems. Particulate matter is common in milling, mixing, conveying, drying, and bulk ingredient handling. NOx is tied mainly to combustion equipment such as boilers, thermal oil heaters, ovens, and direct-fired process systems. In practice, the most common control paths are: For buyers, the best option is not always the most aggressive technology. It is the system that matches airflow, contaminant profile, moisture, temperature, turndown, maintenance staffing, energy cost, and local permitting expectations. A poultry plant in Arkansas, a brewery in North Carolina, a dairy processor in Wisconsin, and a sauce manufacturer in California may all need very different solutions even if each reports “odor” as the primary problem. The table above shows why a plant-first diagnosis matters. The same “air issue” can mean very different engineering choices depending on pollutant chemistry, process temperature, and local permit drivers. Food processing operations generate air emissions from both production and supporting utilities. The market is broad: proteins, dairy, beverage, sauces, ready-to-drink products, breweries, distilleries, dry ingredient plants, snack foods, bakeries, aseptic operations, and prepared foods all have distinct emission profiles. Major source categories include: Different U.S. regions also influence priorities. California facilities often face more stringent district rules around VOC and combustion emissions. Midwestern grain and ingredient plants focus heavily on dust capture and explosion-safe design. Gulf Coast and Southeast facilities may prioritize odor management due to nearby residential growth and humid conditions affecting biofiltration performance. For plant owners, the best purchasing strategy is to map emissions by product type, seasonality, and production rate. A tomato processor near Fresno, a poultry complex in Georgia, and a distillery in Kentucky may all run high-volume operations, yet their peak air loads occur at different times and from different process steps. The line chart reflects a realistic market direction: U.S. investment in emission controls is rising as processors expand capacity, automate utilities, and modernize aging environmental systems. VOC and odor control technologies are often discussed together in food processing, but they are not identical decisions. A system that eliminates a permit-significant VOC stream may not be the most economical answer for low-level nuisance odor, and vice versa. The main product and technology options include: Buying advice: ask five questions before choosing a technology. First, what is the exact compound profile? Second, what are the airflow and temperature ranges? Third, does the plant run 24/7 or in batches? Fourth, what utility costs apply in your state? Fifth, what maintenance capability is available on site? In Massachusetts or New Jersey, for example, energy price sensitivity may steer selection differently than in Texas or Louisiana. The table shows that the “best” control is contextual. RTOs are strong compliance tools, but biofilters may be the better long-term answer for a wastewater odor problem if space and media management are available. Application examples by industry: Particulate matter control systems are essential in dry food manufacturing and in any process where solids are conveyed, milled, mixed, screened, dried, or packaged. PM control is not only about compliance. It also affects product loss, sanitation, visibility, employee safety, combustible dust risk, and equipment reliability. Common technologies include cyclones, baghouses, cartridge dust collectors, wet collectors, and enclosure-based source capture systems. Selection depends on particle size, stickiness, moisture, explosibility, airflow, and whether the dust has food reuse value. For example, a flour mill in Kansas City, a dairy powder line in Idaho, and a spice blending facility near Newark each create dust, but not the same kind. Flour is combustible and fine. Dairy powder can be hygroscopic. Spice dust may be oily, aromatic, or corrosive to some materials. When buying PM systems, manufacturers should review not only filter efficiency but also fan energy, housekeeping burden, clean-in-place compatibility, sanitary design, and dust hazard analysis. A lower-priced collector may cost more if it drives higher cleaning labor or frequent filter changeouts. The bar chart shows where demand is especially active: protein, dairy powder, bakery, and ingredient plants often require the greatest intensity of dust and odor management due to a mix of production volume, heat treatment, and powder handling. NOx reduction from combustion equipment is a major issue for food plants with boilers, thermal fluid heaters, direct-fired ovens, fryers, and process air systems. Even when the food process itself is clean, the utility backbone can create permit challenges, especially during capacity expansion. The main NOx reduction methods are: The correct choice depends on equipment size, load profile, fuel type, existing burner design, and local limits. Facilities in the South Coast Air Basin of California may face different practical decisions than those in North Carolina, Indiana, or Oklahoma. From a buying perspective, do not treat NOx reduction as a burner-only issue. Stack configuration, controls integration, steam demand swings, and maintenance discipline affect real-world performance. If a plant is adding new retorts, expanding hot-fill beverage lines, or increasing CIP hot water loads, the boiler system should be evaluated early. The table highlights a common market reality: many food plants start with burner optimization and staged retrofits, then move to higher-control solutions only when production growth or local regulation requires it. Scrubber and biofilter selection is one of the most frequent decision points in food plant odor control. Both technologies are proven, but they serve different operating conditions. Scrubbers are generally preferred when the air stream contains soluble gases, corrosive compounds, or abrupt concentration swings. They are compact compared with many biofilters and can perform well when carefully controlled for pH, recirculation, and chemical dosage. Biofilters are often preferred for large-volume, lower-concentration odor streams with strong organic character, especially wastewater and byproduct odors. They can offer lower long-term energy use and strong sustainability messaging, but they need space, moisture balance, and disciplined media management. Selection factors include: The explanation is straightforward: scrubbers usually win on responsiveness and compactness, while biofilters often win on sustainability and operating cost where the stream is biologically suitable and land is available. The area chart reflects a strong 2026 trend: more U.S. food plants are moving toward hybrid systems that combine capture improvements, scrubbing, biological treatment, and targeted polishing rather than relying on one large end-of-pipe device. Monitoring and reporting requirements depend on permit conditions, emission source type, and facility classification. Some plants need only routine records, maintenance logs, and periodic source testing. Others require continuous parameter monitoring, fuel use tracking, visible emission checks, malfunction reporting, and annual emissions inventory submissions. Key reporting elements often include: For buyers, this matters because monitoring can significantly affect total project cost. A lower-cost control device may become expensive if it creates heavy compliance labor or recurring testing burdens. Plants with lean maintenance teams should ask early whether data logging, alarms, remote visibility, and historian integration can be built into the design. Facilities that already operate automated utilities and process control platforms have an advantage. Integrating air control data into a plantwide SCADA environment can improve response time, reduce recordkeeping errors, and support internal environmental audits. EPA and state air quality compliance in the United States is layered. Federal rules may apply through New Source Review, NSPS requirements, NESHAP provisions, Title V obligations, greenhouse gas reporting, and sector-specific standards. States and local districts can impose additional limits, permit conditions, and testing expectations. Common compliance triggers include new lines, boiler replacements, production increases, fuel switching, new wastewater infrastructure, and changes that increase capture efficiency but alter stack characteristics. A plant in Houston, Sacramento, Minneapolis, or Charlotte may face different procedural paths even when installing similar processing equipment. Best practice is to treat environmental review as part of capital planning, not as a late permit box to check. This is especially important for brownfield expansions, co-packing facilities, and multi-phase food campuses near freight corridors, intermodal centers, and ports. 2026 policy and sustainability trends to watch include: For food companies planning expansion, future-ready compliance means selecting systems that can scale. It is often cheaper to design ductwork, pads, utility tie-ins, and controls architecture for future phases than to retrofit after a permit cap is reached. This comparison chart illustrates a practical decision framework. High control efficiency does not automatically mean best lifecycle fit; each product category should be judged against plant layout, utility cost, staffing, and state compliance exposure. Disruptive Process Solutions supports food and beverage manufacturers across the United States and Canada with integrated engineering, capital project execution, and system implementation. Rather than viewing air emission control as an isolated purchase, the company approaches it as part of the full production ecosystem: process equipment, utilities, controls, compliance, installation, and long-term plant profitability. On the technological capabilities side, DPS works across structural, mechanical, plumbing, electrical, process, and controls disciplines. That matters for emission projects because the best outcome often requires more than an environmental skid. It may involve duct routing, boiler integration, ventilation balancing, PLC programming, SCADA visibility, utility load review, or modifications to cooking, fermentation, CIP, or wastewater interfaces. Manufacturers can explore broader capabilities through the company’s engineering and project services. On the manufacturing capabilities side, DPS also designs and supplies proprietary process equipment, including tanks, CIP systems, marination tumblers, and cooking vessels. For plants adding or modifying process lines, that upstream equipment knowledge helps connect the source of emissions to the most practical downstream control strategy. Information on integrated equipment solutions is available in the company’s process equipment portfolio. On the service capabilities side, DPS operates through a design-build-manage approach that supports feasibility, capital planning, owner’s representation, project management, general contracting coordination, installation, and startup support. This is valuable for food processors that need air control upgrades tied to larger expansions such as beverage utilities, protein cook lines, dairy systems, aseptic installations, or complete plant retrofits. Background on the company and its execution philosophy can be found on the company overview page. Case-driven delivery is especially important in emission control, where successful results depend on execution detail. A duct routing error, control mismatch, or late permit assumption can compromise an otherwise strong equipment selection. Manufacturers looking for examples of integrated project delivery can review selected project case studies. From a buyer perspective, DPS is best aligned with manufacturers that want a practical operating partner rather than a catalog-only vendor. That includes clients expanding co-packing facilities, upgrading utilities, relocating equipment, modernizing fermentation systems, improving protein or prepared food processing, or planning phased capacity growth while protecting compliance and first-year profitability. What is the first step in controlling air emissions at a food plant?Start with a source-by-source assessment. Identify emission type, operating schedule, airflow, contaminant chemistry, and current permit status before selecting equipment. Which industries need the most odor control?Protein processing, wastewater-heavy operations, fermentation facilities, smokehouses, rendering-related systems, and some sauce or flavor plants typically need the most active odor management. Are biofilters better than scrubbers?Not universally. Biofilters can be excellent for large, lower-strength organic odor streams. Scrubbers are often better for variable, soluble, or corrosive gases and for tighter footprints. When is an RTO worth the cost?Usually when VOC destruction efficiency is a major compliance requirement, the airflow and concentration justify thermal treatment, and long-term permit certainty is more important than minimum upfront cost. How do I choose a particulate control system?Review particle size, moisture, stickiness, reuse value, sanitary needs, airflow, and combustible dust characteristics. Baghouses, cartridge collectors, and cyclones each suit different product categories. Can boiler upgrades reduce permit risk?Yes. Combustion tuning, low-NOx burners, oxygen trim, and in some cases SCR can materially improve compliance position and support future production expansion. Do all food plants need continuous monitoring?No. Monitoring depends on permit conditions and source type. Some facilities need only recordkeeping and periodic testing, while others need continuous parameter tracking and formal reporting. What should be included in a buying specification?Airflow range, contaminant list, temperature and moisture limits, turndown, expected uptime, utility requirements, materials of construction, control integration, maintenance expectations, and performance guarantees. How important is local geography in the United States?Very important. Regulations, utility costs, ambient climate, community sensitivity, and site footprint vary widely from California to the Carolinas, from the Pacific Northwest to the Gulf Coast. What trends are shaping 2026 decisions?Hybrid control trains, lower-energy treatment, tighter digital reporting, more predictive maintenance, integrated carbon and air planning, and stronger scrutiny of community odor and cumulative environmental impact. In summary, air emission control for U.S. food plants is a market shaped by product type, process design, location, and regulation. The strongest projects align compliance, production throughput, energy use, and future expansion from the start. Whether the need involves VOC reduction, odor control, particulate collection, or boiler NOx improvements, manufacturers gain the best results when environmental systems are engineered as part of the full facility strategy rather than added late as stand-alone hardware. -
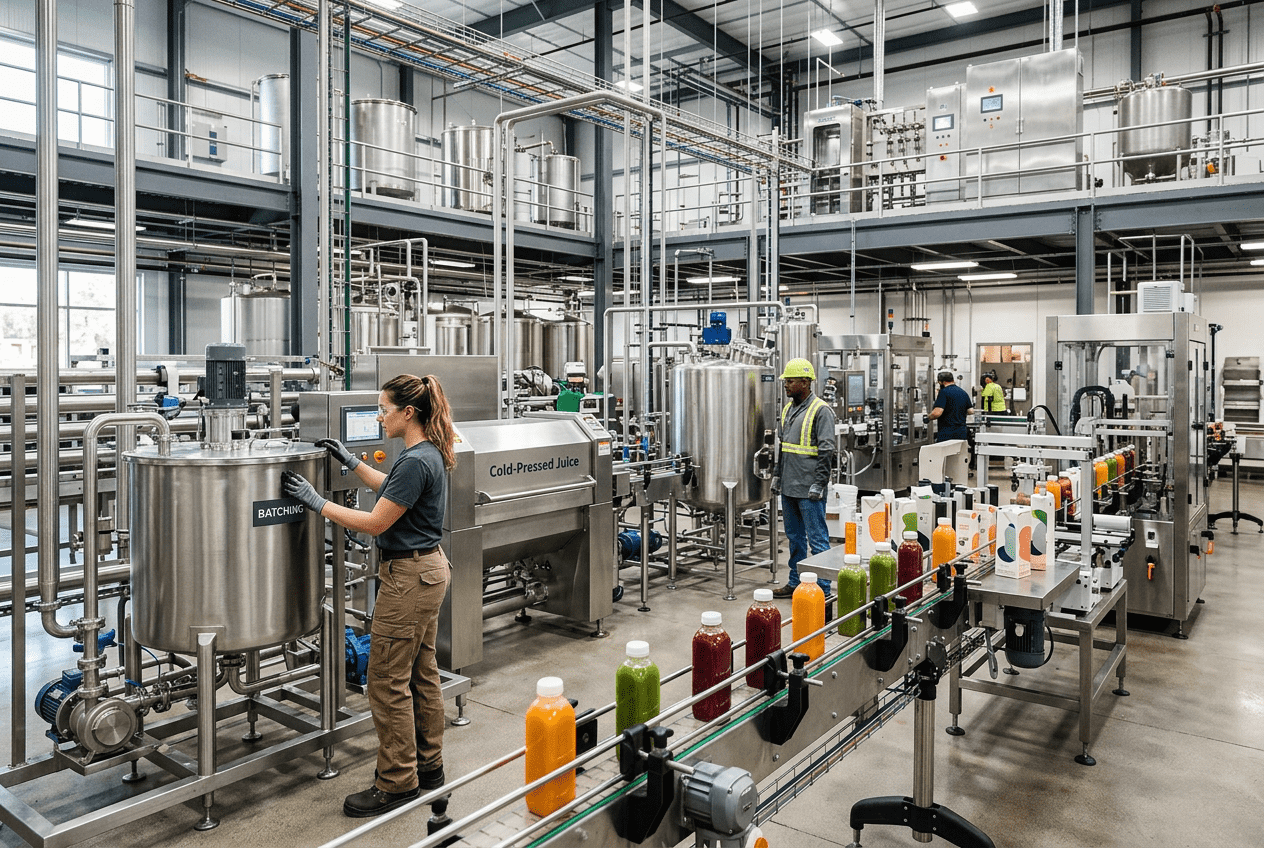
Beverage Batch Control System
For beverage manufacturers in the United States, a modern beverage batch control system is the digital and operational backbone that connects syrup preparation, recipe execution, tank scheduling, inline quality checks, clean-in-place validation, and end-to-end lot traceability. In practice, it helps plants produce the right drink, in the right sequence, at the right specification, with less giveaway and fewer changeover errors. Whether a facility is producing carbonated soft drinks near Atlanta, functional beverages in Southern California, kombucha in the Pacific Northwest, or spirits-based RTDs around Dallas and Houston, the value of recipe-driven batching comes from consistency, speed, and control. The U.S. market is particularly demanding because manufacturers must manage SKU proliferation, co-packing contracts, regional flavor variation, retailer compliance, and strict food safety expectations. Plants near large logistics corridors such as Chicago, the Port of Los Angeles, Long Beach, Savannah, Newark, and Houston often need to change products rapidly while still protecting quality and throughput. That is where integrated automation, engineered process design, and disciplined project execution matter most. For companies evaluating a new system, the buying decision should not focus only on software screens. The better question is whether the system can support the full production reality: raw material receiving, syrup rooms, blending skids, fermentation where applicable, tank farms, utilities, CIP, transfer routing, packaging demand, and operator workflows. The strongest projects combine controls, process engineering, utility integration, and plant-specific operating logic. That is also why many manufacturers look for a partner that can align engineering, installation, and execution rather than handing off responsibilities across multiple disconnected vendors. About the team behind DPS gives a useful overview of this integrated approach, while their broader service capabilities show how engineering, controls, and execution can be tied together from concept through startup. A beverage batch control system is an automation platform that manages formulas, ingredient dosing, tank usage, process sequencing, quality checks, cleaning validation, and production records across beverage operations. In the United States, it is commonly used in soft drink plants, breweries, distilleries, juice facilities, dairy beverage operations, and co-packing sites to reduce manual error, improve consistency, shorten changeovers, and support traceability. In direct terms, the system should answer five core plant questions at all times: That direct answer is especially important for U.S. operators facing retailer scorecards, co-manufacturing service level agreements, FSMA-oriented documentation expectations, and rising labor costs. A well-designed control system is not just a convenience layer. It becomes a profit-protection tool. The table above summarizes why batch automation has become a competitive requirement rather than a luxury. In markets with tight margins and demanding customers, each function contributes directly to throughput, compliance, and profit. The growth trend reflects how beverage producers are moving toward deeper digital control as labor pressure, SKU complexity, and quality expectations increase. The strongest demand is coming from co-packers, multi-line beverage campuses, and manufacturers upgrading legacy PLC logic into coordinated batch platforms. In a U.S. beverage plant, batch control usually starts in the syrup room and extends all the way to finished product storage or packaging feed tanks. This matters because the system boundary determines the business value. A narrow batching package that only controls one mix tank may look inexpensive, but it often leaves critical losses untouched: manual handoffs, tank conflicts, undocumented adjustments, and inconsistent startup procedures. At the front end, syrup room control covers water preparation, sweetener handling, dry ingredient addition, dissolve steps, heating or cooling, filtration, and intermediate syrup storage. In carbonated soft drink and juice plants, this is where repeatability is won or lost. In functional beverage and nutraceutical lines, the need is even greater because micro-ingredients, heat-sensitive compounds, and viscosity shifts can create quality variation quickly. From there, the system should coordinate transfers to blend tanks, bright tanks, hold tanks, or finished product tanks depending on product type. In fermented beverage operations, batch control may also bridge cellar operations, blending, proofing, dilution, and packaging staging. For dairy-based and aseptic beverages, the sequence may include homogenization, HTST or UHT integration, surge tank logic, and downstream filling readiness. Well-engineered execution is not only about the software. It depends on instrumentation quality, valve matrix design, utility stability, and equipment compatibility. That is why many manufacturers in the United States prefer partners who understand the entire process architecture. DPS, for example, supports beverage operations with process, controls, mechanical, plumbing, electrical, and structural coordination rather than treating automation as a separate island. Their experience spans blending, carbonation, fermentation systems, filtration, pasteurization, aseptic processing, and utility infrastructure needed to make the batch system reliable in daily operation. For plants planning expansion, this system-wide perspective becomes more important near major U.S. manufacturing and logistics zones. A facility outside Charlotte, Phoenix, Indianapolis, or Sacramento may have enough demand to justify additional tanks and utilities, but unless routing, sequencing, and CIP are integrated into the batch logic, the capacity gain often underperforms expectations. This table shows why end-to-end scope matters. A batch control project limited to just one process node often cannot deliver the expected ROI because losses happen at the interfaces between process areas. Recipe-driven blending allows a plant to execute approved formulas automatically, with each ingredient addition verified against target amounts, tolerances, sequencing rules, and production conditions. In beverage manufacturing, this is particularly valuable for flavor, color, acid, sweetener, and concentrate dosing because small deviations can create visible or tasteable defects. In the U.S. market, recipe automation is not only for large carbonated soft drink operations. It is equally relevant in premium juice lines, energy drinks, botanical beverages, kombucha blends, spirits-based canned cocktails, dairy beverages, and private-label wellness products. As SKU counts rise, the burden on operators becomes too high for dependable manual management alone. Advanced systems typically include: For buyers, one practical question is whether the system handles both macro and micro ingredients well. Bulk sugar or treated water are easy compared with flavors, extracts, vitamins, colors, and actives that may require higher precision and special sequence rules. Another is whether it can support campaign production for high-volume SKUs while still allowing short runs for regional products and retail test launches. This is also where equipment design and manufacturing capabilities matter. Companies that can supply tanks, custom CIP systems, and related process equipment in addition to integration often reduce fit-up risk. DPS manufactures select process equipment, including tanks and CIP systems, which can simplify alignment between mechanical design, automation requirements, and site execution when timing is tight. The key takeaway from this dosing table is that not all ingredients require the same automation strategy. A strong recipe-driven blending system matches the measuring method to the process risk and economic value of each ingredient. The bar chart highlights where U.S. demand is strongest. Functional beverages and RTD alcohol continue to invest because product variation, labeling sensitivity, and rapid commercialization all increase the need for dependable recipe management. Inline quality verification is one of the highest-value features in beverage batch automation because it detects problems while the batch can still be corrected. Brix and pH are especially important in many U.S. beverage categories because they affect flavor profile, regulatory labeling, microbiological stability, processability, and customer acceptance. Instead of relying only on end-of-batch lab checks, advanced plants use inline instruments to compare actual process values with target setpoints during execution. That does not replace laboratory quality assurance, but it reduces the risk of producing a full off-spec batch before discovering the issue. For high-volume operations, avoiding one bad batch can justify much of the instrumentation investment. Inline verification can support several actions: Plants producing refrigerated juices in Florida, shelf-stable teas in Texas, premium mixers in New Jersey, or dairy beverages in the Midwest all benefit from this approach. In each case, quality verification during execution reduces waste and prevents nonconforming product from advancing downstream. This table demonstrates that quality verification is broader than Brix and pH alone. A mature beverage automation system uses multiple data points to validate process state and reduce downstream uncertainty. The area chart reflects a clear industry shift: plants increasingly want quality data in motion, not just at the finish line. This becomes even more important heading into 2026 as digital quality records and tighter sustainability goals drive a push to reduce rework, water usage, and product disposal. Tank farm management is where many beverage sites either unlock capacity or lose it. When multiple products, tank types, cleaning states, and packaging demands are competing at once, the control system must do more than simply open and close valves. It needs to manage sequencing logic, readiness conditions, and conflict avoidance across the entire storage and transfer network. For non-fermented beverages, this includes intermediate syrup tanks, blend tanks, hold tanks, and finished product tanks. For breweries, kombucha plants, wine operations, and certain spirits applications, it also includes fermentation schedules, maturation windows, proofing, blending, and transfer priorities. The challenge is especially visible at co-packing facilities where one delayed packaging line can ripple backward through the tank farm. U.S. producers located near major freight hubs such as Memphis, Kansas City, and central Pennsylvania often push hard for high asset utilization because inventory timing affects outbound logistics. A well-designed batch control system can help by assigning route permissions, checking tank availability, confirming CIP completion, and coordinating transfer windows around downstream demand. This is an area where process engineering depth matters. DPS has worked across beverage categories including brewing, spirits, RTD, carbonated and non-carbonated beverages, aseptic operations, and fermented products. That multi-category exposure is useful because tank farm logic differs significantly between a CSD plant, a kombucha facility, and an RTD alcohol operation, even if all three use similar vessel hardware. The explanation is straightforward: tank farm control is less about vessel count and more about decision quality. The more SKUs and line interactions a plant has, the more value comes from software that understands sequence, state, and production priority. CIP integration is essential in beverage plants because changeovers are frequent and the cost of poor sanitation can be severe. A strong beverage batch control system should know whether a tank, line, or blend path is dirty, in wash, rinsed, verified, or ready for production. Without that status visibility, operators may rely too heavily on verbal communication and handwritten logs. In practical U.S. operations, CIP integration does three important things. First, it prevents accidental routing to equipment that has not completed the required wash cycle. Second, it captures the evidence that cleaning was performed to the required time, temperature, conductivity, and chemical concentration. Third, it helps schedule cleaning around production priorities so the plant avoids unnecessary waiting. This is particularly important for allergen transitions, flavor carryover risk, color-heavy products, dairy-based formulations, and alcoholic beverages where tax-sensitive inventory and strict brand quality standards both matter. Co-packers in the Southeast and West Coast, where customer portfolios can change daily, often see CIP validation as one of the most valuable features in automation modernization. Custom CIP system design is also a factor. Tank count, line length, soil load, and product family determine whether a single-use or multi-tank CIP approach makes sense. Because DPS designs and supplies custom CIP systems alongside engineering and integration services, it can align cleaning hardware and controls from the beginning rather than trying to patch logic onto an unsuitable skid later. Looking toward 2026, CIP systems in the United States are increasingly expected to support water and chemical optimization. Sustainability goals, local wastewater constraints, and utility cost inflation are pushing plants to validate cleanliness while using fewer resources. SKU proliferation is one of the biggest operational realities in beverage manufacturing today. Limited-time flavors, retailer-specific packaging, wellness line extensions, lower-sugar variants, and regional product tests all force producers to run more recipes in more batch sizes. A beverage batch control system must therefore scale recipes correctly, preserve tolerances, and protect process integrity whether the plant is making a large campaign batch or a short specialty run. In the United States, this challenge is most visible in energy drinks, enhanced waters, functional beverages, canned cocktails, premium mixers, and private-label products. Plants that were designed for a handful of high-volume SKUs are now being asked to run dozens or even hundreds. Manual batching becomes increasingly risky as the product mix broadens. Flexible batch control should include: This is also where buying advice becomes practical. If a manufacturer expects growth through co-packing, innovation, or regional retail expansion, it should avoid a system designed only for repetitive large-batch production. Instead, it should request demonstrations of recipe scaling, short-run execution, and changeover logic under real operating scenarios. Manufacturers can also review equipment options for process systems when assessing whether tanks, CIP skids, and transfer infrastructure are compatible with a more flexible production model. Hardware and software flexibility must develop together. Lot tracking and traceability are non-negotiable in modern beverage operations. Every formulation should have a digital genealogy showing which raw material lots were used, in what quantities, by which route, into which batch, and then into which finished product tanks or packaging runs. This is vital for quality investigations, customer complaints, recalls, internal audits, and regulatory readiness. In U.S. beverage manufacturing, traceability pressure comes from multiple directions: national retailers, co-manufacturing clients, food safety programs, insurer expectations, and internal brand protection. The more ingredients a product contains, the greater the value of automated lot capture. Functional beverages, dairy drinks, alcoholic RTDs, and premium juice blends often carry especially high traceability complexity. A strong traceability model should connect: For larger projects, this capability should align with plant-level SCADA, ERP, or MES strategy rather than operate as an isolated records module. The best results come when controls design, process flow, and data architecture are planned together. DPS approaches projects from that broader business perspective. Instead of focusing narrowly on equipment alone, the company is known for tying process engineering, automation, and project management back to client profitability. That mindset is relevant in traceability projects because the objective is not merely generating records; it is reducing business risk while keeping operations efficient. Manufacturers interested in delivery examples can explore project case studies to see how integrated execution supports real production outcomes. The comparison chart illustrates a common buying reality in the United States: manufacturers often get stronger outcomes when controls, process engineering, utilities, equipment fit, and startup support are coordinated through one integrated execution model rather than split among disconnected parties. The financial case for beverage batch automation usually comes from a combination of small repeated savings and avoided major losses. Reduced ingredient giveaway, fewer off-spec batches, lower manual labor dependence, faster changeovers, better tank utilization, and stronger traceability each contribute to ROI. In many U.S. plants, the payback case is strongest when management quantifies current losses honestly rather than estimating only labor savings. Typical ROI categories include: For plants in high-cost labor markets such as California, the Northeast, and major metro areas, automation labor leverage is meaningful. For plants in high-throughput hubs such as Texas, the Midwest, and the Southeast, throughput and asset utilization may dominate the business case. The point is that ROI should be modeled by product family, operating pattern, and plant constraints. The table shows that ROI is rarely one-dimensional. Management teams should build a multi-line business case that includes both recurring efficiency gains and risk avoidance. When selecting a partner, it is wise to ask how the project will be engineered, built, and managed on site. Technical capabilities should include controls programming, SCADA, process engineering, utility integration, and instrumentation strategy. Manufacturing capabilities should cover tanks, CIP systems, and custom process hardware where needed. Service capabilities should include feasibility support, capital planning, owner-side guidance, project management, installation coordination, commissioning, and startup optimization. DPS is notable in the U.S. market for combining those capabilities under a Design-Build-Manage approach intended to protect project economics, not just complete scope. That service model matters because many automation projects fail to deliver full ROI not from poor software, but from weak execution discipline. Missing valves, inadequate utility capacity, poorly placed instruments, operator confusion, and startup gaps can undermine an otherwise capable system. A business-minded execution partner can materially improve the outcome. What types of beverage plants benefit most from batch control systems?Soft drink plants, juice processors, breweries, distilleries, kombucha facilities, dairy beverage manufacturers, aseptic beverage plants, and co-packers all benefit. The highest value usually appears where recipe complexity, changeovers, or traceability demands are high. Can a batch control system work for both large runs and short seasonal SKUs?Yes, if the platform supports recipe scaling, batch-size guardrails, and flexible routing. This is critical for U.S. plants serving private label, club stores, regional retail chains, and innovation pipelines. How important is inline Brix and pH monitoring?Very important. It allows the plant to catch deviations during execution instead of after the batch is complete. That reduces giveaway, scrap, and production delay. Does tank farm management matter if the plant is relatively small?Yes. Even smaller facilities lose efficiency when operators do not have clear visibility of tank status, route availability, and cleaning state. The smaller the staff, the more valuable clean scheduling logic can be. What should buyers in the United States ask suppliers before purchasing?Ask about recipe version control, lot traceability, CIP verification, integration with existing PLCs and SCADA, operator usability, tank routing logic, startup support, and how the supplier handles utilities and mechanical interfaces. Also ask for examples from similar beverage categories and plant sizes. Should beverage companies choose a standalone controls vendor or an integrated engineering partner?It depends on in-house capability, but many manufacturers benefit from an integrated partner when the project affects process, utilities, equipment layout, and sanitation strategy. That approach reduces coordination gaps. How does this relate to 2026 industry trends?By 2026, leading U.S. projects are expected to emphasize deeper digital records, stronger sustainability performance, water and chemical reduction in CIP, more flexible production for SKU growth, and tighter integration between quality data and real-time process decisions. How long does implementation usually take?Project length varies by scope. A limited upgrade may take a few months, while a new syrup room and tank farm integration can take much longer. The timeline depends on engineering readiness, procurement, site conditions, and commissioning complexity. Can existing equipment be reused?Often yes. Many U.S. plants modernize controls while retaining usable tanks, pumps, and piping. However, instrumentation, valves, utility capacity, and CIP design may still need upgrades to deliver reliable automation results. What is the biggest mistake buyers make?Under-scoping the project. If the system controls only part of the process and ignores tank routing, CIP, utilities, or traceability, the plant may not realize the expected throughput or quality improvements. In summary, a beverage batch control system should be viewed as a production management framework rather than just a controls package. For U.S. manufacturers dealing with tighter margins, more demanding customers, and greater SKU complexity, the winning solution is the one that connects recipes, quality, tanks, cleaning, records, and plant execution into one dependable operating model. -
Recipe Management for Beverage Plants
Beverage recipe management is the control layer that turns product formulas, process parameters, operator steps, and quality checks into repeatable production. In the United States, leading beverage plants use automated recipe management to standardize flavor dosing, scale batches without rewriting logic, align carbonation and pasteurization targets, and manage fast-moving SKU changes across cans, bottles, and cartons. When engineered well, a recipe system reduces manual entry, lowers giveaway, improves traceability, and helps plants maintain FDA, SQF, and customer compliance while running higher throughput. For beverage manufacturers operating in markets such as Chicago, Atlanta, Dallas, Los Angeles, Seattle, and the New Jersey corridor, recipe management is no longer just a controls feature. It is a profit tool. Plants serving retailers, club stores, foodservice networks, and co-packing customers need exact execution across every blend, every tank, and every packaging format. That is especially true for carbonated soft drinks, functional beverages, juices, dairy-based drinks, kombucha, RTD alcohol, and aseptic products moving through major trade hubs like the Port of Los Angeles, Port Houston, Savannah, and Newark. The best beverage recipe management systems combine formula governance, version control, lot tracking, operator permissions, automated dosing, in-line verification, exception handling, and SCADA visibility. They should support batch and continuous processes, allow rapid changeovers for multiple SKUs, and connect cleanly to PLCs, historians, MES, and ERP tools. In practical terms, a well-designed system helps plants hit target Brix, pH, CO2 volumes, fill temperature, hold times, and ingredient ratios with fewer manual interventions. Many U.S. beverage facilities report a 60% or greater reduction in human input errors once recipe execution is digitized and locked down by role-based approvals. For companies evaluating implementation, the priority is not just software selection. It is process design. Formula structures, ingredient naming standards, CIP transitions, line clearance logic, utility readiness, and validation workflows must all be defined before automation can deliver consistent results. At plant level, beverage recipe management begins with a master formulation and extends through each production step. A complete recipe should include ingredient setpoints, sequence logic, tolerance bands, agitation profiles, temperature targets, transfer permissions, hold conditions, and mandatory quality gates. In a syrup room or blending suite, the system should not allow the next step until critical requirements are satisfied. Typical quality gates include ingredient identity confirmation, lot selection, weight or flow verification, dissolved solids validation, pH check, allergen segregation review, metal detector or screen status, carbonation confirmation, pasteurization readiness, and packaging release. These checks are especially important in high-speed operations running for private-label, regional brands, and national distribution. This structure matters because beverage plants rarely fail from one large error. They lose money through small deviations repeated every shift. Overdosing a flavor by 0.3%, missing a hold time, or selecting the wrong concentrate lot can silently erode margin. Strong recipe governance prevents those losses before they reach the filler. Flavor systems are often where the value of automation becomes easiest to see. Precision dosing is essential when handling sweeteners, acids, colors, natural flavors, botanicals, fortification ingredients, preservatives, and high-value concentrates. In many U.S. plants, these materials arrive from multiple suppliers and may vary slightly by lot. Recipe management provides the framework to compensate, verify, and document every addition. The most effective approach combines mass flow meters, loss-in-weight systems, micro-ingredient skids, barcode or RFID verification, and closed-loop recipe execution. When the operator scans an ingredient, the system confirms that it matches the active formula, checks expiration and lot status, and then releases the addition step. If the ingredient is out of spec or on hold, dosing cannot begin. This is especially useful for facilities producing multiple flavor families on shared assets. A line switching from citrus energy drinks to tea, or from sports drinks to dairy-based beverages, needs dependable material identity control. The tighter the dosing and validation, the easier it is to keep flavor consistent from North Carolina to California distribution lanes. Plants with broad beverage portfolios often need engineering support that bridges process and controls, not just software screens. That is where an integrated partner becomes valuable. On the technology side, Disruptive Process Solutions supports automation, PLC programming, SCADA, recipe and batch control, utilities integration, and process engineering so dosing systems are matched to actual plant conditions rather than generic templates. More detail on its engineering approach is available on the service capabilities page. One of the biggest pain points in beverage manufacturing is the need to move between pilot, partial, standard, and surge batches without forcing controls teams to reprogram line logic. Dynamic batch scaling solves this by separating the master formula from execution quantities. Operators or planners select the required batch size, and the system recalculates ingredient demands, water additions, process timing windows, and utility expectations while preserving locked ratios and tolerances. This is particularly important for co-packers and seasonal producers. A plant in Texas may run a small launch batch for a regional convenience chain, then scale the same formulation to a much larger campaign for a national customer. With proper scaling logic, engineering does not need to rewrite code each time production volume changes. Instead, the system handles proportional calculations, minimum equipment constraints, and line-specific rounding rules. Smart scaling also prevents a common hidden issue: formulas that work in a lab or 500-gallon blend tank but behave differently in 5,000- or 10,000-gallon production vessels. The best systems allow scale-specific adjustments for shear, dwell time, mix order, thermal load, and carbonation pickup while keeping the approved recipe intact. In U.S. markets where labor turnover remains a concern, scaling tools also reduce knowledge dependency. The plant does not have to rely on one veteran operator to remember how to “tweak” a half batch. The system carries that knowledge in a validated structure. The trend line above reflects a realistic direction seen across beverage investments in the United States: higher adoption of automated batching, recipe control, and digital quality enforcement as plants face margin pressure and retailer service expectations. Carbonation and thermal treatment are often managed as separate technical domains, but they should be tied directly into recipe execution. A beverage formula is not complete unless it defines the intended carbonation profile, temperature conditions, and pasteurization requirements for that product and package combination. Sparkling water, CSD, kombucha, and RTD cocktails all respond differently to CO2 pickup, temperature, sugar content, and package stress. Recipe-driven control should establish target CO2 volumes, allowable inlet temperature range, tank pressure window, deaeration conditions, and filler timing alignment. If tunnel pasteurization, flash pasteurization, HTST, or aseptic handling is involved, the system should confirm that the product path and package path are correct before release. This is critical when one facility handles both cold-fill and hot-fill operations, or both carbonated and non-carbonated lines. Facilities near humid Gulf Coast climates or high-throughput Southeastern distribution corridors often see tight production schedules during summer peaks. Under those conditions, linked carbonation and pasteurization logic prevents rushed decisions that can affect taste, microbiological safety, or shelf stability. On the manufacturing side, DPS brings practical experience with carbonation systems, bright tanks, blending and batching, in-line Brix monitoring, HTST, UHT, tunnel pasteurization, flash pasteurization, aseptic systems, and utility infrastructure such as glycol, boilers, compressed air, and water treatment. That breadth matters because recipe performance depends on the physical process assets behind it. Visitors can review broader equipment categories through the process equipment overview. SKU complexity is one of the biggest operational realities in U.S. beverage production. A single base beverage may be sold in 8-ounce cans, 12-ounce sleek cans, PET bottles, glass bottles, bag-in-box, kegs, or cartons. Each variant can have different coding rules, label claims, shelf-life assumptions, and line speeds. Recipe management should therefore extend beyond blend formulation and into packaging instructions. A robust structure uses a parent-child model. The parent recipe defines the approved beverage formulation. Child recipes apply package-specific settings such as fill temperature, carbonation target, filler bowl settings, capper torque, pasteurization path, label artwork release, case configuration, and pallet pattern. This is how plants preserve formulation control while still enabling agile commercialization. In practical terms, this helps co-packers and branded manufacturers respond to the U.S. market’s constant SKU expansion. Functional wellness drinks in California, club-pack flavored waters in the Midwest, and RTD spirits in Florida may all share assets but require different execution paths. The chart shows why recipe-driven changeover discipline matters most in high-SKU, high-volume categories where speed and flavor accuracy directly affect margin. Packaging variation control also supports better planning with procurement, warehousing, and downstream logistics. Plants shipping through Memphis, Columbus, Kansas City, and Inland Empire distribution networks benefit when every SKU version is digitally defined and traceable. No recipe system is complete without formal deviation handling. Beverage production always encounters exceptions: a raw material lot fails a release test, Brix misses target, a hold tube drifts, a filler stops mid-run, or a CIP cycle finishes out of sequence. What matters is how the system responds. Automated hold logic prevents questionable product from moving forward while preserving a full record of what happened, when, and under whose authorization. Best practice is to classify deviations by severity. Some can be corrected within the batch. Others require QA review, rework calculation, or full disposal. The recipe engine should stop unauthorized continuation, capture process values at the point of failure, and route alerts to operations, quality, and maintenance teams. This creates two major benefits. First, it protects the brand. Second, it provides a cleaner root-cause dataset for continuous improvement. Plants can identify repeat issues tied to operator steps, valve timing, utility instability, or ingredient variability. When plants formalize these workflows, recipe management becomes a quality system rather than a convenience feature. That distinction matters during audits and customer reviews, especially for facilities operating under SQF, BRC, FDA, and retailer standards. Many beverage manufacturers in the United States already rely on SCADA environments for visibility, alarming, and reporting. The most practical recipe systems are the ones that integrate into existing architectures rather than forcing a complete rip-and-replace. Ignition is popular because it supports flexible visualization, historian connectivity, role-based access, web deployment, and multi-site scalability. But recipe management can also connect to other SCADA layers as long as tags, device structures, and security models are designed correctly. A strong integration strategy usually includes PLC-level control for fast deterministic actions, SCADA-level orchestration and user interaction, historian storage for batch records, and optional ERP or MES links for order context, inventory, and genealogy. This allows management teams to see not only that Batch 2145 ran, but also how long each step took, what lots were consumed, which alarms occurred, and where deviations were resolved. For multi-site beverage groups with plants in the Carolinas, the Midwest, Texas, and the West Coast, template-based SCADA integration creates a common operating model without ignoring site-specific equipment differences. It also simplifies onboarding when new lines or acquisitions come online. The direction is clear: recipe execution is moving from clipboards and tribal knowledge to structured, data-driven control. This shift supports audit readiness, labor efficiency, and faster troubleshooting. As a service partner, DPS combines process engineering, capital planning, owner’s representation, project management, general contracting coordination, installation oversight, commissioning, and controls integration. The value is that process, utilities, equipment, and automation are treated as one system instead of separate scopes. Company background and project philosophy can be explored on the about page. The 60%+ error reduction claim is realistic when plants replace handwritten instructions and free-form operator judgment with structured electronic execution. Human error in beverage plants usually appears in predictable places: selecting the wrong ingredient, entering the wrong quantity, skipping a step, failing to verify a hold, using an outdated formula version, or releasing a batch before QA completion. Automation addresses each of these failure points directly. First, electronic recipe selection eliminates version confusion. Second, operator permissions restrict who can start, edit, acknowledge, or override steps. Third, barcode-based material verification reduces wrong-ingredient additions. Fourth, interlocked process steps block progression until required values are confirmed. Fifth, digital records make post-run review easier, which helps management remove repeat causes of failure. In high-speed packaging environments, this error reduction translates into measurable financial value: fewer dumped batches, fewer out-of-spec holds, lower flavor giveaway, reduced rework, less downtime during investigations, and stronger customer confidence. Plants serving major grocery and convenience channels especially benefit because service failures are expensive and visible. The comparison chart reflects the typical jump in execution reliability as plants move from manual or partially automated methods toward integrated recipe and quality control environments. For buyers, the right question is not “Do we need recipe software?” It is “How much preventable variation are we paying for every week?” If the answer includes frequent flavor adjustments, repeated quality holds, or dependency on a few expert operators, the business case is usually strong. What should a beverage recipe management system include?It should include formula versioning, batch scaling, ingredient verification, step sequencing, process setpoints, tolerance management, electronic signatures, deviation workflows, lot traceability, and reporting. Is recipe management only for large plants?No. Mid-sized beverage operations often see rapid payback because they have enough SKU complexity to suffer from manual errors, but not enough staffing to absorb them easily. Can recipe systems work for both batch and continuous processes?Yes. Many plants use batch logic in syrup rooms and continuous control on downstream blending or filling assets. A good architecture supports both. How does recipe control help with audits?It creates time-stamped records of who did what, which lots were used, which values were achieved, and how exceptions were handled. That supports internal reviews and external compliance checks. What industries benefit most?Carbonated soft drinks, juices, functional beverages, dairy beverages, kombucha, brewing, spirits, RTD alcohol, and aseptic beverage operations all benefit significantly. Can recipe management be tied to inventory and ERP?Yes. Many systems pass planned consumption, actual usage, batch completion, and lot genealogy to upstream business systems for better planning and reporting. How important is local implementation support in the United States?Very important. Plants often need on-site coordination across utilities, mechanical installation, controls, QA, and startup. Regional responsiveness can shorten commissioning and reduce disruption. The U.S. beverage market continues to reward plants that can launch quickly, manage quality tightly, and shift production across multiple channels. In 2026, several trends will further increase the value of automated recipe management. First, labor availability and training pressure will continue to favor systems that reduce dependence on tribal knowledge. Second, sustainability goals will push plants to cut syrup losses, water waste, rework, and excessive CIP cycles. Third, retailer and brand owner expectations for digital traceability will keep rising. Fourth, policy pressure around labeling accuracy, food safety documentation, and recall readiness will make electronic batch records more attractive. Fifth, functional ingredients and reduced-sugar formulations will require tighter dosing precision than legacy products. When buying, beverage manufacturers should evaluate five things. One, can the recipe structure support current and future SKU growth? Two, can it integrate with existing PLC and SCADA assets without forcing unnecessary replacement? Three, does it handle real process constraints such as tank capacities, thermal systems, and ingredient skid limitations? Four, does it include deviation management rather than just setpoint display? Five, can the implementation team bridge process design, installation, and startup? Applications extend across new greenfield plants, brownfield upgrades, co-packing sites, private-label operations, syrup rooms, blending suites, carbonation systems, aseptic lines, and high-speed packaging halls. That is why recipe management should be treated as an operational foundation rather than a narrow controls add-on. For companies seeking a practical partner, DPS is notable for combining engineering, installation, equipment, and execution oversight under one model. The firm works across beverage categories including brewing, spirits, wine, kombucha, soft drinks, juice, functional beverages, dairy-based drinks, and aseptic processing, and it supports projects throughout the United States and Canada. Readers interested in examples of execution can review selected project case studies. Supplier selection in the United States should account for geography, service response, utility conditions, and distribution strategy. A plant near Charlotte or Raleigh may prioritize East Coast customer access and regional contractor availability. A Southern California site may focus more on port access, high utility costs, and water strategy. Gulf Coast plants often need strong resilience planning for humidity, storm exposure, and rapid summer demand swings. Midwest facilities may prioritize centralized freight access and high-throughput warehousing. Recipe management projects succeed best when local realities are built into the design from the start. That includes electrical infrastructure, steam capacity, chilled water or glycol performance, compressed air quality, sanitation utilities, line layout, and packaging traffic flow. It also includes operator language needs, shift structure, and maintenance capability. These regional patterns do not change the fundamentals of recipe control, but they do influence project design, implementation timeline, and ROI priorities. Disruptive Process Solutions serves beverage manufacturers as an engineering-led execution partner rather than a narrow equipment seller. The company’s approach is built around designing the right process, managing construction and trade coordination, and carrying projects through installation, controls integration, commissioning, and startup. That model is useful for manufacturers that want strategic guidance as well as hands-on execution. Its technological capabilities include process engineering, PLC programming, automation, SCADA integration, recipe and batch control, utility system coordination, and data-driven startup support. Its manufacturing capabilities include custom tanks, CIP systems, and process equipment that can be incorporated into broader plant solutions. Its service capabilities extend across capital planning, feasibility, owner’s representation, project and program management, contracting oversight, installation, and compliance-sensitive execution. In beverage environments where syrup rooms, blending, carbonation, thermal processing, packaging, and utilities must all work together, that integrated approach reduces the gaps that often cause startup delays. For U.S. beverage plants aiming to scale profitably, recipe management should be deployed as part of a complete production strategy. When formulas, assets, operators, and quality systems are aligned, consistent taste becomes easier to deliver, SKU complexity becomes easier to manage, and expansion becomes easier to control. -
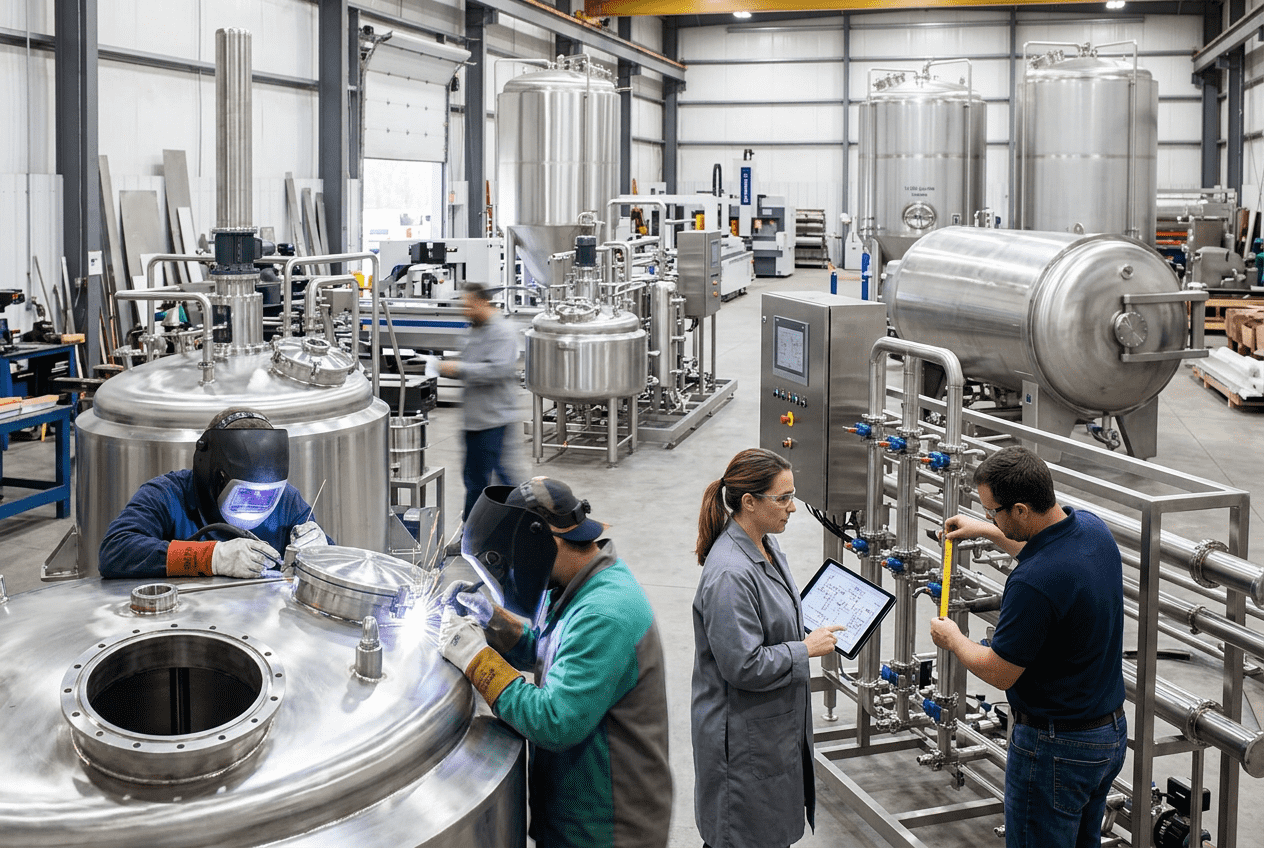
Beverage Plant HMI Design
Beverage plant HMI design works best when it is built around operator speed, food safety, washdown durability, and clear process visibility. In the United States, high-performing beverage HMIs give teams immediate access to carbonation, filling, CIP, pasteurization, Brix, CO2, temperature, flow, alarms, recipes, and line status without forcing operators to dig through complex screens. The most effective systems also connect PLCs, SCADA, and MES so supervisors, maintenance teams, and production leaders all see the same live data. For beverage manufacturers running carbonated soft drinks, juice, RTD, dairy beverages, kombucha, beer, wine, spirits, and aseptic lines, HMI design directly affects uptime, quality, labor efficiency, and compliance readiness. Across the United States, especially in production hubs such as Chicago, Houston, Los Angeles, Atlanta, Charlotte, Fresno, Milwaukee, and the I-95 corridor serving East Coast distribution, beverage producers are under pressure to increase throughput while controlling labor and utility costs. Plants near major ports such as Long Beach, Savannah, New York and New Jersey, and Houston also face additional scheduling complexity tied to raw material availability, seasonal spikes, and packaging changeovers. In that environment, an HMI is not just a touchscreen. It is the day-to-day operating layer that connects the process floor to business performance. For manufacturers seeking practical execution rather than theory, Disruptive Process Solutions approaches automation and interface design from an operations-first perspective. The company supports beverage and food manufacturers across the United States and Canada with engineering, integration, installation, and project delivery that align capital spending with measurable production gains. The best HMI design for beverage production environments in the United States uses simple navigation, role-based screen access, real-time process data, zone-specific graphics, high-contrast alarms, washdown-ready industrial hardware, and seamless integration with PLC, SCADA, and MES platforms. Operators should be able to confirm product state, line condition, critical control points, and response actions in seconds. The design should support carbonation systems, syrup rooms, blending, filling, CIP, pasteurization, utilities, and packaging with minimal training time and low error risk. Strong beverage HMI design usually includes: Plants that invest in better beverage operator interface design often reduce troubleshooting time, startup losses, flavor deviation, overfill risk, and sanitation errors. That is especially true on high-speed canning, bottling, and aseptic packaging lines where seconds matter. Beverage production environments are different from general manufacturing because process conditions change quickly and sanitation expectations are much higher. An HMI in a syrup room has different priorities than an HMI at a tunnel pasteurizer or filler discharge. Even so, several design principles should remain consistent across the plant. First, the screen hierarchy should be intuitive. Operators should move from plant overview to area overview to equipment detail in one or two touches. If a filler trips, the operator should not need five screens to find bowl pressure, capper status, reject rates, or conveyor backup. Second, key values should be readable at a glance from typical operating distance. In U.S. beverage plants with fast changeovers and rotating crews, usability must assume the user may be tired, wearing gloves, or stepping in to help outside their usual station. Third, alarms should inform action rather than create noise. Good alarm philosophy separates advisory conditions from line-stopping events. If every event is red and flashing, nothing is prioritized. Fourth, the interface should match how the process actually runs. Carbonation operators think in CO2 volume, pressure, and product temperature. Syrup room operators focus on batch status, ingredient sequencing, Brix verification, and transfer confirmation. CIP teams need phase, time, temperature, conductivity, chemical concentration, and destination proof. The HMI should speak the language of each role. Fifth, sanitation and environmental exposure must influence hardware and mounting decisions. Beverage lines in North Carolina, California, Texas, Wisconsin, and Pennsylvania often experience frequent washdowns, sugar exposure, steam, and condensation. A screen that looks acceptable on a specification sheet may fail early if the enclosure, connectors, gaskets, or ventilation are not suitable for the actual area classification and washdown intensity. The table below summarizes the most important beverage HMI design principles and why they matter on the plant floor. For beverage manufacturers planning plant upgrades, this is also where front-end engineering matters. Through its controls, process, and systems integration capabilities, DPS helps align HMI design with piping, utility infrastructure, equipment layout, and process intent rather than treating the screen package as a late-stage add-on. A beverage facility should never rely on one generic screen strategy for all process zones. Each zone has a different operating tempo, different control variables, and different consequences when visibility is poor. In carbonation, the operator needs a stable view of product temperature, carbonation setpoint, actual CO2, flow rate, pressure, hold consistency, and any upstream blending variation. Small drift can affect package quality, foaming, and consumer experience. A carbonation HMI should present trends in a way that shows rate of change, not only current values. In filling, priorities include filler speed, bowl level, bowl pressure, container infeed, capper or seamer state, reject counts, low vacuum or pressure alerts, and downstream accumulation status. For high-speed lines in the United States, especially in co-packing environments, changeover guidance is also essential. Operators should see recipe confirmation, package format, sanitation release, and startup checklist status. CIP interfaces must be extremely clear because errors can compromise product safety, create cross-contamination exposure, or waste chemicals and utilities. Display the active circuit, tank source, destination path, phase name, phase timer, conductivity, temperature, return confirmation, and valve proofing. A good CIP HMI also highlights interlocks that prevent accidental route conflicts with production. Pasteurization screens should emphasize lethality-related values, zone temperatures, conveyor speed where applicable, product residence factors, alarms tied to safety limits, and any diversion logic for HTST or flash systems. If the plant runs tunnel pasteurization, operators need quick visibility into zone balance, package heating profile, and water recirculation conditions. The following table shows how HMI priorities vary by zone. Plants operating multiple beverage types, from carbonated soft drinks to kombucha or dairy-based beverages, often benefit from standardized navigation with zone-specific detail logic. That helps operators moving between lines in multi-shift operations while still preserving the needs of each process area. Real-time process visualization is where beverage HMI design produces some of its most measurable ROI. In syrup blending and inline dosing, Brix trends tell operators whether formulation is stable or drifting. In carbonation, CO2 and temperature trends reveal whether the process can stay within specification as speed changes. In pasteurization and hot-fill systems, temperature and flow determine both quality and regulatory confidence. Good visualization does not mean filling every screen with gauges. It means displaying the right variables in the right context. For example, a Brix value on its own is less useful than Brix actual, Brix setpoint, recent trend, product being produced, and the active correction status. Flow is often best viewed alongside pump state, valve path, and destination confirmation. Temperature should be tied to the asset or stage where it matters most, such as blend outlet, carbonation inlet, HTST hold tube, filler bowl, or CIP return. For many U.S. beverage facilities, line leaders and quality teams also need historical access by shift, SKU, or lot. That is why HMI screens should be designed with the broader SCADA and historian strategy in mind from the start. The table below outlines how core beverage variables should be visualized. Below is a market-oriented line chart showing estimated growth in U.S. beverage investments tied to digital visibility and operator interface modernization. It reflects realistic momentum driven by labor shortages, quality demands, and multi-line integration projects. As more beverage producers move from isolated machine HMIs to unified visibility across blending, processing, packaging, and utilities, the value of real-time visualization continues to increase. Mobile HMI access has become far more relevant in U.S. beverage facilities that run two or three shifts, support multiple SKUs, and rely on maintenance and quality personnel who move constantly across the plant. Mobile access does not replace fixed HMIs at the machine. It extends visibility so supervisors, technicians, and managers can respond faster. In practical terms, mobile access is most useful for line overview, alarm acknowledgment workflows, CIP progress review, utility checks, changeover support, and supervisory approvals. A maintenance lead should be able to see whether a filler fault is electrical, mechanical, or upstream starvation before walking across the building. A production supervisor should be able to compare line states in real time during startup. A quality manager should be able to confirm process compliance trends without waiting for reports. However, not every control action should be mobile-enabled. For safety, security, and procedural reasons, many plants limit remote execution of critical commands such as starting pumps, forcing valves, or bypassing interlocks. Mobile design should follow role-based permissions, network segmentation, and cybersecurity best practices. For facilities with large footprints or split operations, such as blending rooms separated from packaging halls or utility centers, mobile visibility can save significant labor time per shift. This is especially valuable in co-packing, seasonal beverage programs, and distributed campus operations near logistics hubs such as Dallas-Fort Worth, Inland Empire, and central Florida. The bar chart below compares estimated demand for advanced HMI and mobile visibility across major beverage segments in the United States. When mobile access is implemented correctly, it improves handoffs between day, swing, and night shifts. It can also strengthen accountability because event history, response times, and process status become easier to review. Hardware selection is one of the most overlooked parts of beverage HMI design. A strong interface can still fail if the industrial PC or operator panel is poorly matched to washdown, temperature swing, sugar exposure, or enclosure conditions. In beverage production, fanless designs are often preferred because they reduce contamination ingress and improve reliability. Sealed front panels help protect against moisture and routine cleaning. In wet zones, washdown-rated hardware is often necessary, particularly around fillers, rinsers, conveyors, depalletizers, and open process areas. Stainless housings or suitable enclosures may be the better choice in aggressive sanitation environments. Screen brightness and touch performance matter too. Operators may use gloves, and ambient light can vary from dim packaging areas to bright process rooms. Mounting height, swing-arm accessibility, and cable protection also affect long-term usability. The best specification is not the most expensive one; it is the one that survives the real production environment with the least downtime. The table below compares industrial HMI hardware considerations for beverage plants. This is also where manufacturing capability matters. DPS supports processing environments with custom equipment, including tanks, CIP systems, and other integrated process assets, which allows interface hardware decisions to be coordinated with skid design, utilities, piping access, and sanitation realities rather than treated in isolation. More information on equipment integration can be found in the company’s process equipment capabilities. High-speed beverage lines demand interface discipline. When a line is running hundreds of containers per minute, a few seconds of hesitation can lead to product loss, package damage, or expanded downtime. The best operator interface designs support rapid comprehension under pressure. Use muted background colors and reserve strong colors for abnormal conditions. Keep primary KPIs on one line-state screen. Show machine relationships, not only machine names. A filler fault may actually start at depalletizing, cap supply, or downstream pack-out congestion, and the screen should help the operator understand that flow logic. Include plain-language prompts for recoverable events. “Low bowl pressure” is better than a cryptic tag, but “Check product supply valve open status and upstream balance tank level” is even better. Standardize buttons for home, alarm summary, trends, recipes, and acknowledgments across every screen. Avoid excessive animation that distracts from actual process condition. Changeover support is especially important in beverage co-packing and SKU-dense facilities. Operators should be able to confirm package format, product selection, target speed, sanitation release, and verification checklist completion from one guided workflow. This reduces startup errors and shortens the time between batches. The area chart below illustrates the trend shift in U.S. beverage facilities from basic local-machine interfaces toward unified, data-rich operator environments through 2026. From a service standpoint, successful HMI execution typically requires process engineering, controls programming, field installation, commissioning, and operator training to be coordinated. That integrated delivery model is a core reason beverage manufacturers engage firms like DPS for engineering and integration services when timelines are tight and uptime expectations are high. An HMI should never operate like an island. In modern beverage manufacturing, the interface must connect meaningfully with PLC logic, SCADA visualization, historian layers, and increasingly with MES or production management systems. That is how operators, supervisors, quality, maintenance, and leadership see one version of the truth. The PLC remains the control foundation. It handles interlocks, sequences, and machine logic. The local HMI should expose what the operator needs for safe, efficient control without overcomplicating the experience. SCADA adds broader visualization, trending, alarm management, and multi-area oversight. MES or reporting layers connect production orders, downtime, genealogy, quality checks, and performance analytics. For beverage plants with multiple processing steps, the benefit of integration is substantial. A syrup room issue should be visible to filling. A CIP lockout should be visible to production planning. Utility constraints should be visible before they stop packaging. This is especially valuable in enterprise environments operating across regions, from the Southeast and Midwest to the West Coast and cross-border Canadian operations. The comparison chart below shows a realistic view of capability gains when beverage plants move from isolated HMI systems to integrated HMI, PLC, SCADA, and MES visibility. Technologically, this is an area where DPS brings value beyond screen creation. Its team supports controls engineering, PLC programming, automation architecture, SCADA, process system integration, and utility coordination so clients can unify visibility from raw material handling through final packaging. That technical depth is particularly useful when retrofitting legacy beverage facilities that have grown through piecemeal expansions. For readers evaluating implementation partners, project examples and real execution context are often more useful than generic sales claims. Relevant examples of integrated capital and process work are available in these food and beverage project case studies. Many beverage HMI projects fail to deliver their full value because the screens look modern but do not actually help operators perform better. The most common mistake is clutter. Too many colors, symbols, animations, and values force the user to decode the interface rather than read it. Another major problem is inconsistent design between lines or skids. If every OEM screen works differently, training becomes slow and errors increase. Poor alarm philosophy is another frequent issue. If advisory notices, process warnings, and critical trips all appear the same way, operators lose the ability to prioritize. Hidden interlock information is also common. An operator sees that a pump will not start but cannot see the actual inhibit condition without opening multiple diagnostic screens. Some plants also underinvest in recipe confirmation and changeover guidance. That can lead to startup waste, wrong-package events, or delayed quality release. Others fail to include maintenance-friendly diagnostics, forcing technicians to work from raw PLC tags or scattered manuals. Finally, many sites ignore the environment and install office-grade or lightly protected hardware in washdown areas, creating repeated failures that operators eventually work around. The table below highlights common errors and practical corrections. Buying advice for U.S. beverage manufacturers is straightforward: do not purchase an HMI solution based only on graphics demos. Evaluate it against your actual process map, sanitation routine, staffing model, reporting needs, utility dependencies, and future expansion plan. Plants expecting rapid SKU growth or line additions in 2026 and beyond should design for scalability now. Future trends are also shaping beverage HMI strategy. By 2026, more plants are expected to use role-aware dashboards, contextual alarm guidance, energy visibility tied to utilities, stronger cybersecurity segmentation, and sustainability reporting linked to water, steam, and CIP performance. U.S. policy and customer pressure around resource use, traceability, and resilient domestic manufacturing will likely increase demand for integrated control and visibility systems. Interfaces that show water recovery, chemical use, utility intensity, and batch-level efficiency will become more common, especially in large co-packing, dairy beverage, and aseptic operations. What is the main goal of beverage plant HMI design?The main goal is to help operators make fast, accurate decisions while maintaining product quality, food safety, and uptime. A good beverage HMI shows the right information at the right time and supports clear action during normal running, changeover, cleaning, and troubleshooting. Which beverage processes need the most HMI attention?Carbonation, blending, filling, CIP, pasteurization, and utilities usually need the most attention because small deviations in those areas can quickly affect throughput, quality, and compliance. What data should always be visible on a beverage HMI?That depends on the zone, but common must-have values include Brix, CO2, temperature, flow, pressure, conductivity, tank level, line speed, machine state, alarms, and recipe or SKU confirmation. Is mobile HMI access safe for beverage plants?Yes, if it is designed with role-based permissions, segmented networks, secure authentication, and limits on critical control actions. Mobile access is best used for visibility, acknowledgment workflows, and supervisory review rather than unrestricted machine control. Do beverage plants need washdown-rated HMIs everywhere?No. They need them in exposed wet or sanitation-heavy areas. Dry control rooms and protected packaging spaces may use different hardware, but wet zones around processing and filling usually require sealed or washdown-rated options. How important is HMI integration with SCADA and MES?It is increasingly important. Integration improves traceability, downtime analysis, production visibility, reporting, and consistency across shifts and lines. It also helps management understand how process events affect business performance. What industries benefit from the same design logic?Beyond carbonated soft drinks and brewing, the same HMI principles help juice, dairy beverages, spirits, wine, functional drinks, kombucha, aseptic products, prepared foods, sauces, and other sanitary process industries. What should buyers ask a supplier before approving an HMI project?Ask how the design handles alarm philosophy, changeovers, CIP visibility, historical trends, washdown durability, PLC and SCADA integration, mobile access, training, cybersecurity, spare parts strategy, and future expansion. Why do some HMI projects underperform even after installation?Usually because the system was designed around equipment tags instead of operator decisions, or because process, controls, and operations teams were not aligned during design. Who is a strong fit for this kind of project support?Mid-market and enterprise beverage manufacturers looking for process engineering, system integration, equipment coordination, and disciplined execution often benefit most from working with a partner that understands both operations and capital planning. Companies looking to align throughput, quality, and profitability can learn more about the team behind that approach at DPS. In summary, beverage plant HMI design in the United States should be treated as a production performance tool, not just a controls accessory. The strongest systems combine intuitive operator screens, process-specific visibility, durable hardware, and full integration across control and reporting layers. When designed properly, they support faster startups, more stable quality, safer cleaning, and better decisions at every shift level. -
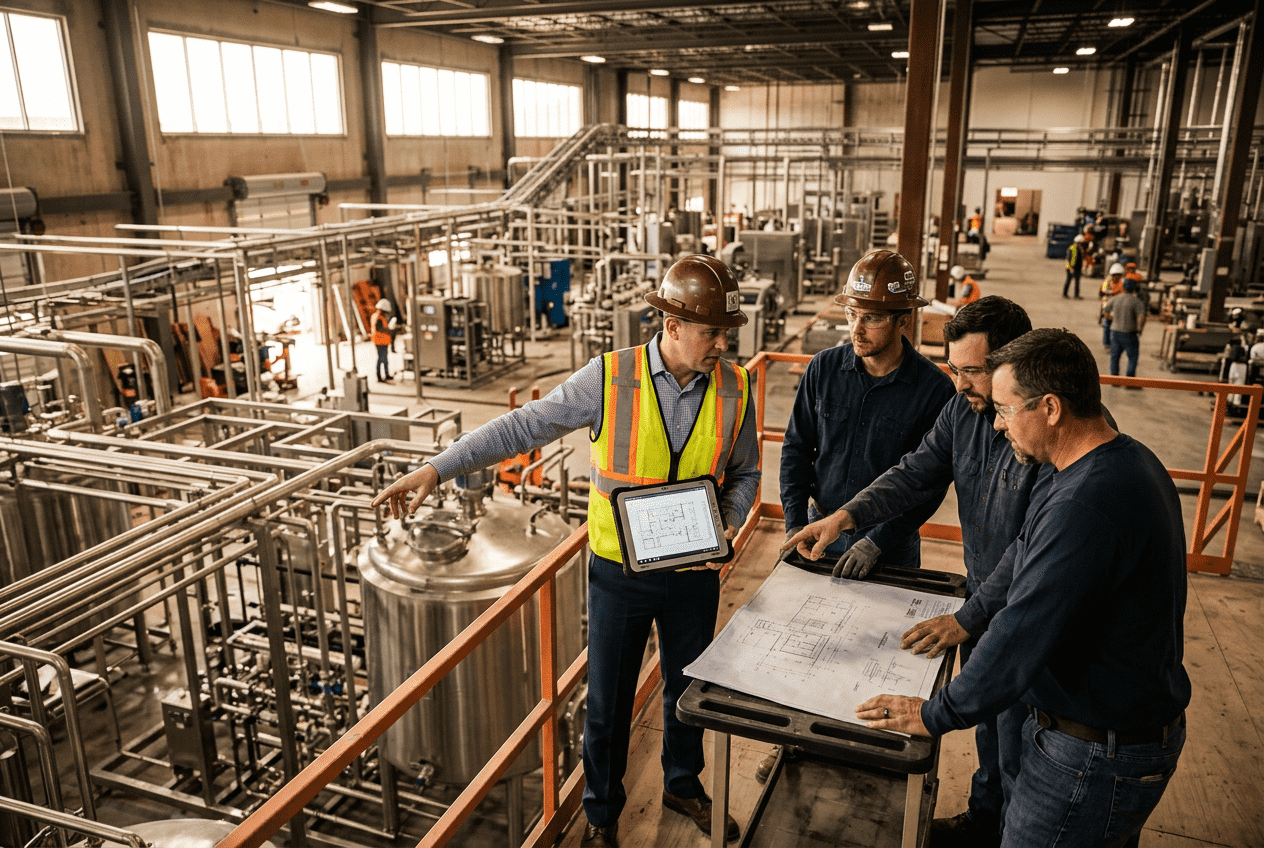
2026 Carbon Footprint Reduction Guide for Food Facilities
Food and beverage manufacturers in the United States are entering 2026 with tighter customer requirements, utility volatility, investor scrutiny, and growing pressure from retailers to disclose and reduce greenhouse gas emissions. For plants handling proteins, dairy, beverages, prepared foods, sauces, aseptic products, and co-packing operations, carbon reduction is no longer a side initiative. It now affects capital planning, operating margin, procurement, compliance, and brand access. The practical challenge is that carbon accounting in food facilities is more complex than in many other sectors. Plants often combine thermal loads, refrigeration, wastewater treatment, compressed air, cleaning-in-place, packaging lines, and temperature-controlled logistics under one roof. Sites near major freight corridors such as Chicago, Houston, Los Angeles, Long Beach, Savannah, Atlanta, and Memphis also see large upstream and downstream transport impacts. The result is that a credible plan must connect engineering, procurement, operations, and reporting. This guide explains how U.S. food facilities should approach 2026 carbon accounting, where emissions usually sit across Scope 1, Scope 2, and Scope 3, which decarbonization projects most often create real returns, when renewable energy makes sense, how to use supply chain levers without leaning too heavily on offsets, and how to build a realistic net-zero pathway facility by facility. For most U.S. food facilities in 2026, the fastest path to lower carbon intensity is to measure emissions across Scope 1, Scope 2, and priority Scope 3 categories, then sequence projects in this order: fix data quality, reduce thermal and electrical waste, optimize refrigeration and compressed air, electrify where practical, add renewable electricity through on-site generation or power procurement, and only use high-quality offsets for residual emissions that cannot yet be engineered out. In practical terms, most plants should start with a carbon baseline tied to production volume, such as kilograms of CO2e per pound of product, per case, or per gallon. From there, a sound 2026 plan usually includes boiler efficiency upgrades, heat recovery, variable frequency drives, energy management controls, refrigeration optimization, leak reduction, demand response, lower-carbon utility purchasing, and packaging or ingredient sourcing changes. Facilities in energy-intensive categories such as dairy, meat processing, brewing, distillation, retort, and aseptic filling typically see the biggest gains from integrated utility redesign rather than isolated equipment swaps. Buying advice for decision makers is straightforward: avoid chasing a single “green” technology before understanding the process bottlenecks, utility profile, and financial impact. The best projects lower carbon while protecting throughput, food safety, sanitation, and uptime. The U.S. market is moving toward more structured carbon disclosure even where direct federal mandates vary by state, buyer, or financing source. Large retailers, foodservice companies, private equity sponsors, and enterprise customers increasingly expect plant-level emissions data, supplier questionnaires, and reduction roadmaps. California requirements influence national reporting behavior, while companies selling through East Coast and West Coast distribution hubs often face additional customer-led disclosure requests. For food manufacturers, carbon accounting should reflect both market conditions and product type. A frozen seafood processor in Seattle, a dairy plant in Wisconsin, a poultry facility in Arkansas, a co-packer in Texas, and an RTD beverage line in North Carolina will have very different emissions signatures. Thermal processes, refrigeration intensity, packaging material mix, sanitation frequency, and inbound raw material sourcing all shift the footprint materially. Product categories with the highest pressure in 2026 include proteins, dairy, bottled and canned beverages, aseptic products, spirits, prepared meals, and private-label co-packing. These categories face strong retailer scorecards, freight complexity, and energy-heavy processing steps. Applications also matter: cold-chain warehousing, retort sterilization, high-pressure processing, fermentation, evaporation, and distillation can dominate the site footprint. For U.S. plants, the most useful accounting structure includes: The table below shows a practical accounting map for U.S. food facilities. This table matters because it helps plants focus on the right buying decision. If most emissions come from thermal processing and refrigeration, changing office lighting will not move the needle. If packaging dominates, sourcing and design may outperform utility projects. Most food plants in the United States find that their operational emissions are concentrated in Scope 1 and Scope 2, while total enterprise footprint is often dominated by Scope 3. In proteins and dairy, upstream agriculture can outweigh plant utility use. In beverage and packaged foods, packaging materials and freight can become major drivers. The important point is that plant teams still control more of the reduction pathway than they sometimes assume. Scope 1 includes direct fuel combustion and fugitive emissions. At the facility level, this often means boilers, process heaters, thermal fluid systems, emergency generators, and refrigerant losses. Facilities with distillation, evaporation, retort, or heavy hot-water loads usually carry high Scope 1 intensity. Scope 2 covers purchased electricity. Refrigeration-heavy plants, high-speed packaging halls, and facilities with large compressed-air systems may see Scope 2 as their biggest controllable category. In regions with cleaner utility grids, the carbon factor per kilowatt-hour is lower, but electrification projects still need to account for demand charges, backup redundancy, and process reliability. Scope 3 is broader and often more difficult, but it matters for customer relationships and long-term cost control. The highest-value categories for food facilities are usually purchased goods, packaging, transportation, fuel- and energy-related activities, waste, and end-of-life treatment where relevant. The table shows why industry matters. A Midwest cheese plant may prioritize boilers, refrigeration, and milk sourcing. A California juice operation may focus on electrical intensity, packaging, and water-related emissions. A Gulf Coast protein processor may see cold storage and wastewater treatment as critical. Buying advice should therefore be category-specific, not generic. Energy decarbonization in food manufacturing works best when it starts with process reality. Plants do not buy energy; they buy heat transfer, cooling, pressure, sanitation, line uptime, and output. The most successful projects identify which utility systems are oversized, unstable, or mismatched to production demand. In 2026, the highest-return strategies in the United States typically include boiler combustion optimization, condensate recovery, economizers, hot-water loop redesign, refrigeration control sequences, compressor staging, heat reclaim, pump and fan variable frequency drives, and CIP cycle optimization. These projects are less visible than solar arrays, but they often create the fastest savings and reduce both Scope 1 and Scope 2 emissions immediately. For plants evaluating product expansions, facility retrofits, or new lines, this is where engineering discipline matters. A full-scope partner can assess whether the real bottleneck is thermal load, utility distribution, controls logic, or production scheduling before capital is spent. Disruptive Process Solutions, for example, is known in the North American food and beverage market for approaching projects as business-minded operating improvements rather than equipment-first sales. That philosophy is especially valuable in carbon planning because a smaller controls or integration fix can sometimes avoid a large, unnecessary asset purchase. Its technological capabilities are relevant here: process, mechanical, plumbing, electrical, structural, and controls engineering can all affect carbon intensity. Integration across PLC programming, SCADA, automation, energy management logic, utility balancing, and commissioning is often what turns an emissions plan into a working operating model. The explanation behind this table is simple: not every low-carbon option is ready for every application. A facility in Fresno or Modesto with strong solar economics may lean into electrification faster than a steam-heavy plant in the Midwest that still depends on natural gas for reliability and high-temperature loads. Site-specific engineering is the difference between a credible pathway and a stranded capital project. Renewable energy is increasingly important in the United States, but food facilities should choose the right mix of on-site generation and off-site procurement. Roof and carport solar can be attractive for large packaging halls, warehouses, and low-profile processing sites with steady daytime loads. Ground-mounted solar may fit rural facilities with available land. However, on-site generation rarely covers the full load of high-energy plants, especially those with refrigeration, thermal demand, or 24-hour operation. That is why many companies combine on-site generation with utility green tariffs, virtual power purchase agreements, or renewable energy certificates where appropriate. In states with favorable interconnection and incentive structures, such as parts of California, Texas, and the Carolinas, economics may be compelling. In other areas, grid mix and tariff design matter more than solar radiation alone. Manufacturing capability also influences project success. A capital partner that understands the realities of tanks, CIP systems, cooking vessels, utility skids, process water systems, and packaged utility infrastructure can design renewable integration without creating sanitation or maintenance headaches. DPS brings this kind of manufacturing perspective through its own equipment line, including storage and process tanks, custom CIP systems, marination tumblers, and cooking vessels, which helps connect equipment design with overall utility efficiency and plant expansion planning. Future trend: by 2026, more food manufacturers will pair on-site solar with energy management systems, refrigeration optimization, and utility submetering rather than viewing renewable power as a standalone project. The plants that win economically will be those that align load shape, tariff exposure, and process scheduling. For most food companies, supply chain emissions are the largest long-term challenge. Ingredients, packaging, third-party manufacturing, and transportation can represent the majority of total corporate emissions. Yet this area is also where smart procurement can create durable reductions without waiting for full technology shifts inside the plant. Start with supplier segmentation. High-volume categories such as corrugate, aluminum cans, PET preforms, glass, protein inputs, edible oils, dairy solids, and sugar should receive the most attention. For imported ingredients moving through ports like Savannah, Newark, Long Beach, or Houston, lane design and modal choice can materially change footprint and cost. Offsets still have a role, but only after direct reduction and supplier action have been pursued. Buyers in 2026 are increasingly skeptical of low-quality offsets that are disconnected from operational progress. A better sequence is reduce, substitute, procure lower-carbon alternatives, then cover residuals with verifiable credits where needed. This table shows why buying advice is critical. A local supplier is not automatically lower carbon if process efficiency is poor or packaging is heavier. Likewise, offsets are not a substitute for line-item procurement work. The strongest U.S. programs use supply agreements, scorecards, and bid structures that reward measurable emissions reductions. Targets should be ambitious enough to matter but realistic enough to fund and execute. In 2026, many U.S. food companies are setting a combination of short-term operational targets and longer-term enterprise goals. A common structure is 20% to 35% reduction in Scope 1 and 2 intensity by 2030 from a recent base year, with category-based Scope 3 targets layered in for packaging, purchased goods, and freight. Reporting quality matters as much as the target itself. Investors and customers want to know whether reductions came from actual engineering improvements, renewable procurement, output changes, divestitures, or offsets. For plant leaders, the most useful dashboard is one that connects emissions to production, downtime, waste, and utility cost rather than treating sustainability as a separate reporting exercise. Service capability is central here. DPS operates across capital planning, feasibility, owner’s representation, project and program management, general contracting where licensed, turnkey installation, process integration, and commissioning. For manufacturers trying to move from carbon strategy to shovel-ready projects, that service mix helps bridge the gap between ESG commitments and the physical changes needed on the floor. Explanation: a reporting system only works if each metric has a clear owner and action path. A dashboard that no one uses in weekly operating review will not change emissions. A dashboard tied to capital planning, maintenance, and procurement decisions will. Consider a hypothetical U.S. beverage and food co-packing site near Dallas-Fort Worth serving Southern and Midwest distribution lanes. The facility runs blending, hot fill, cold fill, canning, CIP, boilers, compressed air, cooling towers, and warehousing. Leadership sets a long-term net-zero ambition after major retail customers begin requesting footprint data. Phase one starts with metering, production-normalized baselines, and controls review. The site finds that steam losses, oversized compressed air, poor condenser sequencing, and unnecessary night loads are inflating both cost and carbon. Phase two upgrades utility controls, adds VFDs, optimizes CIP recipes, and improves heat reclaim. Phase three installs rooftop and ground solar, signs a renewable power agreement for the balance of electricity, and redesigns packaging for two high-volume SKUs. Phase four focuses on supplier data and residual emissions. This type of transition mirrors what many U.S. facilities are discovering: net-zero is not a single technology purchase. It is a staged engineering and supply chain program. Companies that move fastest usually have one partner coordinating design, build, and execution so utility, process, and construction decisions stay aligned. You can review related project thinking and execution approaches through the DPS project portfolio at food and beverage case studies. Disruptive Process Solutions serves food and beverage manufacturers across the United States and Canada with a practical, profit-focused approach to capital projects. Rather than treating sustainability as an isolated objective, the company works to align throughput, utility performance, compliance, and project return. From a technology standpoint, DPS supports process engineering, mechanical and electrical design, plumbing, structural coordination, controls integration, PLC programming, automation, and SCADA, all of which can directly affect carbon intensity through better utility balancing, process control, and commissioning. This is especially useful for energy-heavy applications such as brewing, distillation, aseptic processing, retort systems, dairy, proteins, and high-sanitation food lines. From a manufacturing perspective, DPS also designs and supplies branded process equipment such as tanks, custom CIP systems, marination tumblers, and cooking vessels. That capability helps clients connect equipment specification to utility demand, sanitation requirements, and total operating cost instead of evaluating components in isolation. More on these solutions can be found through its process equipment capabilities. From a service standpoint, the firm’s Design Build Manage model combines planning, engineering, construction management, installation, integration, and owner-focused execution. For carbon reduction programs, that matters because emissions projects often fail in handoffs between concept, budget, procurement, and startup. You can learn more about its broader approach on the company overview page and its engineering and project services page. For U.S. manufacturers in markets like Texas, California, the Carolinas, the Midwest, and the Northeast, the value of this model is speed with accountability. A lean expert team can move from feasibility to installation while keeping long-term operating performance in focus. That is particularly relevant in 2026 as plants weigh decarbonization against expansion, automation, labor constraints, and margin pressure. What is the first step for a food facility that has never measured carbon?Start with a plant-level baseline for electricity, fuels, refrigerants, and production volume. Then identify the top three to five emission drivers before considering offsets or large renewable projects. Which industries usually have the highest carbon intensity?In U.S. food and beverage manufacturing, dairy, protein processing, distillation, brewing, frozen foods, and retort or aseptic operations often rank high because they combine thermal demand, refrigeration, sanitation, and packaging energy. Should we focus on Scope 1 and 2 before Scope 3?You should measure all material categories, but most facilities should execute Scope 1 and 2 projects first because they are easier to control directly. At the same time, packaging, ingredient sourcing, and freight data collection for Scope 3 should begin early. Are carbon offsets necessary?Not at the beginning. In 2026, buyers increasingly expect direct engineering reductions and stronger procurement practices first. Offsets are best reserved for residual emissions that cannot yet be removed economically or technically. Does on-site solar make sense for every plant?No. It depends on roof condition, load profile, state incentives, interconnection, tariff structure, and whether the plant runs mostly in daylight or around the clock. Energy efficiency usually comes first. How should we set reduction targets?Use a mix of absolute and intensity-based targets. Intensity targets are helpful for growing businesses because they account for changes in output, while absolute targets are useful for enterprise reporting and investor communication. What role does automation play in carbon reduction?A major one. Better controls, sequencing, setpoint logic, and production scheduling can lower steam, chilled water, compressed air, and electrical use without compromising food safety or throughput. How often should carbon data be updated?Monthly is best for utility and production data, quarterly for supplier coverage and project pipeline, and annually for full inventory verification and target resets. Can carbon projects also improve profitability?Yes. In many food facilities, the best projects reduce utility spend, improve uptime, stabilize process control, lower maintenance burden, and protect production capacity. That is why carbon planning should be treated as an operating and capital strategy, not just a reporting task. What should U.S. manufacturers expect beyond 2026?Expect tighter buyer scorecards, more supplier-specific emissions requests, stronger state-level disclosure pressure, more electrification pilots, wider use of renewable procurement, and greater preference for integrated engineering partners who can connect sustainability with real plant performance. -
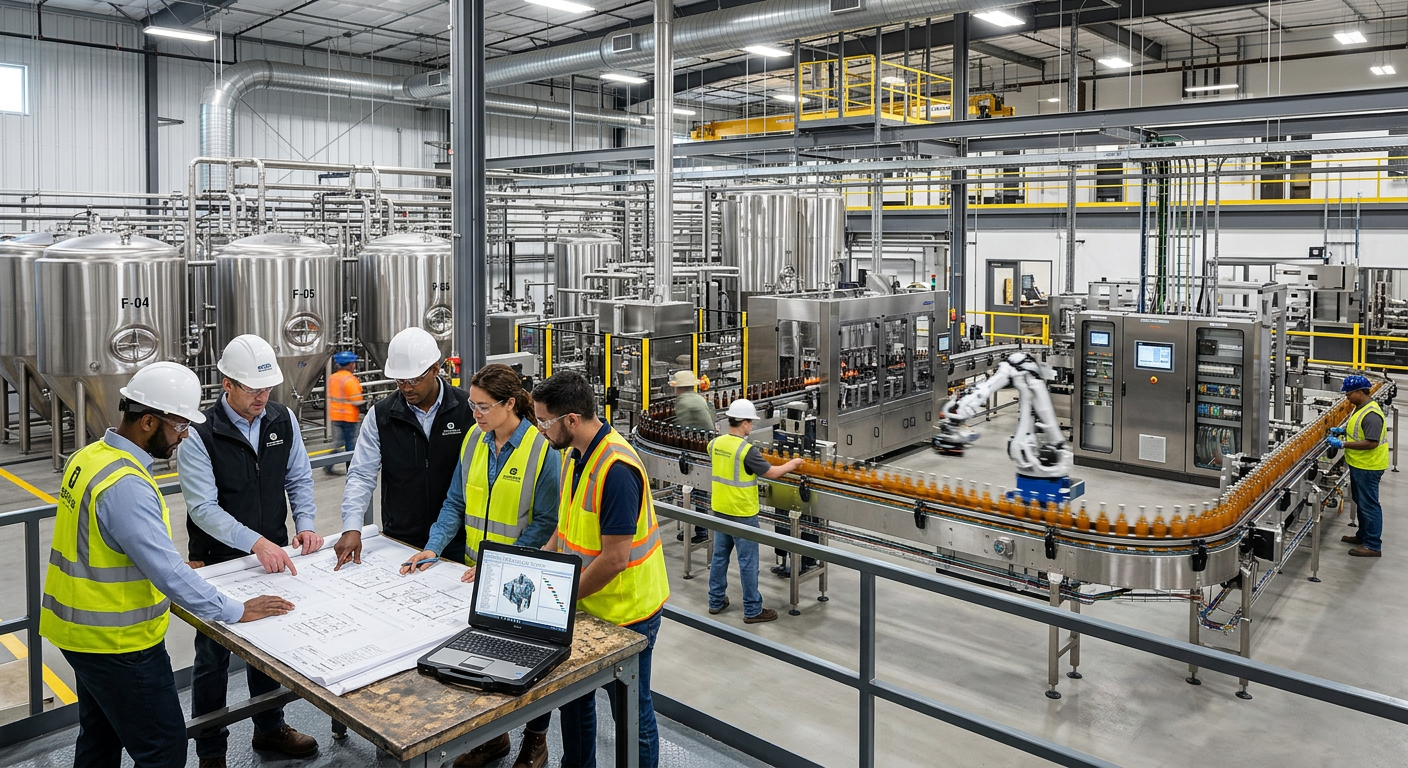
Food Facility Equipment Cleaning Procedures
Cleaning equipment in a food plant is not a housekeeping task. It is a controlled process that protects product quality, food safety, uptime, regulatory compliance, and plant profitability. In the United States, food and beverage manufacturers are expected to apply repeatable cleaning procedures that fit the product, soil type, equipment geometry, production schedule, and applicable standards such as FDA, USDA, SQF, and BRC requirements. A strong cleaning program typically combines clean-in-place systems for enclosed process lines, clean-out-of-place methods for removable parts, and documented manual sanitation for hard-to-reach surfaces, exteriors, and support areas. This guide explains how food facility equipment cleaning procedures should be designed and operated across U.S. manufacturing environments, from dairy plants in Wisconsin and cheese facilities in Idaho to beverage operations near Los Angeles, protein plants in Texas, and co-packing lines around Chicago, Atlanta, and New Jersey. It also covers buying considerations, product categories, industry applications, local sourcing realities, and future 2026 trends in automation, sustainability, and compliance. The best food equipment cleaning program in the United States uses the right method for each asset: CIP for enclosed tanks, piping, fillers, heat exchangers, and process loops; COP for removable machine parts, utensils, screens, and fittings; and manual cleaning for conveyors, external frames, environmental surfaces, and specialty components. Effective procedures define the complete sequence: pre-rinse, wash, intermediate rinse if required, sanitize, final drain or air purge, inspection, and release back to production. At a minimum, every cleaning program should answer eight operational questions: The practical buying advice for U.S. plants is simple: choose cleaning systems as part of the full process design, not as an afterthought. If a facility is adding a syrup room near Charlotte, a dairy skid in California, or a ready-to-drink beverage line close to the Port of Houston, the hygienic design of tanks, valves, dead legs, automation, and utilities will determine whether cleaning is fast and verifiable or expensive and inconsistent. Poorly designed systems consume excess water, caustic, labor, and production time. From a market standpoint, cleaning technology investment in the United States continues to rise because manufacturers are under pressure to reduce changeover times, improve audit performance, lower water and chemical usage, and support more product variety. That trend is especially visible in high-mix categories such as sauces, dairy beverages, nutritional drinks, spirits, plant-based proteins, and co-packed products. The chart above illustrates a realistic growth pattern in sanitation system investment. The rise is driven by stricter customer expectations, labor shortages, environmental targets, and the need for higher throughput with fewer sanitation failures. In major trade corridors such as the Midwest dairy belt, the Southeast beverage corridor, and Gulf Coast protein distribution hubs, these factors are reshaping how facilities specify equipment. Clean-in-place is the preferred method for enclosed product-contact systems that can be cleaned without full disassembly. In U.S. food and beverage manufacturing, CIP is commonly used for storage tanks, blending vessels, pasteurizers, aseptic loops, piping networks, fillers, homogenizers, pumps, plate heat exchangers, and valve manifolds. A well-designed CIP system reduces labor, improves consistency, and supports tighter production scheduling. The design basis starts with the product portfolio. A juice operation in Florida will face different soil removal challenges than a yogurt plant in Minnesota, a brewery in Colorado, or a prepared foods line near Dallas. Sugars may require strong rinsing and biofilm control, dairy systems may need strong caustic and periodic acid descaling, and protein applications often require special attention to fats, denatured proteins, and allergen carryover. Core CIP design elements include: Typical CIP sequence in a U.S. processing plant: Plants selecting a new system should evaluate whether a single-use, multi-use, or matrix CIP architecture makes the most sense. A small batch sauce plant may prefer a simpler skid, while a large beverage site near the Port of Savannah or Inland Empire distribution network may justify central CIP with multiple circuits, recipe control, and utility integration. When engineering projects involve new tanks, utility skids, or integrated process systems, cleaning should be considered alongside mechanical and controls design. Companies that specialize in full process integration often deliver stronger results because they can coordinate piping slopes, valve selection, automation, and commissioning from the start. For example, manufacturers evaluating broader process planning can review integrated engineering and project delivery services to see how sanitary design, utilities, and execution align. Industry demand for advanced CIP is highest in categories with frequent SKU changes, high audit pressure, and large utility loads. This comparison reflects a practical U.S. reality: aseptic and dairy operations usually require the most rigorous and instrumented CIP performance, while brewing, sauces, and plant-based systems still need robust cleaning but may vary more widely by product mix and line design. Clean-out-of-place cleaning applies to parts removed from equipment for separate washing and sanitizing. This method is standard for gaskets, clamps, screens, nozzles, fillers, valves, pump components, small utensils, and change parts. COP often supports packaging lines, meat and poultry equipment, bakery systems, and any process that uses removable product-contact components. Good COP methodology depends on flow discipline. Parts should move through a controlled path: removal, segregation, pre-scrape, wash, rinse, sanitize, dry, inspect, and protected storage. The biggest risks are mixed parts, trapped soil in crevices, and recontamination after cleaning. COP equipment selection should fit the production scale. A small condiment plant may use manual sinks and part racks, while a high-throughput protein facility in Nebraska may require dedicated COP tanks with agitation, heating, timed cycles, and specialized drying racks. Facilities handling allergen changeovers should also consider physical segregation and documented line-clearance steps. For processors planning capital upgrades, the best product choices are those designed for easy part removal, minimal crevices, and repeatable reassembly. This is especially important in slicers, fillers, depositor heads, pump carts, marination systems, and blending accessories. A review of sanitary process equipment options can help buyers compare how cleanability, access, and utility integration affect total cost of ownership. In the U.S. market, COP remains highly relevant in meat, poultry, prepared foods, and co-packing environments because many machine elements are not practical to clean entirely in place. Even plants with sophisticated CIP still rely on COP rooms as part of a complete hygiene strategy. Manual cleaning is still essential in almost every food facility. Conveyors, framework, exteriors of tanks, floor drains, forklifts in low-risk areas, walls, hose stations, and auxiliary tools often require direct operator cleaning. Manual procedures are also critical during maintenance work, changeovers, startup after shutdowns, and emergency corrective sanitation. Strong manual cleaning procedures should be written as work instructions, not vague statements. “Clean thoroughly” is not enough. Operators need specific instructions covering lockout and tagout, chemical PPE, tool selection, sequence, contact time, inspection points, and release criteria. In U.S. audits, weak manual SOPs are a common cause of inconsistency because results depend too heavily on individual habits. A reliable manual sanitation protocol often includes: Application choices vary by industry. Dry seasoning plants may avoid water in some zones. High-moisture ready meal operations may use foam and rinse. Bakeries often require careful flour dust management. Distilleries and breweries may emphasize floor sanitation around drains and trench systems. A facility near Seattle with beverage filling lines may prioritize filler exteriors and package-contact surfaces, while a poultry operation in Arkansas may focus on environmental control, overheads, and framework sanitation. Manual cleaning also matters during buying decisions. Equipment that needs excessive manual scrubbing will usually cost more over time than hygienically designed equipment with better access, fewer fasteners, and smoother product-contact transitions. Plants should ask suppliers for documented cleanability features, disassembly times, and recommended sanitation labor per shift before purchasing. Chemical selection should never be based only on supplier habit or lowest price. The correct detergent and sanitizer depend on product soil, water hardness, equipment metallurgy, elastomer compatibility, environmental discharge constraints, temperature range, and sanitation method. In the United States, common programs involve alkaline detergents, acid cleaners, oxidizing sanitizers, quaternary ammonium compounds, and specialty enzyme or solvent-based products for specific soils. As a general rule: The table below shows typical U.S. selection logic. Concentration control is where many plants lose consistency. Under-dosing causes cleaning failures and over-dosing wastes money while increasing corrosion and rinse load. Automated dosing with conductivity feedback is increasingly common, especially in larger U.S. plants serving national retail chains. By 2026, more facilities are expected to combine chemical concentration monitoring with cloud-connected sanitation records, utility tracking, and predictive alerts for drift. The trend shift is already visible: plants are moving from manual guesswork toward instrumented, data-backed sanitation control. This area chart represents a practical adoption curve across food and beverage segments in the United States. The upward movement reflects both labor pressure and stronger customer expectations for traceability. Sustainability also plays a role because better concentration control lowers excess chemical discharge and unnecessary rinse water consumption. Validation asks whether the cleaning procedure is capable of achieving the required result. Verification asks whether it is actually doing so in day-to-day operation. U.S. processors need both. A cleaning procedure may look good on paper but fail in practice if temperatures drift, operators shorten contact times, or a new product changes the soil challenge. Validation is typically performed when a plant launches a new line, introduces a new allergen profile, changes chemistry, modifies equipment, or revises cleaning frequency. Verification happens continuously through routine checks. Together they provide evidence for internal quality teams, customer audits, and regulatory expectations. Common validation and verification tools include visual inspection, ATP testing, microbial swabs, allergen-specific assays, rinse conductivity, pH checks, titration, and review of automated CIP records. In higher-risk or aseptic operations, plants may also use more advanced microbiological methods or hold-time studies. Buying advice for validation systems is often overlooked. If a plant is investing in a new process skid, it should ask whether the automation package can store cycle data, flag deviations, and export reports. Those features save significant time during investigations and audits. The same applies to utility design: stable hot water, steam, process water, and compressed air systems strongly influence sanitation repeatability. Plants with integrated process partners often benefit because the same team can align equipment design, controls, utility balancing, and commissioning protocols. Manufacturers interested in examples of end-to-end execution can explore project case studies in food and beverage facilities to see how validation readiness is built into real installations. The comparison chart below shows how buyers often evaluate supplier or system options when selecting sanitation-capable equipment and integrated cleaning solutions. This comparison reflects a realistic U.S. buying pattern. Plants increasingly prioritize documentation, service support, and scalability in addition to pure equipment performance. That is especially true for expanding co-packers and multi-line manufacturers that need systems capable of supporting future SKUs, stronger audit programs, and regional expansion. Cleaning frequency should be risk-based, product-based, and operationally realistic. Some systems need cleaning every shift. Others may run in validated campaigns for multiple days before a full sanitation cycle. The wrong frequency either increases risk or destroys production efficiency. In U.S. facilities, the best scheduling model connects sanitation to production planning. That means considering SKU sequence, allergen matrix, sugar load, product viscosity, protein fouling, hold times, and downstream packaging requirements. For example, running non-allergen products before allergen-containing products may reduce full wash frequency. Grouping products by color, flavor intensity, or Brix can also minimize changeover loss in beverage plants. The schedule below illustrates a practical framework. Production timing is especially important in ports, distribution hubs, and major manufacturing corridors where throughput commitments are tight. Plants shipping through the Port of Long Beach, the Port of Newark, or central freight hubs like Memphis and Kansas City often plan sanitation windows around carrier schedules and retailer delivery cutoffs. In those environments, minutes matter. A CIP system that consistently saves 20 to 30 minutes per cycle can create significant annual capacity gains. By 2026, scheduling practices are expected to improve through broader use of digital production planning, SCADA-linked sanitation recipes, utility load forecasting, and predictive maintenance alerts. Facilities aiming for water reduction goals will also increasingly schedule rinse recovery and low-load cleaning windows to flatten utility peaks. Documentation is the backbone of a defensible sanitation program. In the United States, records may be reviewed by internal quality teams, customers, certification bodies, or regulators depending on the product and plant category. Incomplete records make even good cleaning programs difficult to defend. At minimum, plants should maintain current sanitation SOPs, SSOPs where applicable, master sanitation schedules, chemical usage instructions, safety data references, pre-op inspection records, ATP and allergen verification records, CIP printouts or electronic logs, deviation reports, corrective actions, and training records. Good documentation also supports business performance. When sanitation deviations are trended properly, plants can identify repeat failures linked to chemistry, staffing, utility instability, poor equipment design, or production scheduling pressure. That insight often leads directly to capital improvements. Recommended documentation structure: Many U.S. manufacturers are now moving from paper logs to electronic systems tied to PLCs, SCADA, and plant dashboards. The transition is especially common in multi-site enterprises, large co-packers, and beverage networks where central management wants comparable sanitation data across facilities. Digital records also support sustainability reporting by linking sanitation cycles to water, steam, and chemical consumption. Disruptive Process Solutions, often known as DPS, supports food and beverage manufacturers across the United States and Canada with engineering-led project execution. The company is based in Cary, North Carolina, with a West Coast presence in Lake Forest, California, and works with processors from emerging regional operations to large enterprise networks. From a technological capability standpoint, DPS brings together process engineering, mechanical design, controls, PLC programming, SCADA integration, utility infrastructure planning, and sanitary system design. That matters for cleaning performance because CIP, COP support spaces, and manual sanitation outcomes depend on much more than chemical choice alone. Piping geometry, valve arrangement, automation logic, thermal systems, process water, compressed air, and recovery strategy all shape the final result. Companies looking for background on the team and approach can visit the DPS company overview. From a manufacturing capability standpoint, DPS also supports custom process equipment, including tanks, custom CIP systems, marination tumblers, and cooking vessels. For a manufacturer building or expanding a facility, that integrated perspective can reduce the disconnect that often happens between the process design team, the equipment supplier, and the installation contractor. In sanitation-sensitive applications, this is valuable because cleanability is strongest when equipment fabrication and process integration are planned together. From a service capability standpoint, DPS operates through an end-to-end model that covers feasibility, capital planning, process design, owner representation, project management, equipment supply, installation, integration, and commissioning. In practical terms, that means a plant evaluating a new beverage line, dairy expansion, protein processing upgrade, or aseptic utility buildout can align project goals with hygienic design and long-term operating profitability from the beginning. This business-first mindset is especially useful for facilities that need sanitation systems to support both compliance and capacity growth. The company serves a wide range of industries including brewing, spirits, wine, kombucha, ready-to-drink beverages, juices, dairy, sauces, proteins, prepared foods, plant-based products, and aseptic applications. For cleaning programs, that range matters because each category has distinct soil profiles, validation expectations, and utility needs. A partner familiar with multiple sectors can often identify opportunities a single-industry supplier may miss. What is the difference between CIP and COP?CIP cleans enclosed systems in place without full disassembly, while COP cleans removable parts in a separate wash area. Most U.S. food plants need both. How often should food equipment be cleaned?Frequency depends on the product, risk level, allergen profile, regulatory expectations, and validated operating window. Some assets are cleaned every shift, others daily, and some on campaign schedules with documented limits. Can sanitation chemicals be standardized across the whole plant?Sometimes partially, but not always. A single plant may need different chemistries for dairy fouling, mineral scale, environmental foam cleaning, and allergen changeovers. Standardization helps purchasing and training, but it must not weaken cleaning effectiveness. What is the best way to verify cleaning?Use layered verification: visual inspection first, then ATP, allergen testing, micro checks, or automated CIP parameter review depending on the hazard and process. No single verification method is enough for every situation. What records should be kept for audits?Maintain sanitation SOPs, master schedules, CIP logs, chemical checks, pre-op inspections, verification results, corrective actions, and training records. Electronic logs are increasingly preferred because they improve traceability. How important is equipment design to sanitation performance?It is critical. Hygienic design affects drainability, cleanability, labor demand, chemical use, and downtime. A poorly designed system will remain expensive to clean even with good operators and strong chemicals. What U.S. industries rely most on advanced cleaning procedures?Dairy, aseptic beverages, ready-to-drink products, sauces, brewing, protein processing, and co-packing operations typically place the highest demands on cleaning design, validation, and recordkeeping. What trends should plants prepare for in 2026?Expect stronger use of automated concentration control, recipe-driven sanitation, digital records, water reuse planning, energy tracking, cleaner chemical formulations, and closer alignment between ESG targets and sanitation engineering. When should a plant upgrade its cleaning system?Typical triggers include repeated sanitation deviations, long changeovers, high water or chemical costs, new allergen introductions, production expansion, or a major equipment replacement project. How should buyers evaluate suppliers?Look beyond price. Compare hygienic design quality, validation support, automation depth, utility efficiency, documentation, installation capability, startup support, and long-term service alignment. In summary, effective food facility equipment cleaning procedures in the United States depend on matching the method to the asset, validating performance, documenting every critical step, and designing systems that support both food safety and profitability. Plants that integrate sanitation into process engineering from the start are usually the ones that achieve better uptime, lower utility use, stronger audits, and faster growth. -
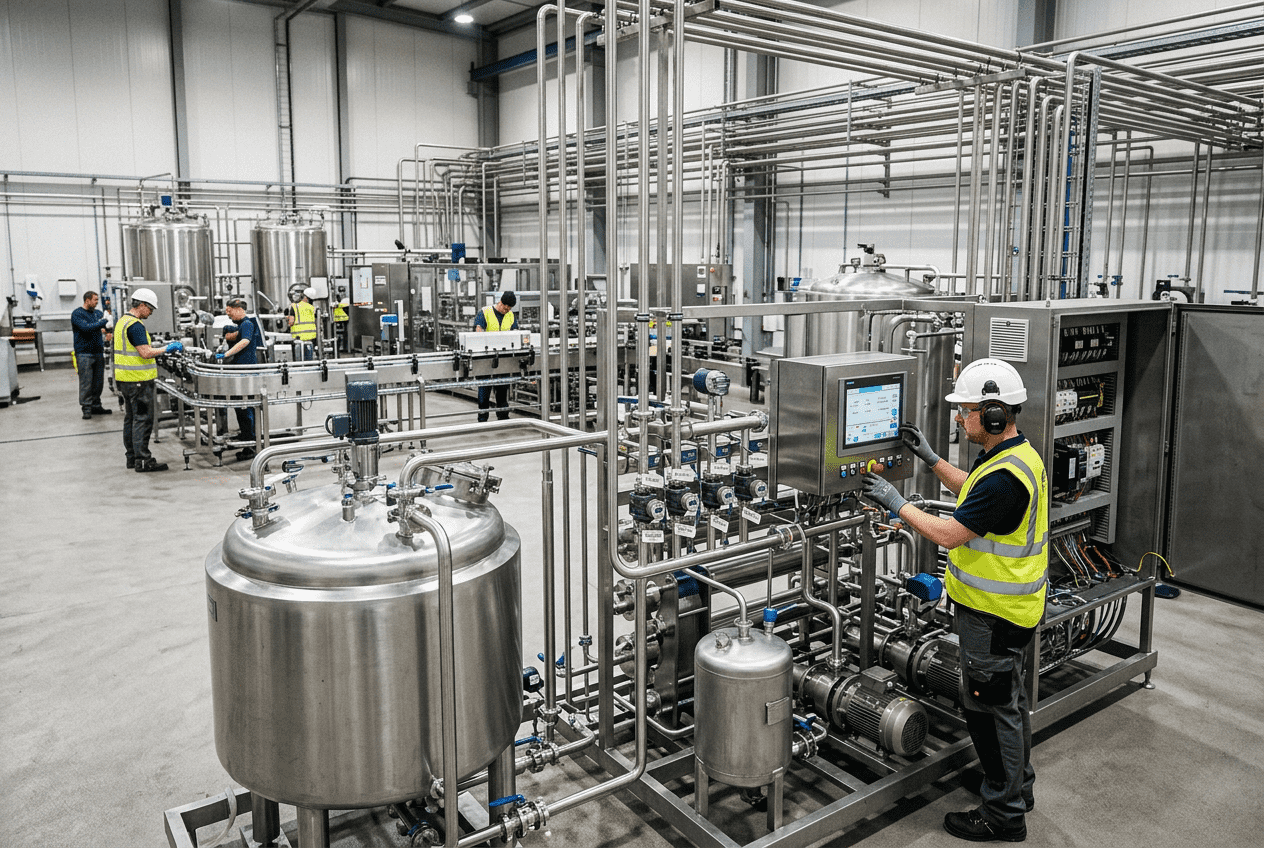
2026 Food Plant Energy Efficiency Audit: A Complete Guide
Food manufacturers in the United States are under pressure from every direction at once: higher utility rates, tighter margins, labor constraints, aging infrastructure, retailer sustainability demands, and increased scrutiny on water, refrigeration, steam, compressed air, and overall plant efficiency. In that environment, an energy efficiency audit is no longer just a maintenance exercise. It is a capital planning tool, an operations tool, and a profitability tool. For plants in major manufacturing corridors such as the Midwest, the Southeast, Texas, California’s Central Valley, the Carolinas, and logistics hubs connected to Chicago, Dallas, Atlanta, Los Angeles, Savannah, and Houston, energy consumption patterns directly shape production cost per pound, per case, or per gallon. The best audits do not stop at finding waste. They prioritize the fixes, connect them to production realities, and create an implementation path the plant can actually execute. This guide explains what a food plant energy efficiency audit covers, which systems matter most, where losses commonly hide, what deliverables a useful audit should include, and how manufacturers can move from assessment to measurable action. An energy efficiency audit for a food plant is a structured review of how a facility uses electricity, steam, gas, refrigeration, water, compressed air, and process utilities. The goal is to identify waste, rank improvement projects by payback and operational impact, and produce a practical roadmap for implementation. In U.S. food and beverage manufacturing, the most valuable audits go beyond utility benchmarking. They tie energy use to throughput, sanitation demands, uptime, product quality, regulatory compliance, and expansion plans. For most facilities, the highest-return opportunities are found in refrigeration optimization, boiler and steam improvements, compressed air leak reduction, heat recovery, HVAC balancing, CIP cycle tuning, motor and VFD upgrades, controls programming, and production scheduling alignment. A strong audit can uncover savings in the 10% to 30% range, with some projects paying back in less than 12 months and broader plant modernization delivering value over 12 to 36 months. The table above shows why a plant-wide review should be grounded in both utility data and process reality. A refrigeration issue may be an energy problem, but it may also be a throughput or product quality problem. Likewise, compressed air waste may stem from equipment selection, not only leaks. An energy efficiency audit is a data-backed evaluation of how a food manufacturing facility consumes and loses energy across production, sanitation, storage, packaging, and support systems. In practical terms, it combines utility bill analysis, field observations, equipment review, metering, control logic assessment, operator interviews, and financial modeling. In food plants, the audit must be more detailed than in many other industrial settings because process loads vary sharply by product type. A poultry facility has very different thermal and refrigeration demands than a dairy processor, a sauce plant, an aseptic beverage operation, or a ready-to-eat meal producer. Cleaning cycles, washdown frequency, cold chain requirements, retort scheduling, batching patterns, and sanitation windows all affect the energy profile. A useful audit generally answers five business questions: For U.S. manufacturers, energy audits are also increasingly tied to environmental reporting, Scope 1 and Scope 2 reduction goals, utility incentive programs, and site resilience planning. Plants near major utility service territories in California, Texas, the Mid-Atlantic, and the Northeast often find that audit-quality documentation supports rebate applications and internal capital approvals. This comparison matters because many plants do not need the same level of study every time. A site with strong metering and clear pain points may benefit from a targeted refrigeration or steam audit. A multi-line facility planning expansion often needs a broader review that ties utilities to capacity, maintenance, and automation. The most important systems in a U.S. food plant audit are usually refrigeration, boilers and steam distribution, hot water generation, compressed air, HVAC, process heating and cooling, motors and drives, water systems, wastewater-related loads, lighting, and plant controls. Depending on the facility, the audit may also review CIP skids, pasteurization systems, retorts, glycol loops, cooling towers, conveyors, ovens, smokehouses, freezers, blast cells, and packaging lines. In cold-chain operations such as protein, seafood, dairy, frozen foods, and ready meals, refrigeration often dominates total electrical consumption. In thermal plants such as sauces, beverages, aseptic systems, retort operations, bakeries, and cooked proteins, steam and hot water may represent the biggest opportunity. In older facilities, controls and utility distribution losses can be as important as the equipment itself. The systems above are often interdependent. For example, a refrigeration compressor issue may be driven by loading dock infiltration, a freezer door sequence, or a sanitation-related air pressure imbalance. That is why system-by-system reviews are necessary, but cross-functional analysis is even more important. At the technical level, manufacturers often need engineering support across mechanical, process, electrical, plumbing, structural, and controls disciplines to convert audit findings into executable projects. Firms with process integration experience in utilities, automation, and production systems can close the gap between diagnosis and implementation more effectively than consultants who only deliver reports. Food plants lose energy in predictable places, but the cost impact varies by product, shift pattern, sanitation protocol, and climate zone. Facilities in humid regions like the Southeast often battle HVAC and latent load issues. Facilities in the Upper Midwest may have heavy winter heating losses and aging steam systems. Plants in California and Texas may see high electrical demand charges driven by refrigeration, compressed air, or cooling systems. Below are the most common loss areas seen across U.S. food and beverage facilities: Plants often underestimate “hidden” waste because it does not appear as a production failure. A line still runs, a room still cools, and a boiler still makes steam. Yet utility spend rises every month. A good audit quantifies these losses in dollars, not just in engineering terms. In many food plants, production schedules themselves create avoidable waste. Utilities are often kept fully online during sanitation changeovers, weekends, or partial staffing periods. Demand spikes may be caused by multiple process starts hitting at the same time. Sequencing production to reduce peak utility overlap can create savings without major capital spending. The line chart illustrates the steady rise in spending on energy optimization and utility modernization in the U.S. food manufacturing sector. This growth is being driven by utility inflation, decarbonization goals, digital monitoring, and the need to keep older facilities competitive against greenfield sites. A high-quality audit follows a structured process. It starts before the site visit, continues through fieldwork and data validation, and ends with decision-ready recommendations. The best deliverables are practical, not academic. Plant leaders should be able to use them for capital requests, maintenance planning, and execution scheduling. A typical methodology includes utility bill review for 12 to 24 months, load profiling where data exists, process mapping, equipment inventory, field inspections, operator and maintenance interviews, temporary metering if needed, control sequence review, and financial modeling. In complex facilities, auditors also examine how process changes affect utility peaks and base loads. Deliverables should include at least the following: For manufacturers evaluating broader engineering or integration work, it is helpful when the audit provider can also support process engineering and project execution services after the report is issued. That continuity reduces the risk of good recommendations sitting on a shelf because no one owns the next step. Most food plants should not treat all audit findings equally. The smartest approach is to organize recommendations into three buckets: quick wins, mid-range upgrades, and strategic capital projects. That creates momentum while preserving focus on the larger utility and process changes that may require engineering, procurement, controls work, shutdown planning, or phased construction. Quick wins typically include leak repairs, insulation fixes, steam trap replacement, lighting controls, sensor calibration, basic programming changes, and scheduling improvements. Mid-range projects often include VFD installations, compressor sequencing, condenser fan optimization, CIP modifications, heat recovery, or hot water improvements. Strategic projects may involve refrigeration architecture changes, boiler plant modernization, plantwide automation upgrades, utility redistribution, or expansion-driven redesign. This framework helps plant leaders sequence investments in a way that supports both near-term savings and long-term competitiveness. It also improves communication with finance teams that want to understand why one project should move before another. The bar chart shows where demand for plant energy audits is especially strong in 2026. Protein, dairy, frozen foods, and prepared foods tend to show the greatest need because they combine intensive utility use with strict quality and sanitation requirements. Consider a hypothetical but realistic U.S. prepared foods plant near a major Southeastern distribution corridor serving Atlanta, Charlotte, and Jacksonville. The facility operates two cooking lines, one packaging hall, multiple chilled rooms, and a central utility area with steam, compressed air, refrigeration, and CIP. Leadership originally believed a major utility expansion was necessary to support volume growth. During the audit, several findings emerged: Instead of moving directly into a high-cost equipment addition, the plant implemented staged corrections. Controls were adjusted, leaking air points were repaired, trap replacements were bundled with insulation work, CIP logic was retuned, and refrigeration sequencing was updated. The result was an overall energy reduction of roughly 30%, with a substantial share delivered before any major capital project began. The bigger lesson is that energy reduction often comes from engineering clarity, not only from buying new hardware. Some of the highest-value improvements happen when controls, utilities, and process operations are treated as one system. The area chart reflects a major 2026 trend: more energy savings are coming from controls, sequencing, data visibility, and automation rather than only from equipment replacement. Plants that can trend utility performance through PLC and SCADA systems are better positioned to sustain savings over time. Many audit providers are strong at finding problems but not set up to deliver the fix. That is where an integrated engineering and execution model becomes valuable. Disruptive Process Solutions supports food and beverage manufacturers across the United States and Canada with an approach designed to move from concept to field execution without losing business focus. On the technology side, DPS brings multi-discipline engineering that includes process, mechanical, plumbing, electrical, structural, and controls capabilities. That matters when an energy audit touches refrigeration, steam, utilities, automation, SCADA visibility, PLC programming, heat transfer, and system integration at the same time. In many food plants, the energy issue is not isolated to one asset. It sits at the intersection of process design, controls logic, and utility infrastructure. On the manufacturing side, DPS works across a broad set of food and beverage applications, including protein processing, prepared foods, dairy, aseptic systems, sauces, beverages, fermentation, distillation, and co-packing environments. That cross-sector experience is important because each product family has a distinct load profile. A retort-heavy operation, a cold-fill beverage line, and a marinated protein plant each require different recommendations to preserve product quality and compliance while reducing utility use. On the service side, DPS operates with an end-to-end model that combines planning, design, installation oversight, integration, and project management. For manufacturers that need more than a report, this can reduce handoff friction between engineering recommendations and field execution. Companies exploring broader plant optimization can learn more about DPS capabilities through its company overview, its service offerings, and selected project case studies. DPS also supports the practical side of plant improvement by aligning recommendations with shutdown windows, contractor management, local trade coordination, equipment integration, and production priorities. Where utility upgrades require custom skids, tanks, or process components, manufacturers may also benefit from reviewing available process equipment capabilities that can be integrated into broader plant improvements. The real differentiator in audit-to-action work is not simply identifying waste. It is building a realistic path to remove it while protecting output, quality, food safety, and return on capital. The comparison chart highlights an important buying consideration for U.S. manufacturers: finding opportunities is only one part of the value chain. Plants usually benefit more from partners that can connect energy analysis with process engineering, controls work, construction management, and implementation planning. Disruptive Process Solutions is a North American food and beverage engineering company focused on profitable capital execution for manufacturers that want practical, business-driven outcomes. Headquartered in Cary, North Carolina, with a West Coast presence in Lake Forest, California, DPS works with clients across all 50 states and Canada. The company supports projects ranging from targeted utility and process improvements to full system integration, relocation, expansion, and greenfield development. Its work spans both food and beverage, including brewing, spirits, dairy, ready-to-drink products, protein processing, sauces, prepared foods, and aseptic applications. That breadth helps the team recognize where utility waste is tied to process design, scheduling, sanitation logic, or plant layout rather than just equipment age. DPS is especially relevant to manufacturers that want an engineering partner able to move from assessment into design-build-manage execution. For plants facing energy inflation, capacity constraints, utility bottlenecks, or aging infrastructure, that continuity can be the difference between a report that sits idle and a project that delivers measurable savings. An energy efficiency audit should not be viewed as a one-time compliance document or a narrow utility exercise. In the U.S. food industry, it is increasingly a foundation for cost control, production resilience, capital discipline, and sustainable growth. As 2026 approaches, the winning plants will be those that treat energy performance as part of core manufacturing strategy, not just overhead management. Whether the plant is located near Midwest protein corridors, California beverage clusters, Gulf Coast export channels, or fast-growing Southeastern manufacturing hubs, the same principle applies: the best savings come from understanding how utilities, process systems, controls, maintenance, and business goals work together. When that understanding is backed by a clear roadmap, energy efficiency becomes a profit driver rather than a side initiative. -
Food Facility Storage Tank Design Standards
Food facility storage tank design in the United States is not just about holding product. It directly affects food safety, cleaning time, product shelf life, operator safety, utility consumption, and long term maintenance costs. Whether a plant is receiving milk in Wisconsin, blending sauces in Illinois, storing juice in California, fermenting beverages in North Carolina, or staging ingredients near the ports of Houston, Savannah, Newark, or Los Angeles and Long Beach, the same design principles matter: choose the right alloy, build for sanitary access, validate cleanability, size agitation correctly, confirm pressure and temperature limits, and align the vessel with FDA, USDA, 3-A, and ASME expectations where applicable. In the United States market, buyers are also balancing labor shortages, tighter audit expectations, sustainability goals, and future automation plans. As a result, modern food storage tank selection increasingly includes not only shell thickness and nozzle count, but also CIP coverage validation, digital instrumentation, recipe flexibility, and integration with upstream and downstream systems. For processors that expect to scale in regions such as Dallas, Atlanta, Chicago, Fresno, Seattle, Charlotte, and Minneapolis, a well designed tank platform can reduce total cost of ownership far more than a low first-cost vessel that creates sanitation or process bottlenecks later. The best food facility storage tank design standard for most United States applications is a sanitary stainless steel vessel engineered around the product, cleaning method, pressure and temperature needs, and regulatory environment of the plant. In practical terms, that usually means a 304 stainless tank for standard non-corrosive food products, a 316L stainless tank for acidic, salty, aggressive, or higher purity applications, interior finishes in the sanitary range with polished welds, full drainability, properly placed CIP spray devices, hygienic nozzles and manways, and documented fabrication quality. If the vessel will run under pressure, vacuum, or jacketed heat transfer conditions, it should be engineered to the relevant ASME code section and stamped when required by jurisdiction or customer specification. For buyers, the biggest mistake is choosing a tank by capacity alone. A 5,000 gallon tank for dairy, brine, syrup, aseptic ingredients, or protein marinades may need completely different metallurgy, finish, slope, cleaning energy, agitation style, and controls. Tank design should follow the product path, not the catalog page. Across the United States, market demand is rising for tanks that support higher sanitation assurance, faster product changeovers, automation visibility, and lower water and chemical use. The chart below shows a realistic market growth trend for sanitary food and beverage tank projects tied to reshoring, capacity expansion, and co-packing growth. That growth is especially strong in beverage hubs, dairy regions, protein processing corridors, and co-manufacturing markets where flexible production has become a competitive advantage. Plants near major logistics routes often prioritize standardized tank skids and modular utility tie-ins to accelerate installation and qualification. Material selection is the foundation of food tank performance. In the United States, 304 stainless steel remains the most common choice for storage of water, many beverages, dry ingredient slurries, oils, and general food products that are not highly corrosive. It offers a strong balance of cost, corrosion resistance, weldability, and availability. For many processors, it is the right baseline material. 316L stainless steel becomes the better option when chloride exposure, acidic formulas, aggressive sanitation chemistry, salt heavy products, flavor concentrates, brines, cultured products, or high purity process streams increase corrosion risk. The lower carbon content of 316L also supports weld integrity and corrosion performance in sanitary fabrication. If a processor is handling tomato based products, saline marinades, citrus blends, or certain dairy ingredients cleaned with more aggressive CIP chemistry, 316L can reduce the long term risk of pitting, tea staining, and premature replacement. There is no universal rule that 316L is always required for better quality. Often, a mixed strategy is most cost effective, such as 316L on product-contact wetted surfaces and 304 on structural supports, jackets, ladders, or non-contact externals where appropriate. The correct answer depends on product chemistry, cleaning chemistry, temperature, dwell time, and the expected service life. The table shows why alloy choice should follow application, not habit. In many Midwest and Southeast plants, 304 is still fully appropriate. In coastal settings, export ingredient operations, or facilities handling saline and acidic products, 316L often pays for itself in avoided maintenance. Buyers should also ask for weld passivation practices, documentation of material traceability, and whether elastomers, gaskets, valve internals, and instruments match the chemistry of the process. For manufacturers evaluating larger capital programs, a partner with process engineering and fabrication insight can compare vessel metallurgy against full line conditions rather than tank-only assumptions. That matters when a tank is only one part of a broader blending, thermal processing, or CIP loop. A sanitary tank is not defined by stainless steel alone. Hygienic design depends on geometry, weld quality, drainage, internal finish, dead-leg control, gasket selection, access points, and cleanability under actual operating conditions. In food and beverage facilities across the United States, poor sanitary design often reveals itself as recurring swab failures, biofilm risk, flavor carryover, allergen concerns, excessive hand cleaning, or long CIP cycles that reduce production uptime. Good sanitary design starts with smooth product-contact surfaces and polished, ground, and blended welds where required by the process and customer specification. Interior finish expectations vary by product category, but many food applications target sanitary finishes in a range appropriate for product release and cleaning. The chosen finish should align with viscosity, fouling tendency, microbiological sensitivity, and regulatory expectations. For high-care or aseptic adjacent systems, tighter finish control becomes more important. Equally important is complete drainability. Tanks should be designed so product and cleaning solutions do not pool at the bottom head, nozzle stubs, agitator seals, or branch connections. Sloped bottoms, flush-mounted fittings where justified, properly oriented outlets, and minimized dead spaces all contribute to consistent sanitation performance. The table highlights that sanitary performance is the result of several design decisions working together. For example, a polished shell with poor outlet geometry can still trap product. Likewise, a beautifully fabricated vessel can become a sanitation problem if level sensors, sample valves, or instrument tees create stagnant pockets. This is why tank reviews should include the entire nozzle map and cleaning sequence. United States processors operating under SQF, BRCGS, FDA preventive controls, or USDA oversight increasingly document hygienic design decisions in capital justifications. This is especially common in dairy plants in the upper Midwest, protein facilities in Arkansas and Georgia, and beverage co-packers in California and Texas where product variety is high and downtime is costly. Clean-in-place design can make or break tank performance. A tank that is difficult to clean will consume more labor, more water, more chemicals, more steam, and more production time. In modern U.S. food plants, CIP design is expected to be engineered rather than improvised. That means calculating flow, impact, coverage, chemical concentration, return rates, and cleaning sequence based on soil load and vessel geometry. Static spray balls are common in relatively easy-to-clean tanks with lower soil loads and appropriate wetting requirements. Rotary spray heads or other dynamic cleaning devices are often preferred when soils are stubborn, viscosities are higher, tank diameters are larger, or cycle times must be reduced. The right choice depends on the product, fouling mechanism, target cycle length, and utility capacity. A larger tank does not automatically require a more aggressive device, but it often benefits from better validated spray coverage. Location is critical. Spray devices should be positioned to reach shadowed areas under agitators, around baffles, and near upper shell transitions. Return outlet sizing, venting, and the relationship between fill level and cleaning regime also matter. In many retrofit projects, tanks underperform during CIP not because the vessel is fundamentally wrong, but because spray device selection and piping hydraulics were never engineered together. The chart below compares demand by major industry segment in the United States for sanitary tanks with integrated CIP expectations. Beverage and dairy continue to lead, but sauces, ingredients, and protein liquids are growing quickly. Processors that need faster turnarounds often pair well-designed tanks with centralized CIP systems, conductivity monitoring, automated valve matrices, and SCADA visibility. This is one area where engineering, automation, and field installation quality must work as one system rather than separate scopes. Agitation should match the process objective. Storage is not always passive. Some products require suspension of particulates, temperature uniformity, foam control, blending of ingredients, gentle recirculation, or shear-sensitive handling. An oversized or poorly selected mixer can damage product, entrain air, increase energy use, and complicate cleaning. An undersized mixer can leave ingredients stratified, cause solids settlement, and create inconsistent batches. Top-entry agitators are common for blending and general liquid mixing. Side-entry mixers may work well in larger tanks where circulation patterns support the process. Sweep agitation can help with more viscous products. High-shear mixers are selected when emulsification or rapid powder incorporation is required, though they are not appropriate for every storage duty. Some tanks do not need built-in agitation at all and are better served by external recirculation loops if hygiene and process needs allow. When evaluating agitation, buyers should confirm viscosity range, batch size variability, solids content, desired turnover time, and whether the tank will perform more than one function. A storage-only vessel is different from a mix tank, blend tank, fermentation vessel, or hold tank feeding a filler. The table shows that mixer selection is a process decision, not just a mechanical accessory choice. It should account for future SKUs, not only current formulas. This is increasingly important in U.S. co-packing and contract manufacturing environments where a tank may handle several product families over its life. The chart below illustrates a realistic trend shift in tank specification priorities from 2022 through 2026. Sanitary cleanability and automation integration are gaining share relative to simple capacity-driven purchasing. Many food tanks are atmospheric, but many are not truly low-risk. Vacuum events during cooling, pump-out, or CIP can collapse a vessel that was never engineered for negative pressure. Likewise, a process that occasionally sees pressure spikes, carbonation, nitrogen blanketing, thermal expansion, or jacket heating may require more robust design than operators assume. United States buyers should clearly define both normal and upset conditions. The design basis should include product temperature, ambient temperature, CIP temperature, sterilization exposure where relevant, pressure and vacuum scenarios, jacket media, insulation loads, seismic or wind considerations where applicable, and transport or rigging requirements for delivery. Plants in California, the Pacific Northwest, and some Gulf Coast regions often have added structural or code considerations depending on local jurisdiction and installation environment. This table shows why pressure and temperature ratings must be discussed early. A tank that appears simple on the process flow diagram can become a code-driven asset once heat transfer, vacuum events, or pressure retaining components are included. Oversights here often lead to costly redesign after fabrication drawings are already underway. As 2026 approaches, sustainability and utility efficiency are shaping vessel design too. Better insulation strategies, lower water CIP recipes, heat recovery integration, smart valve feedback, and digital monitoring of cleaning performance are becoming standard in larger projects. Federal and state level focus on water use, wastewater loading, and energy intensity is pushing facilities to engineer tanks as part of a more efficient utility ecosystem rather than as isolated steel assets. Nozzle and access design has a major impact on sanitation, process reliability, and operator ergonomics. Inlets should promote desired flow patterns and avoid unnecessary splashing or foam. Outlets should fully drain, match pump suction needs, and avoid dead pockets. Instrument connections should be located for accurate readings while preserving cleanability. Manways should support safe access, inspection, and maintenance without compromising hygienic performance. For example, a center-bottom outlet may be best for complete drainage in one application, while an offset or flush style outlet may suit another depending on support structure and piping layout. Top inlets used for powder induction or liquid additions may require splash control, vortex management, and vent filtration. Level instruments should be selected based on foam, viscosity, buildup tendencies, and the need for washdown durability. Many tank problems originate at fittings. Oversized branch lengths, poor valve orientation, inaccessible sample points, and crowded nozzle clusters can all make a sanitary tank harder to clean and harder to maintain. Good design means every fitting has a process reason and a cleaning path. These details are especially important for multi-product sites and high audit environments. The most effective tank layouts are usually developed with input from sanitation, production, maintenance, quality, and controls teams rather than procurement alone. Food tank compliance in the United States is a layered topic. Depending on product, customer requirements, and installation conditions, a tank may need to align with FDA expectations for food-contact materials, USDA sanitation expectations in meat or poultry environments, state or local pressure vessel rules, 3-A sanitary principles, and ASME code requirements for pressure retaining components. Not every tank needs the same documentation, but every tank should have a clearly defined compliance basis. For sanitary food facilities, documentation often includes material certificates, weld maps, surface finish verification when specified, passivation records, pressure testing where applicable, and operating manuals. If the vessel falls under ASME pressure vessel code, stamp requirements and jurisdictional review become critical. Buyers should never assume a vendor’s use of “sanitary” or “food grade” automatically means the tank meets all applicable code or audit expectations. The chart below compares how buyers in the United States often rate supplier categories when choosing sanitary tanks. Engineering depth and compliance support increasingly matter as much as price. As policy and customer expectations evolve into 2026, traceability, water reduction, energy efficiency, hygienic validation, and automation data integrity are becoming stronger parts of purchasing specifications. Many national brands and sophisticated co-packers now expect equipment partners to support not just fabrication, but also quality documentation and system-level startup planning. When sourcing tanks, it is wise to compare regional suppliers, national integrators, and project-led engineering partners. Fabricators around Milwaukee, Chicago, the Carolinas, California’s Central Valley, and Texas each bring different strengths. Local sourcing may shorten freight or service response, while broader engineering partners may better support multi-state rollouts and integrated utility packages. The right choice depends on whether the plant needs a stand-alone vessel or a coordinated process system. Disruptive Process Solutions supports food and beverage manufacturers across the United States and Canada with an approach built around profitable project execution rather than equipment-only selling. For clients evaluating storage tanks and process vessels, that matters because the vessel is rarely the whole answer. Tank sizing, material choice, nozzle layout, utilities, controls, CIP, structural supports, and installation sequencing all affect whether the final system performs as intended. From a technological capability standpoint, DPS works across process, mechanical, electrical, plumbing, structural, and controls disciplines. That means a storage tank review can extend into automation logic, PLC programming, SCADA visibility, batch control, utility balancing, and line integration when needed. For beverage, dairy, sauces, proteins, aseptic support, fermentation, thermal processing, and water treatment applications, this broad engineering perspective helps clients avoid buying tanks that look correct on paper but create bottlenecks in the field. More about the company’s background and operating philosophy is available at DPS company overview. From a manufacturing capability standpoint, DPS also develops branded process equipment including storage and processing tanks up to 12,000 gallons, custom CIP systems, and other specialized food and beverage equipment. That gives clients access to practical fabrication insight while still keeping the focus on the total process. For companies comparing vessel options, the equipment portfolio can be explored through sanitary process equipment solutions. This manufacturing experience is especially useful where standard catalog tanks do not fit a specific product behavior, footprint, or utility constraint. From a service capability standpoint, DPS operates through a design-build-manage model that combines engineering, capital planning, owner’s representation, project management, general contracting where licensed, installation coordination, and system integration. For clients in growth markets such as Texas, North Carolina, California, or the Midwest, that end-to-end support can reduce handoff risk between designer, fabricator, and installer. Process and project support details are available at food and beverage engineering services, and examples of field execution can be seen in project case studies. For buyers, the practical takeaway is simple: choose a partner that can understand the process, the compliance environment, the installation reality, and the commercial goals of the plant. That is often more valuable than selecting the cheapest vessel quote in isolation. What is the most common stainless steel for food storage tanks in the United States?304 stainless steel is the most common baseline choice because it balances cost, corrosion resistance, and availability. However, 316L is often preferred for more corrosive, acidic, salty, or high-purity applications. When should I choose 316L instead of 304?Choose 316L when the product or cleaning chemistry raises the risk of corrosion, especially with chlorides, acids, or frequent aggressive CIP cycles. It is also a common choice where long service life and lower corrosion risk justify the higher material cost. Do all food tanks need ASME certification?No. Many tanks are atmospheric and do not require ASME pressure vessel stamping. But if the tank will operate under pressure, vacuum, or includes pressure-retaining jackets or other code-relevant features, ASME review may be necessary depending on design and jurisdiction. Are static spray balls enough for sanitary cleaning?Sometimes yes, especially for easier-to-clean products and smaller tanks. But higher soil loads, larger diameters, short cycle targets, and viscous products often justify rotary cleaning devices or more advanced CIP design. What surface finish is considered sanitary?There is no one universal finish for every food product. The correct sanitary finish depends on the product, fouling tendency, cleaning method, and customer or audit requirements. Buyers should specify the required interior finish and weld treatment rather than leaving it undefined. Should every tank have an agitator?No. Some tanks only need storage. Others need blending, suspension, temperature uniformity, or powder incorporation. The agitation method should be selected from process data, not assumptions. What are the biggest buying mistakes?The biggest mistakes are buying on gallon capacity alone, overlooking CIP coverage, ignoring vacuum conditions, underestimating corrosion risk, and failing to review nozzle layout and future product flexibility. How should I compare tank suppliers in the United States?Compare them on engineering depth, sanitary fabrication quality, compliance documentation, responsiveness during startup, installation coordination, and long-term serviceability, not just initial price and quoted lead time. What trends will shape tank design in 2026?Expect stronger emphasis on water-efficient CIP, energy recovery, digital cleaning verification, automation integration, hygienic validation, sustainability reporting, and more resilient domestic supply chains. What industries rely most on sanitary storage tanks?Beverage, dairy, sauces, dressings, ingredient processing, protein liquids, fermentation, functional beverages, and aseptic support systems are all major users in the United States. In summary, food facility storage tank design standards in the United States are moving toward more integrated, data-driven, and sanitation-focused solutions. The best tanks are not merely stainless containers; they are engineered assets designed for product quality, reliable cleaning, utility efficiency, audit readiness, and future plant growth. Whether the application is dairy in Wisconsin, beverage co-packing in North Carolina, protein processing in Texas, or ingredient storage near major coastal trade gateways, the right tank design starts with the process and ends with lifecycle performance. -
Beverage Plant PLC Programming
Beverage PLC programming is the control backbone that keeps a modern U.S. beverage plant running at high speed without sacrificing fill accuracy, product quality, sanitation, or packaging consistency. In practice, it connects conveyors, rinsers, rotary fillers, cappers, labelers, case packers, CIP systems, vision inspection, recipe management, and plant data systems into one coordinated operating platform. For manufacturers in markets such as Atlanta, Chicago, Dallas, Los Angeles, Charlotte, and New Jersey logistics corridors, good programming often delivers more throughput from existing assets before a major capital expansion is needed. For beverage producers, co-packers, and brand owners, the value is straightforward: tighter synchronization, fewer micro-stops, faster changeovers, better reject handling, clearer downtime visibility, and safer cleaning cycles. Whether the line is filling carbonated soft drinks, juices, dairy beverages, RTD cocktails, kombucha, spirits-based canned products, or aseptic drinks, the PLC logic determines how reliably the line performs under pressure. If you are asking what beverage plant PLC programming includes, the short answer is this: it is the engineering of machine control logic, motion coordination, safety interlocks, recipe control, process sequencing, line tracking, and plant data communication for beverage production and packaging systems. On high-speed lines in the United States, this usually covers bottle handling, rotary filling, cap application, label verification, reject systems, CIP automation, utility integration, alarms, historian data, and OEE reporting. The best programming work is not only about making equipment move. It is about making equipment move predictably at scale. A well-programmed line can help a facility in California, Texas, North Carolina, Wisconsin, or Pennsylvania raise output, protect quality, and lower cost per case. In many plants, the true bottleneck is not mechanical nameplate speed but the way the controls are tuned, sequenced, and integrated. The table above shows why PLC work matters beyond simple machine startup. In beverage operations, control architecture affects sanitation, labor efficiency, utility use, and customer service performance just as much as production speed. High-speed beverage production is a balancing act between precision and throughput. U.S. plants serving major retail networks through hubs like Savannah, Houston, Long Beach, and the Midwest distribution belt must hit aggressive production targets while still maintaining package quality and regulatory compliance. That requires programming that can manage fast transitions, changing line pressures, multiple SKUs, and operator intervention without destabilizing the process. Precision in this environment means more than accurate filling. It also means coordinated starts and stops, stable acceleration curves, anti-slosh transfer logic, timing windows for inspection, and repeatable response to faults. Throughput means the line keeps moving, not just in short bursts, but over an entire shift with minimal starved or blocked conditions. In beverage plants, line performance often depends on how control zones are divided. The depalletizer, empty bottle conveyor, rinser, filler, capper, labeler, packer, palletizer, and utilities must all communicate effectively. If one zone responds too aggressively or too slowly, the effect ripples downstream. Advanced PLC programming solves this with queue management, machine state models, fault recovery routines, and controlled accumulation strategies. Market demand in the United States continues to support investment in these upgrades. Growth in canned cocktails, functional beverages, premium water, sports drinks, and contract packaging has increased the need for flexible automation that can switch products quickly while preserving uptime. The line chart reflects a realistic direction for automation investment: steady growth driven by labor constraints, demand for traceability, sustainability targets, and higher packaging complexity. By 2026, many U.S. beverage sites will expect not only fast PLC control but also deeper integration with SCADA, energy monitoring, electronic batch records, and cybersecurity standards. This range shows why there is no one-size-fits-all controls template. Product characteristics, package format, utility quality, and sanitation regime all influence PLC design decisions. Bottle handling is often underestimated, yet it strongly influences total line performance. Air conveyors for empty PET bottles, neck handling systems, laning equipment, and accumulation tables must move containers quickly without scuffing, tipping, or generating unstable surges. The PLC typically coordinates blower demand, conveyor zoning, sensor validation, and machine permissives so bottles arrive at the filler consistently. For lightweight containers, air pressure control is critical. Too little pressure causes starvation; too much creates bottle collisions and fallen containers. Gentle transport requires tuning fan speed, damper positions, conveyor transitions, and back-pressure logic. In U.S. plants running mixed bottle formats for private label and branded products, these settings often need recipe-based automation so operators can switch formats without manual trial and error. Good programming also accounts for real-world plant conditions: humidity in Gulf Coast facilities, temperature swings in Midwest warehouses, or compressed air variability in older buildings. Sensors alone do not solve these problems. The control strategy must filter noise, detect unstable flow, and trigger corrections before jams spread to the filler. The explanation here is practical: bottle handling controls are where many “mystery” downtime losses originate. What looks like a filler issue is often a pressure balance or transition tuning issue upstream. Rotary fillers are the heartbeat of many beverage lines. Programming them requires tight synchronization between turret rotation, infeed timing, valve lift, flow control, snift operations, purge cycles, and container presence verification. Whether a filler has 12 heads on a craft line or 72 heads on a high-capacity commercial line, the control system must keep every station aligned with product and package conditions. Electronic synchronization replaces much of the guesswork that older mechanical systems relied on. Servo coordination, encoder feedback, phase monitoring, and high-speed I/O allow the PLC and associated motion controllers to react in milliseconds. This matters greatly for carbonated products where pressure management influences foam, fill level, and cap-on-foam performance. Programming logic also needs recipe intelligence. A juice line, a sports drink line, and an RTD cocktail line may use the same physical filler but require different parameters for fill volumes, purge times, valve timing, and sanitation sequences. A robust control platform stores these values securely, validates access, and logs changes for quality and compliance purposes. For plants near major co-packing centers such as Dallas-Fort Worth, Indianapolis, or central Florida, filler flexibility can be the difference between winning and losing customer contracts. The more SKUs and container formats a line can run with stable performance, the more commercially valuable the operation becomes. Capping and labeling are where mechanical movement meets packaging compliance. A bottle can be filled perfectly and still become unsellable if the cap is cross-threaded, the tamper band is damaged, or the label is skewed. PLC programming in this area links torque monitoring, cap chute permissives, no-bottle-no-cap logic, vision systems, and reject devices into a fast and reliable control sequence. Vision integration is increasingly standard in the United States. Retail requirements and brand expectations demand verification of cap presence, label presence, date code readability, lot code location, and in some cases barcode correctness. The PLC must receive inspection results, track the product position, and activate the proper reject device at exactly the right moment. If that timing slips, good bottles get rejected or bad bottles pass through. Rejection system design varies by speed and package type. Air blast rejectors may work for lightweight empty containers, but full bottles often require pushers, sweep arms, drop gates, or diverters. The logic must include reject confirmation, bin full alarms, and escalation handling if rejected product fails to leave the conveyor. The bar chart highlights where demand is strongest for advanced packaging inspection. RTD alcohol and functional beverages often lead because packaging variation, premium branding, and regulatory scrutiny tend to be higher. This packaging control layer directly supports brand protection, customer compliance, and waste reduction. It is one of the clearest examples of why controls engineering is a profit driver, not just an engineering cost. CIP programming is one of the most important disciplines in beverage automation because it sits at the intersection of food safety, utility cost, uptime, and changeover planning. A CIP system must execute rinse, caustic wash, intermediate rinse, acid cycle when required, sanitize steps, conductivity verification, temperature confirmation, flow validation, and solution recovery with minimal operator error. In real plants, CIP logic often touches more assets than expected: syrup rooms, blend tanks, fillers, product piping, bright tanks, pasteurizers, valves, and return circuits. Poor sequence control can waste water, overuse chemicals, extend downtime, or create sanitation risk. Strong PLC design uses interlocks, valve proofing, recipe-based paths, alarm priorities, and data logging so each cycle is repeatable and auditable. This is also where sustainability and 2026 trends become highly relevant. Beverage manufacturers across the United States are being pushed to reduce water intensity, chemical loss, and energy use. Future-ready CIP programs increasingly support conductivity-based recovery, automated setpoint optimization, heat recovery coordination, and detailed reporting for ESG and plant management teams. The explanation is simple: each stage has a different validation need, and the PLC is what enforces those rules consistently. In regulated and audit-heavy environments, documented CIP execution is as important as the cycle itself. High-speed product tracking allows a beverage line to know where each bottle, can, or package is at all times. This starts at infeed and continues through filling, inspection, labeling, coding, packing, and palletization. The faster the line, the more important deterministic tracking becomes. Without it, rejection accuracy falls, traceability becomes weak, and operators spend too much time sorting suspect product. Tracking can be encoder-based, sensor-based, or hybrid depending on the application. The PLC often manages shift registers, product maps, queue models, and batch identifiers while passing lot and production data to SCADA or MES layers. This is especially valuable in co-packing facilities handling frequent SKU changes and retailer-specific date coding requirements. Plants serving national distribution through Memphis, Kansas City, Columbus, or the Port of New York and New Jersey often need robust line tracking because shipping errors become expensive quickly. If a wrong-code event occurs, accurate package tracking reduces the hold scope and limits waste. The area chart shows the ongoing shift toward automated digital tracking. By 2026, more beverage producers are expected to integrate line-level tracking with case coding, warehouse systems, and quality data, creating stronger recall readiness and less manual paperwork. OEE improvement is one of the strongest business reasons to invest in beverage PLC programming. Availability suffers when faults are unclear or recovery routines are weak. Performance suffers when machine handoffs are poorly tuned. Quality suffers when reject timing, fill control, or package inspection is unreliable. Controls engineers improve all three. Effective OEE strategies start with data structure. Downtime states must be meaningful, not generic. Micro-stops should be captured separately from major faults. Speed losses should be tied to machine states and operator actions. The PLC should tag events cleanly so dashboards and reports tell the truth instead of just generating noise. Second, OEE gains come from root-cause-oriented logic changes. Common examples include smarter permissives, reduced false trips, better starved/blocked balancing, controlled restart sequences, predictive maintenance alerts, and alarm rationalization. Sometimes the best gain comes from small programming changes rather than a new machine purchase. This is where engineering judgment matters. In many facilities, operators have adapted to old logic quirks and manual workarounds. A capable controls team can eliminate these hidden losses systematically and measurably. The explanation behind this table is that OEE is not improved by one dashboard alone. It improves when the PLC logic, machine settings, operator workflows, and maintenance priorities are aligned. Demand for beverage PLC programmers in the United States remains strong because plants need people who understand both controls and process reality. This is not generic factory automation. Beverage systems combine sanitation, utility management, package handling, food safety, motion control, and production economics in a way that requires specialized experience. Career opportunities exist with OEMs, integrators, engineering firms, plant operators, and large consumer packaged goods companies. Roles often include controls engineer, automation engineer, commissioning specialist, SCADA developer, systems integrator, plant controls manager, and technical project lead. Regions with consistent demand include the Southeast, Midwest, Texas, California, and major beverage distribution corridors. For companies hiring, the challenge is not just finding programmers who know ladder logic or structured text. The best talent understands fillers, pasteurization, batching, CIP, packaging inspection, and line balancing. They can start up equipment, troubleshoot under pressure, speak with operators, and tie plant-floor work back to commercial outcomes. The comparison chart illustrates a common buying reality: a general automation vendor may be technically capable, but a beverage-focused team usually performs better where sanitation, filler dynamics, packaging logic, and commissioning speed matter most. When selecting a PLC programming partner, look beyond hourly rates. Ask how they handle line integration, sanitation validation, FAT/SAT support, on-site startup, recipe governance, change control, cybersecurity, and post-launch optimization. Ask for experience with beverage-specific assets such as syrup rooms, blending systems, carbonation loops, tunnel pasteurizers, bright tanks, canning systems, and sanitary CIP skids. Also evaluate whether the provider can support your geography. Plants with multiple sites across the United States benefit from a partner that can respond in North Carolina, California, Texas, Illinois, or Ontario without rebuilding the support model each time. This checklist helps buyers compare vendors based on outcomes instead of just proposal language. Beverage PLC programming supports a wide range of industries and applications, including carbonated soft drinks, bottled water, dairy beverages, kombucha, energy drinks, juices, functional beverages, craft beer packaging, wine bottling, spirits, RTD canned cocktails, aseptic filling, and co-packing operations. The application range extends from syrup preparation and blending to final palletizing and warehouse interface. Plants often need controls that bridge utilities and process. A filler cannot run reliably if compressed air, glycol, RO water, or steam systems are unstable. That is why experienced integrators treat utilities, process, and packaging as one operating system rather than isolated projects. In real projects, programming improvements can unlock more value than expected. Some beverage clients prepare for multimillion-dollar capacity expansions only to discover that the line’s biggest limit is sequencing, not steel. In those cases, retuning and reprogramming can produce significant throughput gains at a fraction of the cost of new equipment. For examples of capital project execution and practical results, manufacturers often review an integrator’s project case studies before starting a controls upgrade. In the United States, local controls support can come from OEM technicians, regional integrators, electrical contractors, and specialized food-and-beverage engineering firms. The strongest option for larger projects is often a partner that combines local field execution with national process expertise. That matters in beverage hubs such as North Carolina, Southern California, Texas, Georgia, and the Chicago area, where projects may involve both immediate troubleshooting and long-term expansion planning. Disruptive Process Solutions supports food and beverage manufacturers across the United States and Canada with a business-first engineering approach. Rather than treating automation as a standalone trade, the company ties controls decisions directly to throughput, profitability, sanitation, and capital efficiency. Manufacturers can learn more about the firm’s background on the about page. From a technological capability standpoint, DPS works across process, controls, utilities, and data systems. That includes PLC programming, automation integration, SCADA, batching logic, sanitary process control, recipe management, and coordination of systems such as carbonation, blending, filtration, aseptic operations, and water treatment. This cross-functional depth is especially useful when line performance depends on interactions between packaging equipment and upstream process assets. From a manufacturing capability standpoint, DPS supports complete beverage and food system execution, including processing tanks, CIP systems, utility integration, and custom equipment solutions. The company also provides proprietary equipment in areas such as tanks and CIP packages, which can be explored through its equipment capabilities. For beverage manufacturers, that means controls work can align closely with the actual hardware being installed and commissioned. From a service capability standpoint, DPS operates with an end-to-end model that covers engineering, installation oversight, integration, project management, startup, and owner-focused execution. Its support spans process design, capital planning, turnkey installation, and controls optimization across project sizes. Companies evaluating a broader automation and facility strategy can review these offerings on the services page. This integrated model is particularly helpful for co-packers and multi-line manufacturers that need one partner to connect business goals with field execution. For U.S. beverage producers, this combination of technological, manufacturing, and service capability matters because line performance is rarely just a coding issue. It is usually the result of how engineering, equipment, utilities, and project execution fit together. A beverage PLC programmer develops and maintains the control logic for processing and packaging systems such as fillers, conveyors, CIP skids, cappers, labelers, batch systems, and utility interfaces. The role also includes troubleshooting, startup support, optimization, and data integration. Yes. In many cases, better synchronization, improved line balancing, reduced nuisance faults, and cleaner changeover logic can unlock meaningful throughput gains from existing equipment. High-speed carbonated lines, RTD alcohol, functional beverages, aseptic products, and co-packing operations often need the most advanced controls because they combine high SKU count, strict packaging requirements, and demanding sanitation expectations. It is critical. CIP programming affects food safety, downtime, water use, chemical consumption, and audit readiness. Weak CIP control can create both sanitation risk and unnecessary operating cost. Ask about beverage-specific experience, nationwide field support, startup capability, OEE reporting structure, sanitary process knowledge, vision system integration, and long-term service responsiveness. It tracks products, rejects, lot codes, and machine states from infeed through case packing. When integrated with SCADA or MES, it supports faster investigations and better recall readiness. The major trends are stronger digital traceability, water- and energy-efficient CIP control, more vision inspection, increased recipe and SKU flexibility, cyber-secure remote support, and greater use of production data for continuous improvement. No. Small and mid-sized plants also benefit, especially when labor is tight, SKU complexity is increasing, or growth plans require better uptime before adding new equipment. In the United States beverage market, PLC programming has moved from a support function to a strategic capability. It improves reliability, raises throughput, strengthens sanitation, and helps manufacturers scale intelligently. For producers planning a new line, upgrading a legacy system, or trying to solve a stubborn bottleneck, the right controls strategy can create measurable value faster than many capital-intensive alternatives.


