-
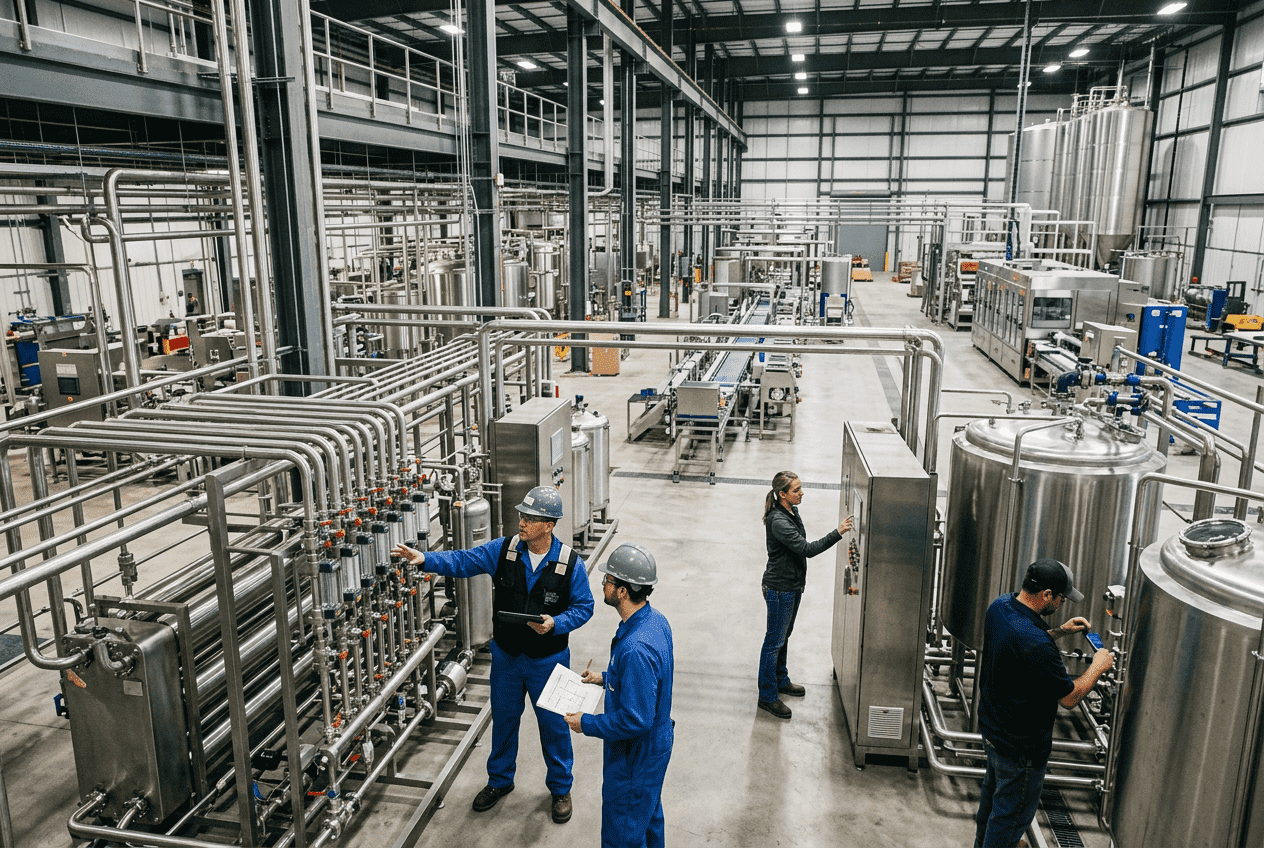
Co-Packing Plant Engineering: Design, Integration, and Optimization Services
Co-packing plant engineering is the discipline of planning, designing, integrating, and optimizing shared manufacturing facilities that run products for multiple brands, SKUs, package formats, and production schedules. In the United States, this work goes far beyond choosing a filler or laying out a warehouse. It includes capacity modeling, utility sizing, process equipment specification, controls architecture, code compliance, sanitary design, material flow, commissioning, and scale-up planning. For food and beverage operators, especially those serving national retail, club, foodservice, and private-label channels, engineering quality often determines whether a plant becomes profitable quickly or struggles with downtime, changeovers, and utility constraints. For owners evaluating a new site in Texas, the Carolinas, California, Illinois, Georgia, or New Jersey, the most effective approach is usually to connect business strategy to engineering decisions early. That means aligning target volumes, customer mix, packaging formats, labor assumptions, and regulatory requirements before committing to tanks, boilers, conveyors, or building modifications. Companies that do this well tend to reduce rework, shorten startup timelines, and improve first-year margins. Co-packing plant engineering covers the full technical lifecycle of a shared food or beverage facility: concept development, feasibility, process design, utility infrastructure, equipment selection, automation, installation, startup, validation, and long-term expansion planning. In the United States market, the best engineering programs are built around throughput, sanitation, flexibility, and speed-to-market. A strong engineering partner should help answer five practical questions early: For U.S. co-packers serving fast-moving categories such as RTD beverages, sauces, dairy, protein, nutraceutical drinks, and shelf-stable foods, engineering decisions directly affect OEE, labor cost, customer responsiveness, and compliance. This is why many owners engage firms that can combine process design, utilities, controls, installation, and project execution under one model rather than fragmenting responsibility across separate parties. The table above shows why co-packing engineering is not a narrow equipment-buying exercise. It is a plant-level strategy that ties commercial goals to technical execution. A co-packing facility in the United States typically handles multiple brands, recipes, allergens, lot traceability rules, quality standards, and retailer service expectations. That complexity is why plant engineering must begin with a concept package rather than isolated equipment quotes. The concept phase usually includes target throughput, product family mapping, sanitation zoning, packaging line requirements, ingredient staging logic, and rough-order utility loads. In inland logistics hubs like Chicago, Columbus, Kansas City, and Memphis, engineers may prioritize distribution speed and dock capacity. In port-connected regions such as Long Beach, Savannah, Houston, or Port Newark, inbound container flow and export readiness can become more important. From there, detailed engineering converts business assumptions into physical systems. That includes floor plans, process flow diagrams, piping and instrumentation diagrams, line layouts, electrical one-lines, utility balance studies, controls narratives, and procurement packages. Commissioning then confirms that installed systems meet performance intent. For buyers, the key advice is simple: define what flexibility means for your business. It may mean the ability to run both hot-fill and cold-fill products, to switch between cans and PET, to support dairy and non-dairy segregation, or to add a second shift without rebuilding utilities. If those needs are not engineered up front, the plant may become constrained long before demand peaks. This phased approach is particularly useful for contract manufacturers entering new categories such as fermented beverages, aseptic products, prepared foods, or protein-based items where process risk is higher and utility requirements are less forgiving. The chart reflects a realistic growth pattern: co-packing demand in the United States continues to rise as brands seek flexible production without fully owning every manufacturing asset. Utility design is often the hidden factor behind co-packing profitability. Shared plants live or die by uptime, sanitation cycle reliability, thermal stability, and power quality. A line may look capable on paper, yet fail in production if steam pressure collapses during CIP, if compressed air dew point is poorly controlled, or if chilled water cannot handle summer loads in states like Texas, Arizona, or Florida. Steam systems are central for cooking, pasteurization, hot water generation, sterilization support, and CIP. Engineers need to account for peak simultaneous loads, startup diversity, condensate return strategy, blowdown, water treatment, and future line additions. Compressed air must be sized not only for average demand but for high-transient packaging events, actuator clusters, and quality class requirements where product-contact risk is present. Chilled water and glycol systems matter heavily in beverage blending, fermentation support, dairy processing, and cold-filled operations. Electrical infrastructure must address motor loads, VFD harmonics, backup philosophy, available utility service from the local power provider, and capacity for future packaging modules. In U.S. manufacturing zones such as the Inland Empire, Atlanta, Dallas-Fort Worth, and the Research Triangle, utility lead times can influence schedules as much as equipment procurement. Early coordination with local utilities, AHJs, and industrial service providers helps avoid expensive late-stage changes. The most successful U.S. plants do not size utilities to today’s nominal load alone. They design in room for a second line, a larger CIP module, or a higher-throughput packaging lane. This is especially important where customer wins can quickly change volume assumptions. Equipment selection in co-packing is not about buying the most advanced machine in each category. It is about specifying a system that can run multiple products, containers, and customer requirements with acceptable labor, maintenance, sanitation, and changeover performance. The right filler for a single-SKU owner-operated plant may be the wrong filler for a contract manufacturer managing short runs across several brands. Specifications should define performance metrics, not just model names. That includes target rate, acceptable giveaway, CIP compatibility, washdown level, change-part strategy, recipe integration, data communication, spare parts philosophy, and FAT acceptance criteria. Packaging lines serving club-store formats, e-commerce bundles, or retail-ready pallets require different downstream engineering than lines serving conventional grocery. Vendor selection in the United States also depends on serviceability. A machine with weak field support in California, Tennessee, Wisconsin, or North Carolina can become a chronic downtime issue. Parts availability, domestic technician coverage, documentation quality, and controls standardization all matter. For owners building a shortlist, it is wise to compare not only purchase price but installed cost, startup support, utility consumption, and expected line balance performance. A lower-cost machine can become the expensive choice if it forces manual workarounds or repeated downtime. Operators looking for integrated support often prefer engineering firms that understand both equipment and plant-level consequences. For example, custom process equipment capabilities can be valuable when standard skids do not match a plant’s space, sanitation, or utility constraints. This comparison highlights a common market reality: engineering-led packages often score higher where flexibility and integration matter more than simple first cost. Capacity modeling is one of the most important services for a co-packing plant because shared facilities rarely fail for lack of equipment nameplate speed. They fail because different constraints stack together: changeovers, labor handoffs, CIP windows, allergen sequencing, ingredient staging, warehouse congestion, QC hold times, and palletizer slowdowns. A realistic throughput model should therefore combine mechanical rates with operational losses. In the United States, facilities near major distribution corridors such as I-35, I-75, I-80, and I-95 often receive strong customer demand quickly. If capacity planning is weak, a new contract can push the site into overtime, chronic WIP buildup, or poor service levels. Throughput engineering needs to assess product families, batch sizing, takt mismatches between process and packaging, schedule logic, and utility overlap. One practical buying tip is to request scenario modeling, not just one forecast. Owners should see baseline, aggressive growth, and constrained-labor cases. That reveals whether a second filler, larger syrup room, additional warehouse lane, or expanded compressed air capacity is truly needed now or can wait until phase two. Production optimization should also consider product types. Carbonated beverages, non-carbonated drinks, cultured dairy, sauces, retort items, and cooked proteins each bring different line-balance logic. A plant with strong scheduling software but poor physical buffering may still underperform. The demand mix shown above is consistent with current U.S. outsourcing behavior, where beverages and functional products remain major drivers of greenfield and retrofit investment. Material flow engineering ties the plant together. Even an excellent process line can lose money if trailers queue too long, raw ingredients travel too far, pallet storage is fragmented, or finished goods staging blocks outbound shipping. Co-packers in the United States often face high SKU counts, seasonal promotions, club packs, and retailer-specific labels, all of which put pressure on internal logistics. Receiving design should consider truck patterns, lot traceability, sampling, temperature control, and segregation of allergens or high-risk materials. Warehousing must support both operational velocity and inventory accuracy. WIP zones need to avoid cross-traffic between forklifts, operators, QA staff, and maintenance. Shipping design should align with customer routing guide requirements and trailer turn times. Near large ports like Los Angeles/Long Beach, Savannah, and New York/New Jersey, imported packaging material timing can affect space strategy. In central U.S. hubs like Indianapolis or St. Louis, the emphasis may shift toward high-throughput cross-docking and domestic replenishment. In either case, material flow should be engineered before racking, dock equipment, and line placement are finalized. For companies seeking broader support, integrated engineering and project execution services are particularly helpful when process, packaging, utilities, and warehouse systems must be coordinated on one timeline. This table illustrates why logistics engineering belongs inside the plant design process, not after equipment installation. Shared facilities depend on synchronized movement more than single-brand plants do. Automation architecture determines how well a co-packing plant can operate, troubleshoot, document, and scale. At minimum, a modern U.S. facility should define standard PLC platforms, HMI conventions, alarming rules, historian strategy, recipe management, and production data ownership. More advanced plants add SCADA, OEE dashboards, batch control, electronic records, and MES integration. PLCs control the equipment. HMIs make the process visible to operators. SCADA aggregates plant-wide status and alarms. MES bridges operations to production scheduling, genealogy, and performance analytics. In co-packing, recipe security and lot traceability are especially important because multiple clients may share assets on the same day. Well-designed controls also create value by eliminating false bottlenecks. It is not unusual for a plant to assume new equipment is required when the actual issue is logic sequencing, poor interlocks, or weak changeover recipes. A disciplined controls review can unlock substantial capacity at low capital cost. This is an area where technical depth matters. Firms with practical process, electrical, and controls experience can align mechanical systems with programming standards and utility behavior. In that context, learning more about DPS and its operating model can help buyers understand how an engineering-led partner approaches transparency, integration, and profitability-focused project delivery. The area trend supports what many U.S. operators are already seeing: by 2026, digital recipe control, electronic records, energy visibility, and plant-wide diagnostics will become standard expectations rather than premium extras. Commissioning turns engineering intent into operating reality. In co-packing plants, this phase must be more disciplined than a basic startup because the facility often launches with tight customer deadlines and little tolerance for quality drift. A strong commissioning plan covers pre-functional checks, dry testing, wet testing, utility verification, controls checkout, line balance trials, CIP validation, operator training, punch management, and performance signoff. FAT and SAT protocols should be structured around product and packaging risk. A filler FAT is not only a mechanical test; it should verify recipe handling, communication with upstream and downstream equipment, reject logic, data capture, and sanitation readiness where applicable. SAT confirms the machine works in the actual plant environment with real utilities and real interfaces. Validation rigor varies by application. Shelf-stable, aseptic, dairy, USDA-regulated, and allergen-sensitive operations require more formal documentation and acceptance criteria than lower-risk applications. U.S. buyers should make sure this scope is defined before procurement, not after skids are delivered. Case examples are especially useful here because they show how execution decisions play out under field conditions. For practical references, owners can review project case studies and completed work examples to see how integrated teams manage engineering, relocation, utility upgrades, and startup complexity. From a service capability perspective, this is where a full-scope partner brings real value. A lean but experienced engineering organization that can design the solution, act as general contractor where licensed, coordinate local trades, manage schedules, oversee installation, and drive commissioning under a unified approach reduces the handoff gaps that often delay startups. Many of the best U.S. co-packing opportunities are not greenfield builds. They are retrofits and expansions of existing plants where customer demand outgrows the original design. Expansion engineering may involve a new syrup room, larger boiler capacity, compressed air redundancy, warehouse re-slotting, line automation updates, mezzanines, sanitary piping upgrades, or a second packaging format. Retrofitting an operating facility requires careful phasing. Shutdown windows, sanitary tie-ins, temporary utilities, contractor segregation, and food safety controls become critical. This is especially true in high-volume markets such as California, Texas, Georgia, and the Midwest, where customer service expectations leave little room for extended downtime. One of the most overlooked expansion tools is controls optimization. Before spending millions on new equipment, owners should verify whether current PLC logic, accumulation strategy, changeover sequencing, or CIP scheduling is limiting output. In some cases, software and systems integration deliver more capacity than hardware expansion alone. Manufacturing capability also matters here. A partner that understands process equipment fabrication, custom tanks, CIP systems, and specialized vessels can often solve retrofit constraints more effectively than firms limited to generic procurement. For food and beverage operators, especially those dealing with unusual space envelopes or utility restrictions, custom-built equipment can protect both capacity and sanitation performance. Looking ahead to 2026, several retrofit trends are shaping U.S. projects: For companies seeking a practical combination of technological capabilities, manufacturing knowledge, and execution discipline, DPS is notable for bringing process, mechanical, electrical, structural, plumbing, and controls engineering together with project management, equipment integration, and turnkey field installation across the United States and Canada. Its experience in food, beverage, utility infrastructure, automation, and compliance gives owners one point of accountability from concept through startup. What industries most often need co-packing plant engineering in the United States?Beverage, dairy, sauces, dressings, proteins, prepared foods, nutritional products, fermented beverages, shelf-stable meals, and private-label consumer packaged goods are the most active sectors. Demand is especially strong in logistics-rich regions such as Texas, the Southeast, the Midwest, and coastal port markets. What applications benefit most from specialized engineering?High-mix packaging, aseptic or sanitary processing, allergen-managed production, retort and thermal systems, carbonated beverage filling, complex CIP integration, and multi-format end-of-line packaging benefit the most. These applications create the greatest penalties when utilities, controls, or material flow are not coordinated correctly. How should buyers compare suppliers?Compare them on technical depth, utility understanding, food safety knowledge, controls capability, commissioning approach, field execution experience, and willingness to challenge weak assumptions. Ask whether they can support concept design, procurement, installation, and startup, not just equipment selection. Should a plant be designed for one customer or many?If your model is true contract manufacturing, design for a controlled range of customers rather than a single account. Standardize where possible, but leave room for line-side flexibility, utility spare capacity, and recipe or package variation. How much future capacity should be built in?There is no universal rule, but many successful U.S. co-packing projects design utilities and floor strategy with practical room for at least one major expansion step. That may mean larger headers, extra pad space, reserved panel capacity, or shell space for a second line. What is a common mistake in greenfield co-packing projects?Underestimating non-production losses. Owners often model line speed accurately but miss the impact of sanitation, changeovers, warehouse congestion, and operator travel. Those factors can erase a large share of theoretical capacity. What is a common mistake in retrofit projects?Assuming new equipment alone will solve the issue. Existing bottlenecks may be rooted in controls, utilities, scheduling, or building flow. A structured bottleneck study often saves capital. Why do full-scope partners matter?Because co-packing plants combine process, packaging, utilities, controls, code compliance, and operational readiness. When those scopes are fragmented, schedule risk and startup gaps increase. A coordinated delivery model generally improves accountability and project speed. What should be included in the first conversation with an engineering firm?Product list, package formats, target annual volume, expected launch timeline, customer requirements, sanitation risk, available utilities, site constraints, and budget range. The better the initial basis of design, the better the final outcome. How does DPS fit into this market?DPS serves food and beverage manufacturers across North America with a business-minded approach to capital projects. Its strengths include process engineering, utility systems, automation, custom equipment, project management, installation, and commissioning. The company is especially relevant to owners who want engineering tied directly to profitability, not just to construction scope. -
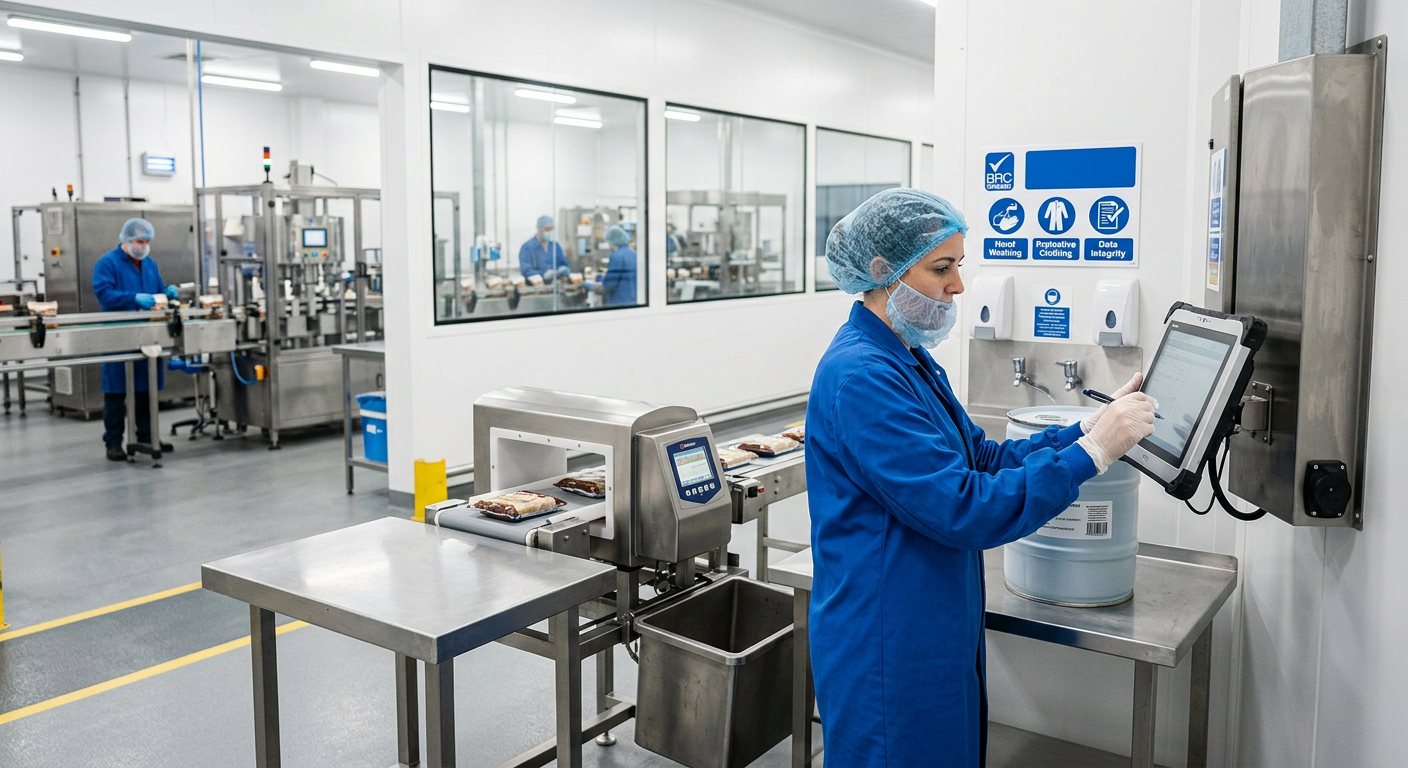
Food Plant Throughput Optimization: OEE and Bottleneck Management Strategies
Food and beverage manufacturers in the United States are under constant pressure to increase output without sacrificing food safety, quality, labor stability, or margin. Whether a plant produces protein products in the Midwest, sauces in Texas, dairy in Wisconsin, beverages in California, or aseptic products near East Coast distribution hubs, the central challenge is the same: how to move more saleable product through the facility in less time and at lower total cost. Throughput optimization is not just a plant-floor exercise. It connects maintenance, sanitation, utilities, controls, warehousing, labor planning, capital spending, and customer service. This guide explains how to improve throughput using practical methods: measurement, Overall Equipment Effectiveness, smarter production scheduling, bottleneck control, automation, faster changeovers, and long-range capacity planning. It is written for operations leaders, plant managers, engineering teams, finance stakeholders, and ownership groups who want to make profitable decisions rather than simply buy more equipment. The fastest path to higher throughput in a U.S. food plant is to identify the true constraint, measure losses around it, improve OEE at that point first, then align scheduling, sanitation, labor, automation, and utility capacity to keep that constraint fed and running. In many facilities, output does not increase because of a single machine purchase. It increases because downtime is reduced, changeovers are shortened, recipes are sequenced more intelligently, utilities are stabilized, and the line is controlled based on real data. For most manufacturers, the practical order of operations is: In the United States market, this matters because regional labor shortages, utility volatility, retailer service expectations, and transportation constraints from major trade hubs such as Los Angeles/Long Beach, Houston, Savannah, New York/New Jersey, and Chicago all amplify the cost of lost throughput. A plant that misses production today often misses customer delivery tomorrow. Buying advice is simple: do not begin with a machine brochure. Begin with measured losses, line balance, and financial impact per constrained hour. Plants that do this well typically gain more output from controls, scheduling, sanitation redesign, and system integration than from isolated equipment replacement. Throughput analysis starts with a precise definition. In food manufacturing, throughput should mean saleable units, pounds, gallons, cases, or batches that exit the system within a given time while meeting quality and compliance requirements. It should not mean theoretical machine speed, nameplate capacity, or short test-run performance. A poultry line in Arkansas, a yogurt plant in upstate New York, and a ready-to-drink beverage co-packer in North Carolina may all report “high capacity,” but their true throughput can differ sharply once sanitation windows, utility interruptions, ingredient staging, allergen changeovers, label changes, and rework are included. To measure throughput correctly, plant teams should collect data at three levels: process level, packaging level, and site level. Process data tells you what the cookers, fillers, mixers, homogenizers, pasteurizers, or retorts are doing. Packaging data shows whether cartoners, labelers, case packers, depalletizers, palletizers, and conveyors are restricting flow. Site-level data reveals whether refrigeration, compressed air, steam, water treatment, wastewater, or labor handoffs are limiting the whole operation. The following table summarizes the most useful metrics for throughput analysis and how they should be used in a food plant. This table is useful because it prevents managers from chasing a single number. A plant can post decent machine speed while still failing in yield, schedule attainment, or unplanned downtime. Throughput improvement should therefore be measured as a system outcome, not just a machine outcome. In the U.S. market, analysis should also account for external realities. Plants near major ports may see ingredient timing variability; facilities in the Southeast may face seasonal humidity effects on packaging materials; facilities in the Plains and upper Midwest can see labor turnover spikes during harvest cycles; and protein plants under USDA inspection must account for inspection-driven flow constraints. These are not excuses; they are design inputs for a realistic throughput model. The growth trend above reflects what many manufacturers are already seeing: throughput optimization is increasingly a capital priority because the cost of lost capacity is rising faster than many traditional overhead categories. Overall Equipment Effectiveness, or OEE, remains one of the clearest ways to translate operating losses into action. In food and beverage environments, however, OEE must be adapted carefully. Standard manufacturing formulas are useful, but food plants face sanitation windows, allergen controls, recipe complexity, thermal process validation, and packaging variability that can distort simplistic OEE reporting. A credible OEE program does not hide these realities; it structures them. OEE combines three elements: For example, a line may show acceptable quality while still losing output because availability is poor due to changeovers and minor faults. Another line may run continuously but at a reduced rate because operators intentionally slow it down to avoid jams at the downstream case packer. In both situations, OEE makes the loss visible. The following table shows common OEE loss sources in U.S. food facilities and the operational response each one requires. This table matters because it ties OEE losses to practical plant conditions rather than abstract formulas. In food plants, performance loss is often not mechanical alone. It may originate in recipes, raw material variability, washdown practices, packaging supply inconsistency, or utility support systems. Product type also affects OEE strategy. A retort operation will care about thermal cycle integrity and basket handling. A high-speed beverage line will watch filler, capper, labeler, and packer synchronization. A protein plant may focus on deboning, marination, portion control, chilling, and labor pacing. That is why OEE should be deployed by product family and line architecture, not as a one-size-fits-all dashboard. As 2026 approaches, plants are increasingly pairing OEE with contextual data from PLCs, SCADA, vision systems, recipe platforms, and utility meters. The trend is toward event-level loss classification that lets engineering, maintenance, and operations solve the same problem with the same timestamps. This is especially important for multi-site manufacturers serving national distribution from hubs such as Dallas-Fort Worth, Atlanta, Columbus, and Memphis. Production scheduling is one of the most undervalued tools for increasing throughput. Many U.S. plants think of scheduling as administrative, but it is actually a capacity lever. If product families are sequenced poorly, lines will spend too much time on washdowns, allergen transitions, label changes, package size swaps, and raw material re-staging. The result is that expensive process and packaging assets sit idle while teams work around a plan that was never optimized for real plant constraints. Better scheduling starts with grouping products by shared characteristics: allergen profile, viscosity, flavor intensity, packaging format, thermal process, label family, and cleanability. A sauce plant may sequence from lighter flavors to stronger ones. A dairy facility may move from non-allergen to allergen-containing products. A beverage plant may group by bottle type and cap format before flavor. A protein processor may sequence around raw material freshness windows, labor skill availability, and USDA inspection staffing. The table below shows scheduling tactics by product type. This table shows why scheduling cannot be separated from product type. Each category has a different constraint pattern, and the wrong sequencing rule can erase a large share of available capacity. One increasingly important buying consideration is scheduling software. Plants should not buy a platform simply because it promises “AI scheduling.” Instead, they should ask whether it can incorporate sanitation rules, labor skill matrices, allergen logic, utility limitations, and packaging supply constraints. The best solution is often not the biggest software package, but the one that connects most cleanly with ERP, MES, and plant-floor controls. The demand pattern above reflects where throughput pressures are especially visible in the United States: fast-moving beverage networks, labor-sensitive protein facilities, and co-packing operations serving retailers and brand owners with tight service expectations. Bottleneck management is the core of throughput optimization. Every plant has one current constraint, even if several departments feel overloaded. The bottleneck may be obvious, such as a slow filler, retort, cooker, or palletizer. It may also be hidden, such as inadequate CIP turnaround, unstable steam pressure, change-part availability, ingredient thaw time, or a PLC logic issue that limits safe line speed. The mistake many companies make is treating every pain point as equally important. The correct approach is to identify the step that most limits saleable output over time, then protect, feed, and elevate that constraint. Upstream assets should support it; downstream assets should clear product from it. Labor, maintenance, and scheduling should be biased toward its uptime. The following table outlines common bottlenecks and the best response strategy. This table is a reminder that bottlenecks are often cross-functional. A line may appear mechanically constrained when the real issue is warehouse release timing or utility support. In many cases, especially in older U.S. facilities that have expanded in phases, the limiting factor is not the newest machine but the legacy infrastructure around it. Case studies across the market show that controls bottlenecks are frequently missed. A plant may be preparing for a multi-million-dollar capacity expansion when the true constraint is logic architecture, recipe handling, or line synchronization. That is why independent assessment matters. Objective engineering review often prevents unnecessary capital spending. For local supplier evaluation, manufacturers should look beyond OEM service alone. Regional millwrights, controls integrators, utility contractors, stainless fabrication partners, and sanitary piping specialists can all influence bottleneck removal. In trade corridors such as Chicago, Charlotte, the Inland Empire, and the Texas Triangle, speed of access to qualified field support can materially affect project payback. Automation should be applied where it improves constrained output, process consistency, operator safety, traceability, or utility efficiency. It should not be justified by novelty. In food and beverage manufacturing, the best automation investments usually target repetitive decisions, unstable control points, labor-intensive transfers, and data gaps that cause conservative line operation. Examples include automated batching with recipe management, in-line Brix monitoring, SCADA-based visibility, PLC logic optimization, vision inspection, automated deboning or cutting support, robotic case packing, palletizing, CIP automation, and energy management tied to process demand. In aseptic and beverage systems, automation can protect sterile integrity and reduce variability. In protein and prepared food operations, it can improve yield, handling, and line balance. The technological capability side of a strong engineering partner matters here. Plants need expertise across process, controls, electrical, mechanical, plumbing, structural, and utility systems, because automation only produces throughput gains when it is integrated into the whole process. A controls change without process understanding can create new bottlenecks elsewhere. The trend is clear: by 2026, more plants will combine automation with sustainability and compliance goals. Automated control of water, steam, compressed air, and CIP cycles reduces both operating cost and environmental load. Policy pressure around energy use, wastewater, and documentation will continue to favor systems that can prove performance instead of relying on manual logs. When evaluating suppliers, ask these questions: These questions are particularly important for plants operating multiple product types, such as co-manufacturers and co-packers. Their throughput challenge is usually variability, and variability is where good automation pays best. Changeover time reduction often produces some of the fastest throughput gains because it frees capacity without new square footage. In high-mix U.S. plants, changeovers consume far more time than managers first estimate. The line may stop not only for equipment adjustment, but also for label changes, QA verification, washdowns, ingredient staging, code dating, package component replenishment, and startup checks. Effective changeover reduction uses a structured method similar to SMED: separate internal steps from external steps, move preparation outside the stop window, standardize parts and settings, color-code tooling, pre-stage materials, digitize checklists, and train crews to a repeatable sequence. Many plants also benefit from simplified product family architecture, which reduces the number of unique adjustments required. Applications vary by industry. Beverage plants often gain from quick-release handling parts and automated rinse verification. Dairy plants benefit from CIP validation and valve matrix logic improvements. Protein facilities may gain more from tool organization, sanitation zoning, and labor choreography. Prepared food plants often reduce time through recipe sequencing and faster startup approval workflows. The economic case is straightforward. If a line loses 45 minutes per changeover and performs four changeovers per day, that is three hours of lost capacity every day. On a constrained, margin-rich line, those hours may be worth much more than the cost of most improvement efforts. To make changeover reduction stick, management should post three numbers by line: average changeover duration, best recorded duration, and percentage of externalized tasks. That keeps the focus on repeatability rather than heroics. Capacity planning is where throughput optimization becomes a long-term business strategy. Many manufacturers make one of two mistakes: they underinvest and create recurring congestion, or they overbuild and burden the business with excess capital. Smart scaling starts with demand scenarios, product mix forecasts, utility requirements, labor realities, and distribution strategy. In the United States, capacity planning must reflect geography. A beverage plant supplying the West Coast through Los Angeles and Oakland faces different freight and water considerations than a Southeastern plant shipping through Savannah or a Midwest protein plant distributing through Chicago and Kansas City. Cold-chain availability, wastewater permitting, labor competition, and energy cost all influence what “capacity” actually means in practice. The table below helps frame expansion decisions. This table is valuable because it links capacity choices to timing and data. The right answer depends on whether the business needs immediate relief, strategic flexibility, or a large long-term footprint. Manufacturing capability becomes crucial at this stage. A partner with experience in tanks, CIP systems, processing vessels, line integration, and utility infrastructure can help plants scale coherently instead of adding disconnected assets. For food and beverage facilities, this includes storage and process tanks, cooking vessels, sanitary transfer systems, marination tumblers, blending and batching systems, retort support, pasteurization support, and the utility backbone that keeps them productive. Service capability matters just as much. Feasibility studies, capital planning, owner’s representation, project management, installation coordination, and commissioning discipline often determine whether a project improves throughput or simply creates expensive disruption. Manufacturers looking at multi-phase growth should prioritize partners who can engineer, build, and manage execution with one accountable model rather than fragmented handoffs. Companies that want that kind of support can review food and beverage engineering services built around end-to-end project execution. The comparison above shows why many plants should start with debottlenecking, scheduling, and selective automation before moving to full expansion. New lines and greenfield projects can produce major gains, but they also carry the highest complexity and capital exposure. Disruptive Process Solutions, often known as DPS, serves food and beverage manufacturers across the United States and Canada with a practical, profit-focused engineering mindset. The company is headquartered in Cary, North Carolina, with a West Coast presence in Lake Forest, California, allowing it to support projects near major manufacturing and distribution corridors on both sides of the country. Rather than operating like a traditional contractor chasing scope volume, DPS is structured to help manufacturers make sound capital decisions and execute them effectively. From a technological capability perspective, DPS supports process, controls, electrical, structural, mechanical, and plumbing engineering as integrated disciplines. That is important in throughput work because a line problem can begin in PLC logic, recipe control, SCADA visibility, utility instability, or process design rather than in the machine operators can see. The company’s experience spans beverage systems such as brewing, spirits, wine, kombucha, soft drinks, juices, dairy beverages, carbonation, blending, aseptic processing, water treatment, pasteurization, and filling support, as well as food systems for proteins, prepared foods, sauces, dairy, retort, plant-based processing, and sanitary utilities. Manufacturers exploring project fit can learn more about the DPS team and approach. From a manufacturing capability perspective, DPS also designs and supplies selected process equipment, including tanks, CIP systems, tumblers, and cooking vessels, while integrating broader plant systems around them. That matters because throughput projects often fail when proprietary equipment, third-party equipment, and utilities are not aligned into a single operating strategy. Companies seeking integrated equipment options can review process equipment solutions for food and beverage plants as part of larger capacity or debottlenecking initiatives. From a service capability perspective, DPS uses a design-build-manage approach that combines front-end planning, engineering, general contractor-style execution, field coordination, installation oversight, and commissioning management. For throughput optimization, that approach reduces the risk of fragmented decision-making. Instead of treating controls, utilities, process equipment, and schedule planning as separate issues, the project can be managed as one business case. A useful example of this philosophy is the type of project where a client expects to spend millions on expansion, but detailed analysis reveals a smaller controls or integration issue that can unlock more capacity at far lower cost. Manufacturers interested in project examples can explore food and beverage case studies for practical context. For U.S. plants evaluating partners, this business-minded approach is often the difference between a project that looks successful at startup and one that is genuinely profitable 12 months later. What is the first thing a plant should do to improve throughput?Measure actual output at the real constraint point. If you do not know which step limits saleable output, any improvement plan is mostly guesswork. Is OEE enough on its own?No. OEE is a valuable framework, but it must be paired with yield, schedule attainment, utility performance, sanitation time, labor availability, and warehouse flow. Which industries benefit most from throughput optimization?Beverages, protein processing, dairy, prepared foods, sauces, aseptic operations, and co-packing all benefit strongly. High-mix and high-speed environments usually see the fastest returns. What product types typically have the biggest hidden losses?Multi-SKU beverages, allergen-sensitive dairy, variable-yield proteins, and products requiring frequent label or package changes often carry large hidden downtime and startup losses. Should we automate before fixing scheduling and changeovers?Usually no. If sequencing, sanitation, or changeover discipline is poor, automation may only make a flawed system more expensive. Stabilize the process first, then automate the right points. How do we know if the bottleneck is in controls rather than equipment?Look for signs such as consistent artificial speed limits, interlock delays, repeated nuisance faults, poor line synchronization, or operator workarounds that cap performance below physical capability. What local supplier factors matter in the United States?Response time, sanitary design experience, code compliance, access to skilled trades, and familiarity with regional labor and utility conditions all matter. Plants near major logistics hubs often benefit from deeper support networks. How should buyers compare vendors?Compare them on process understanding, integration depth, commissioning support, food safety familiarity, utility knowledge, and ability to connect throughput gains to financial outcomes, not just installation scope. What are the key 2026 trends?Expect more AI-assisted scheduling, stronger use of plant-floor data, more integrated SCADA and energy monitoring, tighter documentation for compliance, water and energy optimization, and more selective automation tied directly to labor and margin constraints. Can a small or mid-sized manufacturer use the same methods as a large enterprise?Yes. The principles are the same. The scale of tooling, software, and capital changes, but measuring losses, controlling bottlenecks, reducing changeovers, and sequencing intelligently work at every size. In summary, food throughput optimization in the United States is not about finding one silver bullet. It is about understanding the plant as a system, identifying the true constraint, and improving the business case around that constraint with disciplined engineering and execution. Plants that measure honestly, schedule intelligently, automate selectively, and scale with a full-system view are the ones most likely to gain durable output, stronger margins, and better customer service. -
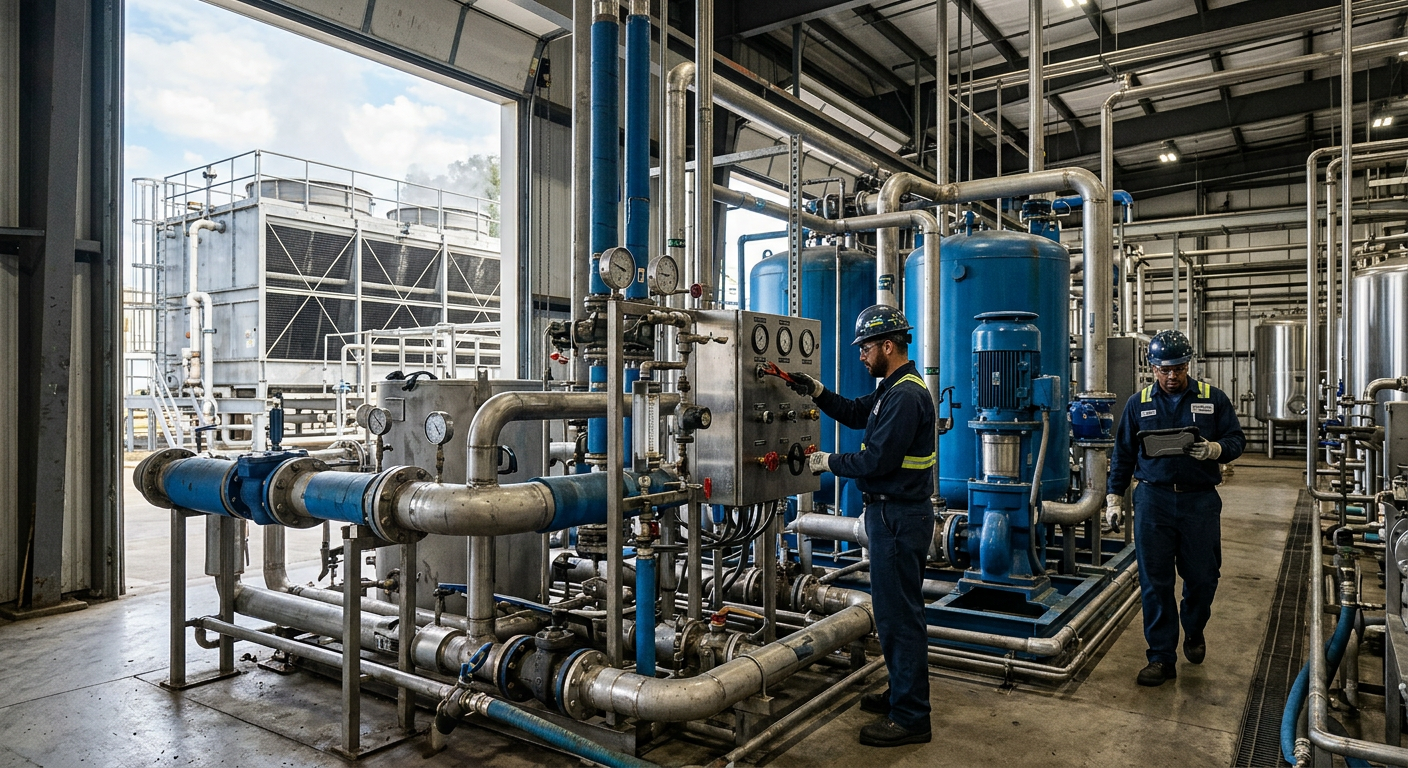
Food Co-Packing Facility Design: Engineering for Safety, Flexibility, and Compliance
In the United States, food co-packing facility design is no longer just about fitting equipment into a building. It is about building a production environment that protects food safety, supports multiple client brands, shortens changeovers, controls allergens, improves labor flow, and stands up to FDA inspections and third-party audits. For co-packers serving categories such as sauces, ready-to-drink beverages, frozen meals, proteins, dairy, plant-based foods, and shelf-stable products, the physical plant must function as both a sanitary processing asset and a commercial growth platform. That is especially true in major U.S. manufacturing corridors such as Chicago, Dallas-Fort Worth, Los Angeles, the Inland Empire, Atlanta, Charlotte, Houston, the New Jersey port market, and Central Valley California. In these regions, co-packers compete on throughput, compliance, speed to launch, and flexibility. Facility design decisions influence all four. A poorly planned receiving dock, a badly located allergen room, or undersized cold storage can reduce output, increase risk, and erode margins for years. For brands selecting a co-packer or investors developing a new plant, the right approach is to engineer the site around product risk, workflow, future expansion, utility demand, sanitation strategy, and certification goals from day one. That is the difference between a plant that simply operates and a plant that scales profitably. Food co-packing facility design in the United States should prioritize sanitary zoning, allergen segregation, efficient material flow, validated cleaning systems, temperature control, HACCP-based risk reduction, and readiness for FDA FSMA, SQF, and BRC requirements. The best facilities are designed for flexible multi-client production, rapid changeovers, clear separation of raw and finished goods, and utility systems sized for real production peaks rather than theoretical averages. For most co-packers, good design reduces contamination risk, prevents bottlenecks, lowers labor waste, and improves audit performance. In practical terms, a strong co-packing plant should include separate receiving and shipping patterns, dedicated or controlled allergen handling areas, logical transitions from raw ingredients to processing to packaging to warehousing, robust CIP or COP strategies, accessible utilities, sanitary drainage, air handling matched to risk zones, and room for future lines. If the plant handles beverage, dairy, sauces, or liquid foods, system integration between process piping, tanks, filling equipment, refrigeration, boilers, compressed air, controls, and sanitation becomes critical. The table above summarizes the core design priorities that shape profitable co-packing operations. Each priority affects not only compliance but also output, staffing, customer retention, and long-term capital efficiency. Food co-packing is the contract manufacturing of food or beverage products on behalf of brand owners. Some co-packers focus on one category, such as hot-fill beverages, sauces, frozen entrees, or dry blending. Others serve multiple categories across different clients and packaging formats. In the United States, co-packers may support emerging consumer brands, regional grocery programs, foodservice companies, private label retailers, and large national manufacturers seeking overflow capacity. Because co-packers handle other companies’ products, the facility must be more adaptable than a single-brand plant. It may need to run gluten-free items in the morning, dairy-based products in the afternoon, and a peanut-containing formula later in the week, all while maintaining traceability, validated sanitation, and lot separation. That creates design requirements beyond normal food manufacturing. Space planning, room segregation, traffic control, and utility flexibility become business essentials. The biggest facility design questions usually include: In U.S. trade hubs near the Ports of Los Angeles and Long Beach, Savannah, Houston, and New York/New Jersey, co-packers often need larger staging areas for imported ingredients and packaging. In inland distribution centers like Memphis, Indianapolis, and Kansas City, fast outbound shipping and warehouse turn times may matter more than port proximity. Facility design should reflect those local logistics realities. From a buying perspective, brands evaluating a co-packer should ask whether the plant was truly designed for contract manufacturing or simply adapted from another use. A repurposed warehouse can be workable, but only if circulation, drainage, envelope integrity, utilities, environmental controls, and sanitary finishes have been engineered properly. Allergen management is one of the defining challenges in co-packing facility design. The top U.S. allergens, including milk, eggs, fish, crustacean shellfish, tree nuts, peanuts, wheat, soy, sesame, and product-specific sensitivities, require more than signage and SOPs. They require physical design decisions that reduce cross-contact risk before operations even begin. Effective allergen control starts with zoning. High-risk ingredients should have dedicated receiving identification, separate storage racks or rooms, controlled weigh-up areas, color-coded utensils, isolated rework handling, and documented product changeover paths. Where possible, co-packers should use segregated production lines or time-based scheduling from non-allergen to allergen products, supported by validated cleaning verification. Preventive design strategies include enclosed transfer systems for powders, differential air pressure control in sensitive zones, dedicated handwash and gowning transitions, stainless worktables with simple cleanability, and floor plans that avoid backtracking of pallets or utensils. Drainage design also matters; poor slope or shared trenching can create contamination vectors. The table shows that allergen control is not a single program; it is a network of physical barriers, operational discipline, and validation steps. Plants serving bakery fillings, dairy beverages, sauces, snack coatings, and plant-based formulations often benefit from stronger segregation because ingredient overlap is common. For companies redesigning older sites, one of the most practical upgrades is to establish clear “allergen control zones” through walls, air handling, washdown boundaries, and dedicated storage. That is often more effective than relying on paperwork alone. Layout flow determines how safely and efficiently a co-packing plant runs. A well-planned plant moves materials in one logical direction: receiving, inspection, storage, weigh-up or thawing if needed, processing, packaging, finished goods staging, and shipping. Crossovers between raw and finished paths should be minimized, and personnel traffic should not conflict with forklift routes. For raw materials, design begins at the dock. Ingredients arriving from California produce regions, Gulf Coast protein suppliers, Midwest grain processors, or East Coast import ports should enter through receiving points sized for inspection and sampling. Packaging materials need separate staging, especially in high-volume beverage and prepared food plants. Within the building, adjacency matters. Raw meat or seafood prep cannot share open traffic with ready-to-eat packaging. High-care rooms should be protected from maintenance access and unnecessary forklift movement. Dry warehouses need dust-conscious handling. Finished goods staging should be close enough to shipping for speed but isolated from inbound contamination sources. This flow framework is especially important in multi-client facilities, where lot traceability and changeover control depend on physical order. If materials move backward or crisscross too often, sanitation and inventory control become harder to manage. When engineering layout, many owners also overlook utility corridors, maintenance access, and future expansion pads. A line may fit today, but if tank replacements, valve service, or conveyor extension require tearing through active production, the original design has already become a liability. CIP system design is central to many co-packing environments, especially those handling beverages, dairy, sauces, dressings, liquid nutrition, cultured products, and aseptic or clean-process applications. A properly engineered CIP system shortens downtime, improves cleaning repeatability, supports verification, and reduces manual intervention. A poorly designed system wastes water, chemicals, labor, and production hours. CIP design should match soil type, line complexity, target contact surfaces, flow velocities, circuit lengths, temperature needs, and recovery strategy. Operators need usable access to valves, spray devices, conductivity measurement, tank level instrumentation, and recipe control. For some semi-solid or particulate applications, plants may require a combination of CIP and COP rather than pure CIP. Sanitary equipment specifications should focus on hygienic welds, proper surface finish, dead-leg reduction, slope-to-drain design where appropriate, compatible gasket materials, easy disassembly points, and automation that supports repeatable cleaning sequences. Fillers, tanks, pumps, heat exchangers, piping manifolds, and process skids must be treated as part of an integrated sanitation system rather than individual purchases. This is an area where engineering depth matters. Companies working with process integrators that understand full utility and controls integration often achieve better uptime because the CIP system is designed together with the line, not bolted on later. In the North American market, some firms also offer custom fabrication of process tanks and CIP skids, which can help match system sizing to actual production strategy. The table highlights why CIP is not just a sanitation expense but a production asset. In beverage co-packing and dairy processing, it often determines whether a plant can support frequent client changeovers without sacrificing available hours. For owners planning new builds, sanitary equipment should also align with long-term maintenance and replacement strategy. Standardized pump families, valve types, and instrumentation can simplify spare parts and technician training across multiple lines. HACCP-based facility design means the building and process are engineered around risk analysis, not just around convenience. In co-packing plants, critical control points may include cooking, cooling, metal detection, X-ray, fill temperature, seal integrity, product formulation, allergen labeling, pH control, water activity, or refrigerated holding. The exact CCPs vary by product category, but the design principle is constant: hazards should be controlled through a combination of process, equipment, layout, monitoring, and verification. For example, a sauce co-packer may need validated thermal treatment and hot-fill control. A frozen entrée facility may need rapid post-cook chilling and blast freezing. A beverage plant may rely on pasteurization, filtration, or aseptic barriers. A protein co-packer may require raw-to-RTE separation, sanitation control, and temperature discipline. These CCPs should influence room placement, utility capacity, floor drains, sensor locations, and operator access. HACCP also intersects with environmental monitoring and zoning. Facilities producing ready-to-eat foods often separate raw, low-risk, high-care, and high-risk zones. The building envelope, airflow, traffic patterns, and sanitation systems should reinforce those distinctions. It is far easier to defend a food safety plan during an audit when the plant itself visibly supports hazard control. When brands ask for proof that a co-packer can protect their product, this is usually what they are really asking: does the facility physically support the food safety plan, or is the food safety plan trying to compensate for a weak facility? Adaptability is one of the most valuable design traits in a modern co-packing plant. Unlike single-product facilities, co-packers may run short production campaigns, seasonal products, promotional packaging, and frequent formula changes. That makes quick changeover infrastructure essential. Effective changeover design includes dedicated staging for line parts, mobile hose and fitting management, tool shadow boards, clean component storage, line clearance zones, digital recipe control, and operator-friendly access to adjustments. Flexible production cells may combine modular processing skids, adaptable fillers, multi-format conveyors, and smart controls that allow rapid transitions between SKUs. From a business standpoint, these features increase available production time and reduce startup errors. They also improve margin performance for smaller brands that cannot justify long campaign runs. In the U.S. market, this is especially important for high-mix growth sectors such as functional beverages, premium sauces, snack inclusions, refrigerated dips, and plant-based prepared foods. Technology also plays a larger role in 2026 planning. More co-packers are investing in PLC programming, SCADA visibility, batch control, digital work instructions, and data capture for downtime analysis. Smart automation does not replace good layout, but it helps plants identify the true bottlenecks. In some cases, the most profitable capacity gains come from controls optimization rather than new square footage. That is why experienced engineering partners often approach co-packing projects as operating model design, not just construction. An integrated team can evaluate whether the constraint is labor, utility demand, recipe management, line speed, sanitation duration, warehouse turnover, or programming logic before capital is spent. Cold chain engineering is vital for many co-packers in the United States, including frozen meal producers, meat and poultry processors, seafood packers, dairy manufacturers, meal kit suppliers, beverage companies using temperature-sensitive ingredients, and ready-to-eat chilled brands. Temperature-controlled zones must be designed around product load, dock activity, door openings, air balance, sanitation demands, and expansion planning. Cold rooms are not interchangeable. A raw chilled ingredient cooler, a finished product cooler, and a blast freezer serve different purposes and should be designed accordingly. Product throughput, pallet density, target pull-down time, evaporator selection, defrost planning, and forklift traffic all affect performance. In regions such as Texas, Florida, and Southern California, ambient heat load can heavily influence refrigeration design and energy costs. Blast freezing is especially important where product quality, shelf life, or microbial control depends on rapid temperature reduction. If freeze tunnels or spiral freezers are undersized, production backs up quickly. Similarly, if chilled staging is too small between packaging and warehousing, dock dwell time can compromise product integrity. The table illustrates that every temperature zone has a different engineering purpose. Simply adding more refrigeration is not enough; the process and logistics pattern must support the intended thermal outcome. As sustainability expectations rise into 2026, U.S. co-packers are also paying more attention to high-efficiency refrigeration, heat recovery, door management, insulation upgrades, and energy monitoring. These improvements support both operating cost control and customer ESG expectations. In the United States, food co-packers must be designed with regulatory and customer audit readiness in mind. FDA FSMA places strong emphasis on preventive controls, hazard analysis, sanitation, supply-chain oversight, and documentation. Many co-packers also need to meet retailer and brand requirements tied to SQF, BRCGS, or equivalent food safety certification schemes. In some categories, USDA expectations may also apply. Certification readiness begins in the built environment. Auditors look at hygienic zoning, wall and floor condition, drainage, pest exclusion, utility penetrations, handwashing access, chemical storage, maintenance practices, and product protection. Even strong SOPs can be undermined by poor construction details such as cracked floors, exposed insulation, condensate risk, or inaccessible cleaning surfaces. For many owners, the smartest approach is to align design documentation, capital planning, and operational readiness early. This includes sanitary equipment specifications, validation strategy, environmental monitoring support, calibration access, utility redundancy for critical systems, and document flow for startup and commissioning. Facilities that plan for audits from the beginning usually avoid costly retrofits later. In this area, service capability matters as much as design capability. Some engineering firms support not only process design but also feasibility studies, owner’s representation, project management, general contracting coordination, equipment supply, installation, and startup integration. That full-scope approach can be valuable when a plant needs to move quickly while maintaining compliance discipline. The U.S. co-packing market remains strong across beverage, prepared foods, proteins, frozen items, sauces, dairy, nutraceutical foods, and plant-based categories. Demand is being driven by brand outsourcing, private label growth, regional distribution expansion, and the need for capital-efficient manufacturing. In cities such as Charlotte, Dallas, Phoenix, Nashville, and Reno, co-packing growth is also tied to labor access, distribution connectivity, and lower-cost expansion opportunities compared with older urban industrial markets. Common product types supported by co-packers include RTD beverages, carbonated soft drinks, kombucha, dairy beverages, sauces, marinades, dressings, protein products, seafood items, retort meals, aseptic fills, frozen entrees, and dry ingredient systems. Each category brings different design implications for thermal processing, washdown, air handling, warehouse strategy, and certification needs. For buying advice, brands should assess more than line speed. They should ask about allergen management, actual utility capacity, controls architecture, traceability, sanitation validation, maintenance access, downtime history, and the facility’s ability to add future SKUs without disrupting current output. If a co-packer cannot clearly explain its zoning, CIP methodology, temperature control strategy, and audit posture, that is a warning sign. Industries commonly using co-packing include grocery retail, foodservice, club stores, convenience channels, meal kits, e-commerce food brands, institutional food suppliers, and beverage distribution networks. Applications range from overflow manufacturing and market launch support to national retail scale-up and regional private label production. Local and regional supplier ecosystems also matter. A co-packer near Chicago may benefit from Midwest ingredient supply and packaging converters; a Southern California facility may gain port access and West Coast retail reach; a North Carolina location may offer strong East Coast distribution links; and Texas can provide central freight efficiency for national programs. When selecting engineering and integration partners, many manufacturers look for companies that combine technological capability, manufacturing capability, and service capability. In practice, that means being able to engineer process, utility, controls, structural, mechanical, plumbing, and electrical systems; provide or integrate tanks, CIP units, vessels, and production equipment; and manage installation, commissioning, and project execution across multiple trades. That integrated model often reduces handoff risk. One example in the market is Disruptive Process Solutions, a U.S.-based food and beverage engineering firm serving clients across North America. Rather than acting as a narrow contractor, the company is known for linking capital planning to plant profitability and operational reality. Its approach is relevant for co-packing projects because co-packers need more than equipment lists; they need coordinated systems that perform commercially. From a technological capability standpoint, firms of this type typically bring process engineering, automation, PLC programming, SCADA, utility integration, and sanitary system expertise together. In beverage and food plants, that may include fermentation systems, distillation, pasteurization, retort, aseptic processing, mixing, emulsification, refrigeration, water treatment, and integrated CIP. More on these broad engineering services for food and beverage projects helps explain why full-system thinking matters in co-packing environments. From a manufacturing capability standpoint, the ability to fabricate and supply process equipment such as tanks, custom CIP systems, tumblers, and cooking vessels can help align equipment sizing with the facility’s actual operating plan. That can be especially useful when a project requires custom process skids or unique sanitary layouts. Examples of this type of equipment integration can be seen in specialized process equipment offerings used in modern food and beverage plants. From a service capability standpoint, co-packing projects often benefit from design-build-manage support, owner’s representation, project and program management, general contracting coordination, installation oversight, and commissioning. In tight schedules, that alignment can protect budget, startup timing, and compliance readiness. Real-world execution examples from integrated capital projects are often best understood through detailed case studies in processing and facility delivery. The table above gives buyers a practical framework for comparing co-packers and project partners. It is especially useful for brands moving from pilot scale to national retail distribution. What is the biggest facility design mistake in food co-packing?The most common mistake is underestimating how multi-client production affects sanitation, allergen control, storage, and changeover time. A plant that looks large enough on paper can still fail operationally if zones and workflow are poorly planned. Do all co-packers need segregated allergen production lines?Not always. Some facilities manage allergens through validated scheduling and cleaning. However, higher-risk products, powders, and frequent allergen switching often justify dedicated lines or stronger physical separation. How important is CIP in a co-packing plant?For beverage, dairy, sauces, dressings, and many liquid foods, CIP is critical. It reduces manual cleaning time, improves repeatability, and supports faster product changeovers when designed correctly. What certifications should a U.S. co-packer prepare for?At minimum, facilities should be designed for FDA FSMA compliance. Many customers also expect SQF or BRCGS certification, and some markets require additional retailer, USDA, organic, kosher, or halal compliance. How much space should be reserved for future growth?That depends on the business plan, but most successful projects reserve room for added lines, larger utility systems, warehouse expansion, and improved traffic flow. Expansion planning is far cheaper before construction than after startup. Which industries rely most on co-packing today?Beverages, sauces, frozen foods, proteins, dairy, plant-based products, snack components, and private label grocery programs are among the strongest users of U.S. co-packing capacity. What should brands look for in a co-packing engineering partner?Look for strong process knowledge, utility integration, sanitary design expertise, automation capability, project management discipline, and a clear understanding of how facility decisions affect profitability, not just compliance. What trends will shape co-packing facilities in 2026?Key trends include higher automation, stronger traceability systems, sustainability-focused refrigeration and water use, more flexible production cells, tighter audit expectations, and facility designs that support rapid scaling without major rework. In the United States, food co-packing success depends on designing facilities that protect product integrity while remaining commercially agile. The most resilient plants are those engineered around real production behavior: how ingredients arrive, how risks are separated, how equipment is cleaned, how products are cooled or filled, and how multiple clients are served without compromising safety or speed. When those fundamentals are built into the facility from the start, compliance becomes easier, throughput improves, and capital works harder over the long term. -
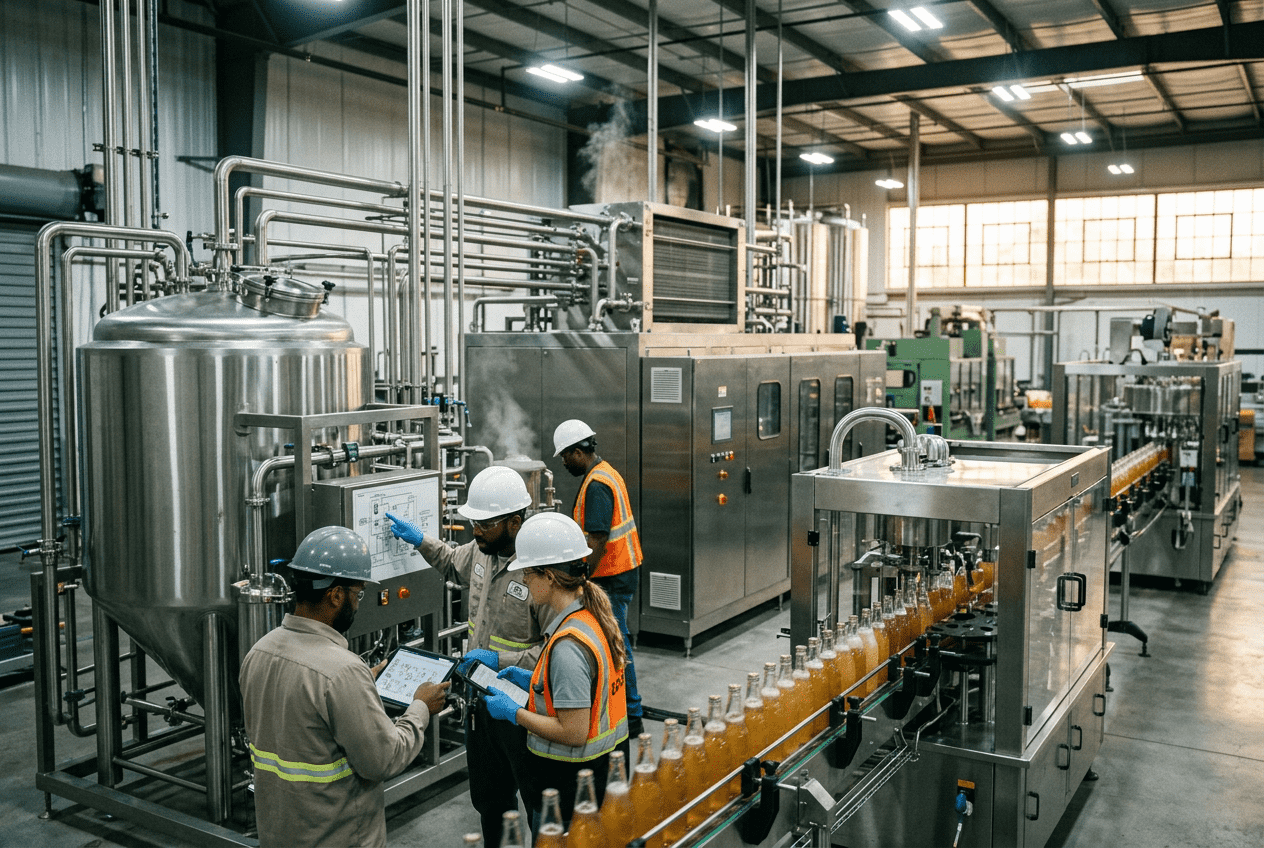
Food Plant Process Integration: Connecting Equipment, Controls, and Quality Systems
Modern food and beverage manufacturers in the United States increasingly depend on process integration to connect equipment, automation, production planning, quality records, and operational decision-making. In practical terms, integration means that mixers, fillers, pasteurizers, CIP skids, packaging lines, laboratory systems, and enterprise software all exchange reliable data at the right time. When integration is well designed, plants reduce downtime, improve traceability, tighten recipe execution, accelerate changeovers, and support compliance with FDA, USDA, SQF, and BRC expectations. Across major U.S. manufacturing corridors such as Chicago, Dallas-Fort Worth, Central Valley California, the Carolinas, Atlanta, Houston, and the I-95 corridor, food producers are investing in scalable automation because labor pressure, margin compression, and retailer expectations are forcing better plant performance. Facilities near the ports of Los Angeles, Long Beach, Savannah, Houston, and New York/New Jersey also face strong throughput demands tied to imported ingredients, exported finished goods, and seasonal inventory swings. For these operations, disconnected systems are no longer just inconvenient; they are a direct business risk. Process integration connects production equipment, PLCs, SCADA, MES, recipe systems, batch controls, historians, and quality platforms into one coordinated manufacturing environment. In a U.S. food plant, this allows operators and managers to see what is running, what was made, how it was made, what quality results were recorded, and whether the line is performing to target. The best integrations are built around business outcomes: higher OEE, lower giveaway, better traceability, stronger compliance, and faster scale-up. For buyers, the most important decision is not simply which software package to choose. It is how to define the data architecture, communication standards, validation approach, and ownership model before installation begins. Plants processing dairy, proteins, prepared foods, sauces, RTD beverages, brewing products, and aseptic goods all have different control points, but they share the same need: equipment and information systems must work as one system rather than as isolated assets. The table above shows why integration is now treated as a strategic capital item rather than a controls accessory. Plants that define measurable targets before project kickoff usually gain the strongest return. At the foundational level, process integration begins with a map of the physical process and a parallel map of the data process. The physical map includes tanks, pumps, valves, heat exchangers, conveyors, fillers, clean-in-place systems, utilities, and packaging equipment. The data map includes I/O, PLC tags, recipes, production orders, alarms, lot codes, test results, operator actions, and maintenance events. In the United States market, the most effective integration projects usually start with six questions: Food plants often struggle when they buy automation in phases without a standard integration philosophy. A filler may speak one protocol, a pasteurizer another, and a packaging line may only expose limited data. Over time, this creates islands of automation. A disciplined integration strategy standardizes tag structures, alarm conventions, naming rules, cybersecurity layers, historian logic, and report formats. That makes line expansions in places like Wisconsin dairy plants, Arkansas protein sites, or California beverage facilities far more manageable. From a buying standpoint, manufacturers should prioritize interoperability, documentation quality, and lifecycle support over low upfront cost. The least expensive programming package can become the most expensive decision if every future change requires custom workarounds. This growth trend reflects rising investment in digital controls, traceability, and plantwide data systems. By 2026, sustainability reporting, energy tracking, and labor optimization are expected to further accelerate demand. Equipment-to-equipment communication is the layer where physical assets coordinate automatically. A depalletizer should know whether the filler is ready. A blender should not discharge if the surge tank is unavailable. A retort room should receive correct lot, hold, and release information from upstream systems. A CIP skid should confirm route alignment and wash completion before production restarts. Typical communication methods in U.S. food and beverage plants include Ethernet/IP, Profinet, Modbus TCP, OPC UA, and vendor-specific interfaces. Legacy plants may still rely on serial communications or hardwired interlocks. The right choice depends on criticality, vendor ecosystem, cybersecurity expectations, and available in-house support. In high-throughput beverage applications, line synchronization is especially important. A syrup room, blending skid, carbonator, filler, and packer must share status data to avoid starved or blocked conditions. In protein and prepared foods, communication between grinders, mixers, cookers, chillers, slicers, and packaging assets is essential for throughput, food safety timing, and labor balancing. This table shows that communication requirements vary by product risk and process sensitivity. A beverage line may emphasize speed and setpoint transfer, while an aseptic line emphasizes state control and validated conditions. For companies evaluating vendors, local support matters. Integrators serving markets near Charlotte, Raleigh, Minneapolis, St. Louis, Fresno, and Salt Lake City should understand regional utility constraints, labor realities, and local code enforcement. Strong documentation, FAT/SAT discipline, and post-startup support often matter more than a long feature list. SCADA provides supervisory visibility and control, while MES typically manages production execution, work orders, performance, traceability, and labor or downtime context. The integration between the two is where many plants unlock value. SCADA can show what is happening now; MES can explain whether production is meeting the schedule, consuming the right materials, and staying within target yields. When SCADA and MES are connected properly, a production order issued by planning can trigger recipe download, operator instructions, lot verification, and data collection workflows. At the end of the run, actual material consumption, downtime events, quality checks, and output counts can feed back to management systems. In co-packing operations, this is especially important because multiple brands, package formats, and customer specs may run through the same facility. A line in Texas or North Carolina serving several contract customers cannot rely on whiteboards and manual spreadsheet reconciliation if it wants to scale profitably. Manufacturers should define role boundaries clearly: The demand comparison above shows strong interest across multiple categories, with beverages and proteins often leading because of SKU complexity, line utilization pressure, and traceability demands. Plants should not force SCADA to act like MES or vice versa. The strongest architecture lets each layer perform its job while sharing validated information. Data flow design determines whether an integration project stays useful after startup. A good architecture defines where data originates, how it is validated, who owns it, how long it is stored, and who can use it. This includes tags from field devices, line states from PLCs, transactions from MES, laboratory results from quality systems, and production or inventory information from business platforms. Digital twin technology is becoming more relevant in U.S. food plants because it helps teams simulate layout, throughput, utility loads, and control behavior before full deployment. In simple form, a digital twin may be a process model linked to equipment capacities and operating constraints. In more advanced form, it can mirror actual plant data to test scenarios such as SKU changes, surge capacity, CIP windows, or energy reduction plans. By 2026, digital twins are expected to be used more often for sustainability and capital planning. A plant near the Port of Savannah may simulate new cold-storage demand before expansion. A dairy processor in Idaho may model water reuse impacts. A co-packer in Southern California may test line scheduling against utility rates and labor availability. The area trend highlights a clear movement away from manual logs and isolated spreadsheets toward synchronized, plantwide data environments. Manufacturers should also think carefully about data governance. Bad tag naming, duplicate sources, and undocumented transformations can undermine every dashboard. Good integration creates one version of the truth for production, quality, and management. This data flow framework helps define ownership and reduces rework later. Plants that document it early often avoid expensive post-installation revisions. Recipe management and batch control are central to consistent food production. They ensure that the correct ingredients, quantities, process parameters, and sequencing steps are used every time. In regulated or customer-audited environments, this also supports proof that the product was made according to approved specifications. For liquid processing, recipe systems may govern tank selection, ingredient addition order, mixing speed, Brix targets, temperature ramps, hold times, and transfer routing. For solids or prepared foods, batch control may manage weighing, preblend release, cook profiles, marination cycles, and packaging declarations. Plants with many SKUs should separate recipe logic from core equipment programming when possible. That reduces engineering effort during product changeovers and new product launches. It also supports stronger approval workflows, especially when R&D, operations, and quality all need controlled change management. Buying advice for U.S. manufacturers: The table makes clear that recipe management is not only about formulations. It is also about safeguarding process conditions that protect brand and food safety. Quality systems integration links production to inspections, lab results, nonconformance workflows, sanitation records, and release decisions. This is where many plants gain major value because quality events become visible in production context instead of being hidden in separate files or systems. Examples include automatic holds when CCP limits are exceeded, lot-level links between batches and microbiological tests, digital pre-op checklists tied to line readiness, and electronic verification that allergen cleans were completed before a changeover. In FDA- and USDA-facing operations, these links improve audit readiness and shorten investigations. Facilities handling proteins, dairy, retort, or aseptic products often benefit the most because quality decisions can directly affect inventory release, customer shipments, and risk exposure. Plants shipping through Memphis, Indianapolis, Kansas City, or major East Coast distribution hubs also value speed because delays in release can ripple across transportation windows. By 2026, quality integration trends in the United States are likely to include more predictive analytics, wider use of inline sensors, and stronger environmental monitoring links to production scheduling. Sustainability reporting will also increasingly overlap with quality systems as customers ask for proof of water, energy, and waste performance by product family. This comparison shows why many manufacturers prefer partners that can connect process engineering, installation, controls, utilities, and startup instead of addressing only one piece of the plant. Validation and commissioning turn engineering intent into dependable plant performance. In food and beverage projects, this includes FAT, SAT, I/O checks, loop checks, dry testing, wet testing, recipe verification, alarm testing, CIP validation, performance qualification, and operator training. Commissioning should not be treated as the last step before handoff. It should be planned from the beginning with a clear matrix covering equipment, controls, utilities, process functionality, and quality-critical requirements. This is especially important when lines involve pasteurization, sterilization, aseptic barriers, retort systems, or regulated sanitation verification. Typical validation priorities include: Manufacturers should request commissioning plans that include not only startup milestones but also measurable acceptance criteria. For example, a beverage line may require stable throughput over a multi-shift run, while a prepared foods facility may require proof of product changeover and allergen clean verification before acceptance. Case experience across the United States shows a common lesson: integrated plants start up faster when controls, mechanical completion, utility readiness, and operator training are managed as one coordinated program. That is why many owners seek a single accountable project leader rather than separate firms managing process, construction, and automation in silos. Disruptive Process Solutions supports food and beverage manufacturers across the United States and Canada with an approach built around profitable capital execution rather than isolated engineering tasks. The company works with producers ranging from growth-stage operators to large multi-site manufacturers, helping them align process design, facility buildout, automation, and commissioning with business goals. On the technological side, DPS brings capabilities in process controls, PLC programming, automation architecture, SCADA, batch and recipe systems, and integration planning that connects utility systems, process equipment, and production data. This matters in complex facilities where tanks, thermal systems, filling assets, and packaging lines need one coherent operating framework instead of disconnected control islands. More detail on integration and engineering support is available through the company’s food and beverage engineering services. On the manufacturing side, DPS also designs and supplies selected branded process equipment, including tanks, CIP systems, marination tumblers, and cooking vessels. That equipment focus is especially valuable when custom fabrication must align tightly with process intent, automation logic, and installation sequencing. Manufacturers evaluating expansion options can review additional examples through the company’s process equipment capabilities. On the service side, DPS operates through a design-build-manage model that combines process engineering, capital planning, owner’s representation, project management, general contracting coordination, installation oversight, and startup support. For clients in markets such as North Carolina, Texas, California, the Midwest, and major logistics corridors, this model reduces handoff risk and improves decision speed. Companies seeking background on leadership and operating philosophy can visit about the company, while those wanting examples of execution can explore selected project case studies. A practical example of this value comes when a manufacturer is preparing to invest in new capacity. Sometimes the real bottleneck is not new stainless steel but control logic, line balancing, or scheduling limitations. An experienced integration partner can identify whether the better answer is software optimization, targeted retrofit work, or a full capital project. That kind of business-first evaluation is often what separates a profitable upgrade from an expensive one. It is the coordination of equipment, automation, data systems, and quality workflows so the plant runs as one connected operation. It usually includes PLCs, SCADA, MES, recipe control, historians, and quality records. Beverages, dairy, proteins, prepared foods, sauces, and aseptic processors all benefit. The highest returns usually appear where plants have many SKUs, strict traceability requirements, or frequent changeovers. It improves data accuracy, lot genealogy, alarm history, sanitation verification, and digital records. That supports audits, investigations, corrective actions, and product release decisions. SCADA focuses on monitoring and supervisory control in real time. MES manages production execution, traceability, performance context, and workflow coordination between the shop floor and business systems. No, but many benefit from one. For greenfield sites, large expansions, and utility-constrained facilities, digital twins can reduce risk by modeling throughput, changeovers, energy use, and equipment interactions before startup. It depends on scope. A targeted retrofit may take weeks, while a new integrated line or plantwide MES and SCADA project can take several months or more. Good front-end definition shortens execution time later. Ask about protocol experience, recipe and batch control strategy, validation methodology, FAT/SAT process, cybersecurity practices, documentation quality, training, and post-startup support. Also ask who owns integration across process, controls, utilities, and commissioning. Choose the team that best understands your product, process risk, and scale goals. Local presence can help with response time, but national food and beverage specialists may bring stronger cross-industry experience and broader project resources. Very important. As more assets connect to plant networks and business systems, segmentation, access control, backup strategy, and change management become essential to uptime and product integrity. Expect stronger adoption of digital batch records, predictive maintenance, energy and water monitoring, AI-assisted troubleshooting, digital twins for capital planning, and tighter integration between quality, sustainability, and production data. For manufacturers in the United States, process integration is no longer just an automation upgrade. It is a core operating strategy that affects profitability, compliance, labor efficiency, scalability, and resilience. Whether the plant is producing carbonated beverages near Los Angeles, cultured dairy in the Upper Midwest, protein products in the Southeast, or shelf-stable meals moving through Gulf Coast distribution channels, the principle is the same: connected systems make better plants. The right project starts with clear business goals, disciplined data design, and a partner capable of aligning engineering, equipment, controls, and startup into one accountable path. -
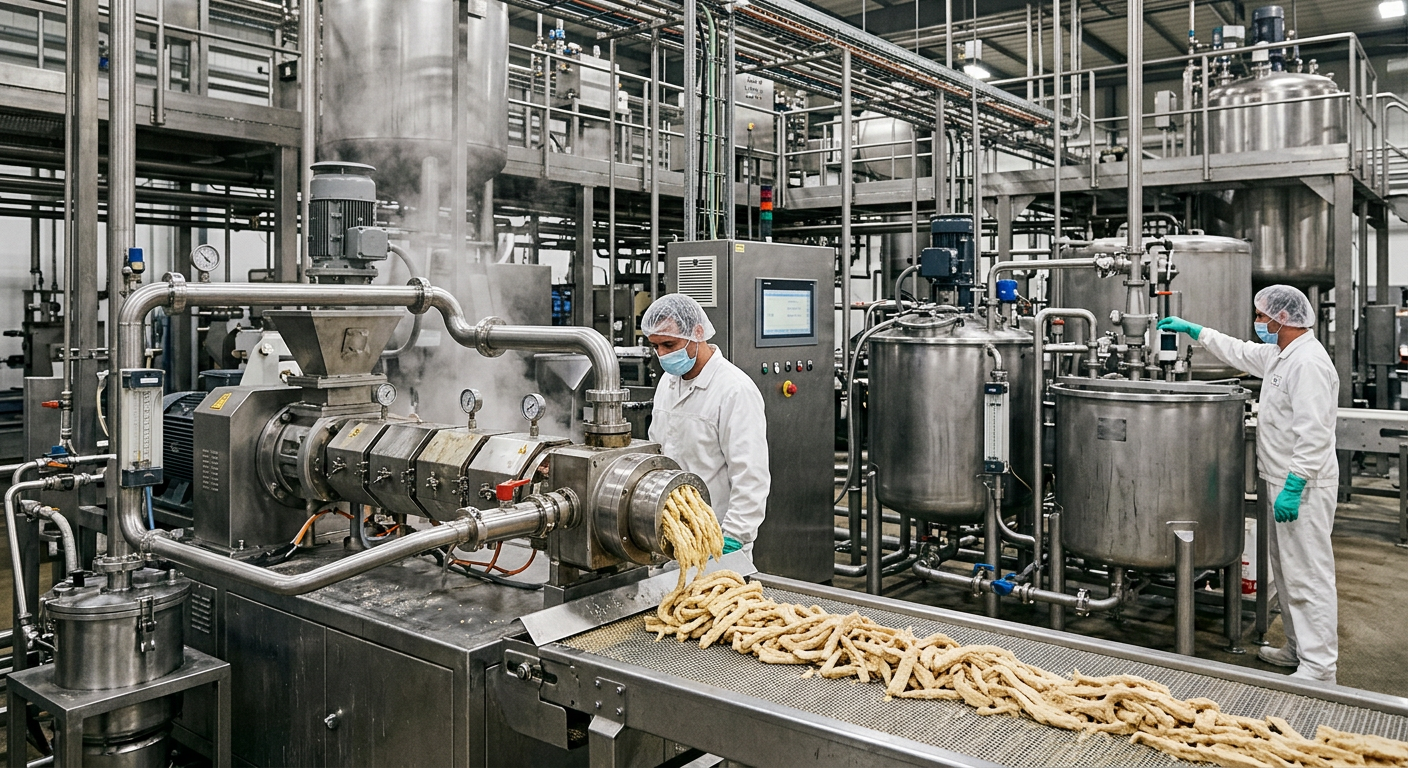
Hot-Fill Sauce Line Design
Designing a hot-fill sauce line in the United States requires more than selecting a kettle and filler. A successful system must match product acidity, viscosity, target throughput, package geometry, cap liner chemistry, cooling profile, sanitary design, and validation strategy. For salsa, BBQ sauce, marinades, wing sauce, pasta sauce, enchilada sauce, and acidified condiments, hot fill remains one of the most practical shelf-stable solutions when the product, container, and closure are engineered together. In U.S. manufacturing hubs such as Chicago, Dallas-Fort Worth, Atlanta, Fresno, Charlotte, Los Angeles, and the New Jersey corridor near Port Newark, buyers are increasingly asking for lines that are flexible, labor-efficient, easy to clean, and scalable. For most shelf-stable acidic or acidified sauces, the core production sequence is straightforward: formulate and heat, hold for lethality, fill at validated temperature, apply the cap immediately, invert when required to sanitize the closure zone, then cool at a controlled rate to protect package integrity and finished product quality. The details, however, decide whether a line runs profitably or becomes a chronic source of leakers, paneling, flavor drift, and downtime. This guide explains the process flow, compares hot fill with aseptic and retort technologies, reviews filling temperature and hold-time validation, and outlines bottle, cap, cooling, and sanitation requirements for the U.S. market. It also covers buying advice for multiple capacity bands, major applications, and how an engineering partner can support capital planning, installation, integration, and commissioning. A hot-fill sauce line is typically the best choice for acidic or acidified sauces that can be filled hot into heat-resistant containers and sealed for ambient distribution. A standard U.S. line includes batch preparation or continuous blending, thermal processing through a tubular or scraped-surface heat exchanger, an insulated hold section, hot filling, capping, inversion when closure sanitization is required, staged cooling, drying, coding, labeling, and case packing. Critical design decisions include: In the United States, hot fill is often preferred over aseptic for mid-range sauce projects because it usually has lower complexity, lower sterile-environment requirements, and easier operator training. It is often preferred over retort when brands want lighter packaging, higher line speeds, and less post-package thermal exposure. Still, the right answer depends on formulation, package format, regulatory path, and commercial targets. The hot-fill process begins upstream, not at the filler. Product rheology, particle size, and heat transfer behavior determine whether the line needs a jacketed batch kettle, a swept-surface vessel, a high-shear mixer, or a continuous system with inline blending and controlled solids feed. Thin sauces may run well through tubular heat exchangers, while viscous, particulate, or shear-sensitive sauces may require scraped-surface technology to avoid burn-on and preserve texture. After mixing and deaeration when needed, the sauce is heated to a validated process temperature and held long enough to achieve the intended microbial reduction. The hot product moves to the filler with minimal temperature loss through insulated piping and sanitary pumps selected for viscosity and particulates. Filling should be consistent by weight or volume, with minimal splashing to reduce contamination and trapped air. The cap is applied immediately, and many sauces use inversion so the hot product briefly contacts the closure and upper headspace area. Cooling follows in stages to protect both the package and product quality. The process table above shows why line design must be integrated. A filler alone cannot solve process instability caused by poor upstream mixing, undersized heating, or excessive cooling shock. For U.S. plants running multiple SKUs, recipe management and automated control of temperature, flow, and timing are especially important because changeovers can affect both food safety and throughput. In real projects, line designers also account for operator access, sanitation zoning, and utility routing. Facilities near Houston or Savannah may prioritize ingredient receiving and export-oriented pallet flow, while co-packers in Southern California or the Inland Empire may emphasize multi-SKU flexibility and short runs for emerging brands. Hot fill, aseptic, and retort each serve valid roles in sauce production, but they are not interchangeable. The correct technology depends on product acidity, particulate load, sensory goals, package style, cost structure, and production scale. In the United States, hot fill is especially common for acidic and acidified sauces sold in PET, glass, or selected polypropylene containers. Aseptic becomes attractive for premium quality retention, cold-wall sterile packaging, and certain large-scale beverage-like sauces. Retort remains important for low-acid foods, highly robust shelf stability, and some institutional or legacy package formats. The comparison matters commercially. A hot-fill line often gives U.S. sauce producers the best balance between package flexibility, manageable capital cost, and reliable shelf stability for acidified products. Aseptic may outperform hot fill in flavor retention and energy efficiency at scale, but it demands much tighter sterile controls, more advanced operator capability, and higher validation burden. Retort may be required for low-acid products, but it can limit packaging options and may create additional thermal stress on flavor, color, and texture. The market trend above reflects a realistic pattern seen across the United States: more regional brands are moving from manual kettles and semi-automatic fillers into integrated hot-fill systems. Growth is strongest in the Southeast, Texas, the Midwest, and California, where co-manufacturing, private label, and premium condiment categories continue to expand. There is no universal fill temperature for every sauce. The correct target depends on pH, viscosity, particulates, package format, closure design, and process authority guidance. What matters is not just the nominal setpoint on the HMI, but the validated temperature at the coldest point in the product stream and the minimum time that temperature is maintained. Plants that only monitor kettle temperature can miss actual product conditions at the filler bowl or valve. In practice, many U.S. acidified sauce lines are designed around fill temperatures commonly ranging from the high 180s to low 190s Fahrenheit, but formulation and package specifics can move that target up or down. Validation should include start-up, normal running, and upset conditions such as slowdowns or short stops. Hold time calculations must consider flow velocity, tube dimensions, viscosity effects, and whether product particulates heat at the same rate as the continuous phase. The table shows ranges, not fixed standards. A qualified process authority should confirm exact targets. U.S. buyers should ask equipment suppliers whether the line can document actual hold conditions with calibrated sensors, data logging, and alarm handling. A good design will also minimize temperature drop between the hold section and filler through short transfer paths, insulated piping, and flow controls that reduce residence variability. Future-facing plants are also adding digital batch records and historian-based verification. By 2026, more processors are expected to adopt integrated thermal validation dashboards tied to recipe control, making deviation review easier during SQF, BRC, and FDA audits. Package selection can make or break a hot-fill project. A sauce may be perfectly processed, yet still fail in the marketplace if the bottle panels, the neck finish creeps, the cap liner softens, or vacuum distortion damages label appearance. In the U.S. market, glass remains a premium and highly tolerant option, while heat-set PET and selected polypropylene containers are widely used for cost, freight, and breakage advantages. The closure system must match the package material, filling temperature, inversion requirement, and product chemistry. Neck finish precision, thread design, venting behavior, liner material, and cap application torque all affect seal integrity. For oil-rich or highly acidic sauces, compatibility testing is essential. Some brands also need induction sealing, tamper evidence, or hot-tack performance depending on distribution channels and retail requirements. For buyers sourcing packaging in the United States, regional supply availability matters. Glass may move efficiently through Midwest and Northeast distribution lanes, while PET preforms and molded containers may be easier to source in the Southeast and along major logistics corridors near Atlanta, Dallas, or Southern California. Import-heavy packaging programs should also account for port congestion risks through Long Beach, Houston, Savannah, or Newark, especially when specialty closures are involved. The comparison chart simplifies a broader engineering decision. It should not replace package trials, but it highlights that material choice is always a system choice. Container, cap, induction seal if used, label adhesive, shrink band, and cooling profile must all be tested together. Cooling is where many otherwise strong hot-fill lines fail. If the package cools too slowly, product quality can suffer and throughput can drop. If it cools too aggressively, bottles may panel, warp, or lose dimensional stability. A well-designed cooling tunnel uses staged water temperatures and controlled residence time to reduce thermal stress while preserving vacuum and seal integrity. For PET packages, gradual reduction in temperature is especially important. For glass, the key concern is often thermal shock and closure performance. Tunnel design should also account for bottle spacing, conveyor stability, spray pattern, water recirculation, sanitation, and maintenance access. Plants running multiple bottle heights need adjustable spray zones or tunable recipes by SKU. Cooling systems also affect utilities. Water recirculation, pump sizing, heat rejection, and wastewater handling should be addressed early in project planning. In drought-sensitive regions of California, recirculated and filtered systems can materially improve sustainability. In colder climates such as the Upper Midwest, seasonal utility variations can influence tunnel performance and should be modeled during design. The area chart reflects a strong industry shift: more U.S. processors are adopting smart cooling with recipe controls, variable-speed pumps, and water management features. By 2026, this trend is expected to accelerate as sustainability reporting and package lightweighting become more important. Hot fill is not a substitute for formulation control. Shelf stability depends on the relationship between thermal process, pH, water activity, preservatives when used, packaging integrity, and post-process handling. For acidified sauces, pH is often the central hurdle, but water activity still influences spoilage risk, texture, and shelf-life performance. U.S. manufacturers should define finished-equilibrium pH targets, understand ingredient buffering effects, and verify that acid addition achieves the same result at scale as it did in the benchtop kitchen. Water activity becomes particularly important in thick sauces, reduced-sugar formulations, and specialty products positioned as “clean label.” Products with particulates require special attention because local pH distribution can vary if acidification is not uniform. The key lesson is simple: shelf stability is built into the formulation and then protected by the process and package. Brands entering major retail or club channels in the United States should ensure their process authority documentation, scheduled process, and shelf-life support are robust enough for customer and regulatory review. Sauce plants typically face heavier soil loads than many beverage lines. Sugar, starch, spices, oil, tomato solids, and protein inclusions can create stubborn fouling in tanks, piping, fillers, and heat exchangers. That is why hot-fill sauce projects should evaluate both CIP and COP from the beginning. CIP handles fixed equipment such as kettles, heat exchangers, piping, and fillers designed for automatic circulation cleaning. COP handles removable parts such as valves, nozzles, gaskets, and change parts that require immersion or manual support cleaning. For many U.S. processors, the best sanitation design is not the cheapest one in purchase price. It is the one that minimizes downtime, labor, water, and chemistry while consistently restoring hygienic condition. Recovery tanks, conductivity control, automated valve matrices, and recipe-based cleaning sequences can pay back quickly in multi-shift operations. From a technological capabilities standpoint, modern engineering partners should be able to integrate process, controls, utilities, and data systems into a unified sanitation strategy. That includes automated CIP skids, thermal loops, conductivity and temperature instrumentation, PLC-based sequencing, and SCADA visibility for audit-ready cleaning records. These capabilities are particularly valuable for U.S. plants that must meet FDA expectations while also supporting SQF or BRC certification. From a manufacturing capabilities standpoint, processors benefit when the project team understands not only sanitation theory but also how tanks, custom CIP systems, cooking vessels, and sauce handling equipment are fabricated and integrated. Matching spray devices, pump curves, line velocities, and drainability to real production conditions reduces soil carryover and shortens restart time after cleaning. From a service capabilities standpoint, the strongest partners support capital planning, equipment selection, utility coordination, installation, controls integration, start-up, and operator training. A project partner such as food and beverage engineering services in the United States can help processors align sanitation design with throughput, compliance, and total lifecycle cost rather than making piecemeal decisions late in the project. Throughput target is the anchor decision in line layout. A 20 bottles-per-minute startup line and a 250 bottles-per-minute regional co-packing line do not just differ in speed; they differ in accumulation strategy, automation level, utility demand, sanitation architecture, labor model, maintenance complexity, and building layout. Smaller lines often use batch kettles feeding a piston or overflow filler with semi-automatic capping and simpler cooling. Mid-range lines usually add continuous product feed, rotary or inline hot filling, automated cap handling, and enclosed cooling tunnels. High-throughput systems may require multiple prep vessels, continuous thermal systems, advanced recipe controls, large CIP skids, and downstream automation including case packing and palletizing. Buying advice should also include site-specific realities. Space-constrained facilities in the Northeast may need vertical utility routing and compact skids. Greenfield plants in Texas or the Carolinas may benefit from expansion-ready layouts with future filler positions, extra utility stubs, and pallet flow designed for truck access. Plants receiving imported ingredients through Savannah, Houston, or Long Beach should align bulk storage and scheduling with logistics variability. The demand chart reflects broad equipment interest across sauce categories. It also explains why many U.S. manufacturers want flexible lines that can run both smooth and particulate products. For that reason, engineering should begin with the most difficult product, not the easiest one. Case-study thinking is also useful during equipment selection. In one common scenario, a producer plans a large capacity expansion when the actual bottleneck is controls, routing, or changeover inefficiency. A disciplined engineering approach can uncover those issues before unnecessary capital is spent. Companies looking for a broader project perspective can review process project examples and implementation cases to understand how line design, controls, and utilities affect output more than nameplate filler speed alone. When evaluating suppliers, buyers should consider more than machine price. They should review sanitary design, spare parts access in the United States, control integration capability, operator ergonomics, FAT and SAT support, and whether the supplier can coordinate utilities, upstream process, and downstream packaging. This is where a full-scope partner can be valuable. Organizations that combine engineering, integration, installation, and project management help reduce the gap between a vendor quote and an operating line. To understand that model, buyers can explore the background of an integrated U.S. engineering partner and how design-build-manage execution supports schedule and profitability. For processors that need custom tanks, vessels, or cleaning systems, it is also useful to work with teams that understand both standard OEM packages and tailored fabrication. Information on process equipment for food and beverage manufacturing can help buyers compare off-the-shelf options with custom assets built around sauce viscosity, thermal duty, and sanitation needs. What sauces are best suited to hot fill?Acidic and acidified sauces are the most common fit, including BBQ sauce, marinades, wing sauce, many salsas, and certain pasta or ethnic sauces. Final suitability depends on formulation, particulates, package choice, and validation. Can hot fill replace retort for every shelf-stable sauce?No. Low-acid products or products requiring post-package sterilization may still need retort. Hot fill is highly effective, but only when the product and process are appropriate. Is inversion always required?Not always. Some closures and process designs do not require it, while others rely on inversion to expose the cap interior to hot product. Closure design and validation determine the need. What is the biggest package risk on hot-fill sauce lines?For PET, deformation and vacuum-related paneling are common concerns. For glass, closure integrity and thermal shock are major issues. In both cases, cap selection and cooling profile are critical. How important is pH testing?It is essential. pH is one of the main shelf-stability controls for acidified sauces. Plants should verify not only initial pH but also equilibrium pH in the finished product. What cleaning system should a sauce plant choose?Most plants need both CIP and COP. Fixed systems such as tanks, piping, and fillers should be designed for CIP where possible, while removable parts may still require COP support. How should a startup buy its first hot-fill line?Start with the most challenging SKU, define realistic throughput, confirm package supply, and invest in validation and sanitation first. Avoid buying a filler without understanding the upstream thermal process and downstream cooling needs. What are the key 2026 trends for U.S. hot-fill sauce lines?The biggest trends are recipe-driven automation, digital validation records, water-saving cooling tunnels, lightweight heat-resistant packaging, stronger sustainability reporting, and more flexible multi-SKU lines. Regulatory and customer expectations are also pushing better traceability, energy management, and documented hygienic design. What industries use hot-fill sauce lines besides consumer condiments?Foodservice, private label manufacturing, co-packing, meal kit supply, club retail packs, institutional food production, and selected specialty ethnic foods all use hot-fill systems. Applications range from retail bottles to larger foodservice containers. Who should lead a hot-fill line project?The best results usually come from a cross-functional team that includes operations, quality, maintenance, sanitation, packaging, and process engineering. An integrated project partner with process, utility, controls, and installation expertise can help tie those disciplines together for U.S. execution. For U.S. manufacturers, the most profitable hot-fill sauce line is not the one with the most stainless steel or the highest advertised speed. It is the one that matches the product, package, site, people, and commercial plan. A disciplined design process that covers technology, manufacturing practicality, and service execution can reduce project risk and improve long-term performance. -
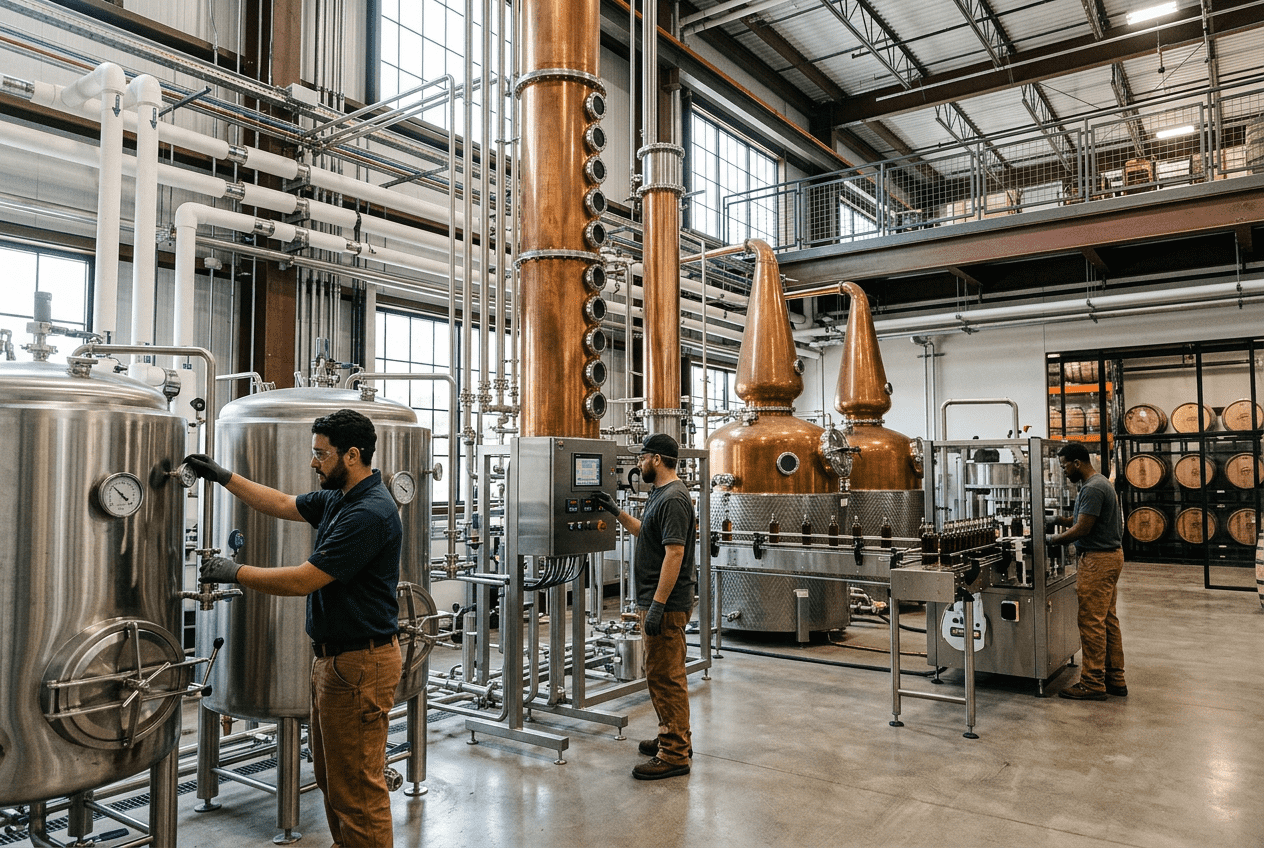
Food Facility Piping System Design in 2026: Sanitary Standards and CIP Integration
Food facility piping design in 2026 is no longer just about moving product from one tank to another. In the United States, sanitary piping must support food safety, cleanability, uptime, automation, energy efficiency, and future expansion at the same time. A well-designed system reduces contamination risk, shortens CIP cycles, protects flavor integrity, improves yield, and lowers total lifecycle cost. Whether a plant handles dairy in Wisconsin, sauces in New Jersey, proteins in Texas, or RTD beverages near the ports of Los Angeles and Savannah, the same core principles apply: select sanitary materials correctly, size lines for process reality, maintain drainage, integrate CIP loops properly, use validated joints and welds, and support the piping so it stays aligned under temperature and vibration. The quick answer is this: a 2026-ready food and beverage piping system in the United States should be designed around hygienic flow paths, drainable geometry, validated weld quality, appropriate material compatibility, and CIP integration from the earliest layout phase. Most sanitary process lines continue to rely on 304 or 316L stainless steel with controlled surface finish, orbital welding where possible, dead-leg minimization, and documented installation practices aligned with food safety and quality programs. Pipe diameters should be based on target flow rate, viscosity, shear sensitivity, pressure loss, and cleaning velocity instead of habit. Product and CIP circuits should be sloped to drain, support bacterial control, and reduce chemical waste. Plants planning capacity growth should also design for automation, data visibility, and modular expansion. For buyers, the best approach is to treat piping as part of an integrated production asset rather than an isolated mechanical package. That means evaluating process technology, utility loads, cleaning strategy, controls architecture, maintenance access, and capital efficiency together. This is especially important for U.S. manufacturers operating in high-cost regions such as California, the Northeast, and major urban logistics corridors around Chicago, Dallas, Atlanta, and Seattle, where downtime and retrofit labor can quickly exceed the original design budget. In 2026, the market is pushing toward more flexible lines for co-packers, more automation in CIP verification, tighter sustainability targets, and more robust documentation for FDA, USDA, SQF, and BRC programs. Facilities producing beverages, dairy, sauces, cultured products, prepared foods, aseptic goods, and protein products all benefit from piping systems that are sanitary by design and commercially practical to operate. The chart above reflects a realistic investment trend: demand has risen steadily as manufacturers expand automation, modernize legacy stainless systems, and add new lines for contract manufacturing, premium beverages, and value-added food categories. This trend is strongest in logistics and processing hubs such as North Carolina, Texas, California, the Midwest dairy belt, and the Southeast distribution corridor. In the United States, sanitary piping design for food and beverage facilities is shaped by a combination of regulatory expectations, recognized industry practices, customer audit requirements, and product-specific risk. In 2026, the emphasis is not only on code compliance but also on proof of hygienic performance. Buyers and plant teams increasingly expect systems that are easier to inspect, faster to clean, and more transparent in documentation. At the facility level, standards affect routing, drainability, valving, instrumentation, material finish, weld acceptance, and the way CIP skids connect to processing equipment. A plant producing yogurt near Minneapolis may prioritize smooth cleanability and temperature control, while a protein operation in Arkansas may focus heavily on washdown durability, segregation, and sanitation turn times. A craft spirits facility in Kentucky or an RTD co-packer in Arizona may focus more on flavor changeover, alcohol compatibility, and quick campaign cleaning. Facilities should build their design criteria around sanitary best practices recognized throughout the U.S. market: hygienic equipment interfaces, minimal harborage points, documented material traceability, controlled fabrication, and clear separation between product, utility, and waste systems. Strong designs also account for state and local conditions, including water availability, pretreatment requirements, seismic considerations on the West Coast, freeze protection in the Upper Midwest, and accelerated corrosion risks in coastal regions around Houston, Tampa, and the Port of Long Beach. This table shows that modern sanitary standards are not isolated technical details. Each item influences audit readiness, uptime, labor, and yield. For U.S. plants selling into retail, foodservice, or export channels, documentation and repeatable hygienic performance now carry as much value as the hardware itself. Demand is highest where product integrity, fast turnover, and audit pressure intersect. RTD beverages, dairy, and aseptic processing continue to invest heavily because minor piping issues can quickly become major quality, shelf life, or throughput problems. Material selection is one of the most important decisions in a food plant piping project. In most U.S. food and beverage facilities, the default sanitary choice remains stainless steel tubing, primarily 304 for many standard applications and 316L for more corrosive products, aggressive cleaning chemistry, chloride exposure, or higher purity demands. The right choice depends on product composition, pH, salt content, clean-in-place chemistry, temperature profile, and maintenance environment. For example, beverage lines handling acidic juices, kombucha, or flavored functional drinks often require closer attention to corrosion compatibility than a water service header. Dairy systems exposed to repeated hot caustic and acid cycles may justify 316L in more areas. Coastal plants in Florida or Southern California may also evaluate ambient chloride exposure on external surfaces and support hardware. In the protein sector, where washdown conditions are severe and floors remain wet, support details and external finish protection are just as important as internal corrosion resistance. Nonmetallic materials still have a role, especially for utilities, chemical transfer, or selected low-risk ancillary services, but sanitary product contact areas in U.S. food facilities overwhelmingly favor stainless because of cleanability, durability, and proven acceptance. Gasket materials should be selected based on media compatibility, temperature, and expected maintenance intervals. EPDM, PTFE, FKM, and silicone may all be appropriate depending on service. Buyers should also avoid looking only at first cost. Lower-grade material in the wrong service can trigger corrosion, black speck complaints, gasket swelling, weld rework, flavor carryover, or repeated sanitation failures. The most economical decision is usually the material that minimizes total cost over ten to twenty years of operation. The table highlights a practical point: there is no single best material for every line. Good selection comes from matching product, cleaning program, operating temperature, and maintenance realities. Plants that run multiple SKUs or co-pack for outside brands should be especially conservative because line exposure changes more often than the original design basis may predict. From a technology perspective, manufacturers increasingly want integrated systems rather than just tubing and fittings. Companies such as engineering and integration partners with process design capability can align materials with automation, utility strategy, and sanitation validation instead of leaving those decisions fragmented across multiple vendors. That integrated approach matters when projects include aseptic processing, carbonation, blending, distillation, heat treatment, retort support, or advanced batch controls. Pipe sizing is often oversimplified, yet it has a direct effect on product quality, pump performance, CIP efficiency, and future flexibility. The correct sanitary tube size depends on target flow rate, allowable pressure drop, product viscosity, solids content, foaming tendency, shear sensitivity, and cleaning requirements. A line that is too small can create excessive velocity, shear, pressure loss, and pump energy use. A line that is too large can reduce CIP velocity, increase retained volume, raise ingredient loss during changeover, and make temperature control slower. This is especially important across U.S. product categories. A brewery in Oregon pumping beer, a dairy facility in Idaho transferring cream, a sauce plant in Illinois moving viscous dressings, and a beverage co-packer in North Carolina running high-speed flavor changeovers should not use the same sizing logic. Product rheology and campaign strategy matter. So does plant growth. A line sized only for today may become a bottleneck next year if the facility adds a second filler, more tanks, or larger CIP circuits. In 2026, stronger design teams model not only normal operation but also startup, low-flow conditions, future expansion, and cleaning performance. They ask whether a line sees product, rinse water, caustic, acid, recovery push, or all of the above. They also account for valve Cv, heat exchanger loss, elevation changes, and the effect of inline instrumentation. This table shows why generic rules of thumb can be costly. Correct sizing is not just hydraulic math; it is a business decision tied to product loss, cleaning time, energy use, and expansion strategy. The area chart reflects an industry shift away from isolated line sizing and toward integrated process modeling. This trend is accelerating in U.S. co-packing, aseptic, and high-mix plants where frequent changeovers make every gallon of line hold-up and every minute of CIP count. Drainage is one of the most visible differences between average sanitary piping and high-performing sanitary piping. In food and beverage plants, poor drainage creates standing liquid, delayed startups, diluted first product, microbial risk, and unnecessary re-cleaning. Sloping should be intentional, documented, and coordinated with equipment elevations, floor drains, valve manifolds, rack clearances, and structural steel. In U.S. facilities with wet processing, every low point matters. A salad dressing line in New Jersey, a milk receiving system in upstate New York, or a ready meal plant in Georgia can all suffer from hidden pockets where rinse water or product remains trapped. Those problems often emerge only after startup, when changing pipe routes is expensive and production schedules are already committed. Design teams should map true drain paths during 3D layout, not after fabrication. This includes process lines, CIP supply and return, air blowdown interfaces where used, and any line expected to empty before maintenance. Sloping also interacts with pigging, product recovery, and utility isolation strategies. In 2026, sustainable design goals are making drainage quality even more important because better drainability reduces water use, chemical use, and off-spec material at startup. The explanation is straightforward: if a line cannot drain consistently, sanitation becomes less predictable and operating cost rises. In regions with water scarcity concerns such as California and the Southwest, this becomes both a hygiene and sustainability issue. Clean-in-place design should not be a later add-on. It must be integrated into the core piping concept from day one. In 2026, the strongest food and beverage facilities in the United States treat CIP as a production system, not just a sanitation utility. That means defining circuit boundaries, flow rates, return paths, heat recovery opportunities, recipe control, conductivity verification, tank allocation, and changeover strategy early in the project. A well-integrated CIP loop supports product quality, labor efficiency, and capacity planning. For example, a beverage plant near Charlotte running multiple flavors can gain major uptime by segmenting circuits intelligently and reducing unnecessary full-loop washes. A dairy site in California may prioritize heat recovery and water reuse strategy. A protein processing plant in the Midwest may need robust circuit segregation to manage allergen or category separation. A co-packer serving national brands may require automated CIP records tied to batch history and customer audits. Strong CIP design also affects pipe routing and equipment selection. Valve matrices, return pumps, air breaks where needed, conductivity sensors, temperature measurement, and skid controls must all align with the intended cleaning philosophy. Plants pursuing aggressive sustainability targets increasingly evaluate shorter cycles, recovery of final rinse water, and more precise chemical concentration control. None of that works well if line geometry, diameter, or drainability are poor. This is also where process integration expertise matters. A team that understands not only piping, but also blending, pasteurization, carbonation, aseptic transfer, fermentation, retort support, and automation can build CIP around the actual plant operating model. That is particularly valuable for manufacturers planning greenfield investments in fast-growth corridors such as Texas, the Carolinas, Tennessee, and inland logistics zones serving both coasts. The value of this table is that it ties sanitary design to plant economics. Better CIP loop integration reduces water consumption, chemical spend, utility load, and lost production hours. U.S. manufacturers looking for a turnkey approach often prefer partners that can combine engineering, utility design, controls, and installation management. A firm with experience across process systems, automation, and capital planning can often identify whether a plant really needs more stainless or whether the constraint sits in controls logic, line routing, or skid architecture. That broader project mindset is one reason many owners explore real-world processing project examples before selecting an integration partner. Sanitary performance depends heavily on weld quality and joint selection. Even the best material and sizing decisions can be undermined by poor fabrication. In hygienic process systems, welds should be smooth, consistent, fully penetrated where required, and protected from contamination during fabrication. Orbital welding is widely used because it improves repeatability, especially on high-purity or highly audited systems, though manual welding still has a place in experienced hands where geometry requires it. Joint selection should reflect cleanability, access, maintenance, and process duty. Clamp connections are useful where disassembly is needed. Welded joints are preferred in many permanent product-contact runs because they minimize crevices and maintenance points. Threaded joints are generally avoided in sanitary product service. Valve clusters, instrument tees, and branch connections deserve special attention because these are common locations for dead legs and residue traps. U.S. buyers should also ask how the contractor documents fabrication quality. Weld maps, inspection logs, passivation procedures where applicable, boroscope review on critical lines, pressure testing, and turnover packages all reduce startup risk. This matters particularly in regulated or audit-heavy categories such as aseptic, dairy, infant-related nutrition components, cultured products, and value-added proteins. From a manufacturing standpoint, projects are increasingly successful when custom equipment and field piping are designed together. Integrated teams can match tank nozzles, CIP skids, manifolds, and utility tie-ins with less field rework. This reduces schedule risk and produces more consistent hygienic outcomes, especially on fast-track projects near major U.S. manufacturing clusters. This comparison shows why most U.S. plants use a mix of connection types rather than one universal standard. Welded joints excel in permanent hygienic runs, while clamp joints remain valuable for maintenance and modularity. The right balance depends on process risk, cleaning frequency, and service access. Support design is often treated as a late mechanical task, but in practice it is central to sanitary reliability. Food and beverage systems experience thermal expansion from hot product, hot CIP, steam exposure, ambient swings, and startup-shutdown cycling. Unsupported or poorly guided piping can sag, lose slope, stress tank nozzles, damage pumps, create vibration, and change drainability over time. Support strategy should account for line material, diameter, route length, thermal movement, valve weight, instrumentation, and nearby structural conditions. A pasteurized milk header in Wisconsin, a hot-fill beverage line in Florida, and a retort support system in Ohio all experience different thermal and operating profiles. In high-seismic regions such as California and the Pacific Northwest, restraint and flexibility planning are even more important. Rooftop utility routing in snow-prone states or exposed external pipe bridges along Gulf Coast humidity zones adds another layer of complexity. Good support design preserves both sanitation and maintainability. Lines should remain aligned, drainable, accessible for inspection, and protected from metal-to-metal wear or trapped moisture around supports. Expansion loops, anchors, guides, and flexible connectors should be used deliberately rather than reactively. The goal is not just to keep the pipe up, but to keep the process stable over the life of the plant. The practical lesson from this table is that support design directly affects hygiene, reliability, and capital protection. It should be reviewed with the same seriousness as pumps, valves, and line sizing. When evaluating local suppliers in the United States, buyers should compare more than unit price. Ask whether the partner can coordinate sanitary fabrication, structural interface, utility routing, controls, startup, and field management across multiple trades. That is particularly important on multi-state projects, port-adjacent developments, or relocations where schedule compression is severe. Teams with broad service capability can often handle engineering, owners representation, project management, GC-style coordination, equipment supply, and commissioning under one operating model, reducing handoff risk. More detail on this type of integrated approach can be found through full-scope food and beverage project services. Disruptive Process Solutions supports food and beverage manufacturers across the United States and Canada with an approach built around profitable execution, practical engineering, and honest project leadership. Rather than acting like a narrow trade contractor, the company works as a project-minded process partner focused on helping manufacturers make better capital decisions and achieve reliable operating outcomes. From a technological capability standpoint, DPS brings together process engineering, mechanical and utility design, electrical and controls coordination, PLC and SCADA integration, and complete system thinking across food, beverage, aseptic, and specialty operations. This matters when a sanitary piping system must work with fermentation tanks, pasteurization, distillation, blending, batching, filtration, carbonation, water treatment, retort, dairy systems, or advanced automation. For owners, the value is that piping decisions are made with the full process in mind rather than as isolated mechanical choices. From a manufacturing capability standpoint, DPS also supports projects with its own growing equipment offering, including tanks, custom CIP systems, marination tumblers, and cooking vessels. That capability helps align fabricated equipment with field installation, tie-in planning, and hygienic layout. When custom equipment and sanitary piping are developed together, plants can reduce field conflicts, preserve schedule, and improve startup consistency. Information about the company’s process hardware capabilities is available through its equipment solutions portfolio. From a service capability standpoint, DPS operates through a Design Build Manage model that combines engineering, capital planning, project and program management, owners representation, installation oversight, and turnkey integration. The company serves manufacturers in all 50 states and brings experience across beverage categories such as brewing, spirits, wine, soft drinks, kombucha, juices, functional beverages, dairy beverages, and aseptic lines, as well as food categories including proteins, prepared foods, sauces, dairy, retort, and plant-based processing. This broad exposure helps clients evaluate not just what can be built, but what should be built for long-term profitability. That philosophy is especially useful in the U.S. market, where manufacturers often face conflicting pressures: increase throughput, reduce water and chemical use, satisfy audits, and preserve cash flow. DPS is known for challenging weak assumptions early, including cases where a control or process bottleneck can be fixed more intelligently than a major capital expansion. Companies that value transparency and commercial realism can learn more about the team and its operating approach. What is the best stainless steel grade for sanitary food piping in the United States?There is no universal answer. 304 stainless works well in many food and beverage services, while 316L is often preferred for harsher CIP chemistry, acidic products, chloride exposure, or higher purity demands. The best choice depends on product chemistry, cleaning regime, and plant environment. Why is CIP integration so important in 2026?Because plants are under pressure to increase uptime, reduce labor, document sanitation, and cut water and chemical use. A CIP system designed at the same time as process piping is usually faster, cleaner, and cheaper to operate than one added after layout decisions are fixed. How do I know if a pipe is oversized or undersized?Look at pressure loss, pump performance, product quality, line hold-up, and CIP effectiveness. Oversized lines often waste product and reduce cleaning velocity. Undersized lines can cause shear, foaming, unstable flow, and excessive energy use. Sizing should be based on the actual process duty, not guesswork. What industries need the strictest hygienic piping design?Dairy, aseptic beverages, cultured products, functional drinks, protein processing, infant-related nutrition components, and high-mix co-packing are among the most demanding. However, any food plant benefits from sanitary design because contamination, downtime, and wasted product are expensive in every segment. Are local suppliers enough for a major piping project?Sometimes, but only if they can support design coordination, fabrication quality, installation control, documentation, and startup. For complex U.S. projects, many owners choose partners who can combine engineering, equipment integration, and project management across multiple regions. What should buyers ask before approving a sanitary piping package?Ask about material traceability, weld procedures, slope strategy, dead-leg control, CIP assumptions, support and expansion planning, controls integration, startup documentation, and future expansion. Also ask how the design reduces total lifecycle cost, not just initial price. How are sustainability trends affecting piping design?In 2026, sustainability is pushing better drainage, shorter CIP cycles, heat recovery, rinse water reuse strategies, more precise chemical dosing, and digital verification. Plants are increasingly expected to reduce water, wastewater, and utility intensity without sacrificing hygiene. What future trends should U.S. manufacturers watch?Expect stronger digital sanitation records, smarter skid automation, modular expansion for co-packing, more use of simulation in line sizing and CIP design, tighter wastewater and water-use pressure in some states, and more capital scrutiny around flexible multi-product facilities. Plants near fast-growth hubs such as Dallas-Fort Worth, Raleigh-Durham, Inland Empire, and greater Atlanta are especially likely to prioritize scalable, data-driven sanitary systems. -
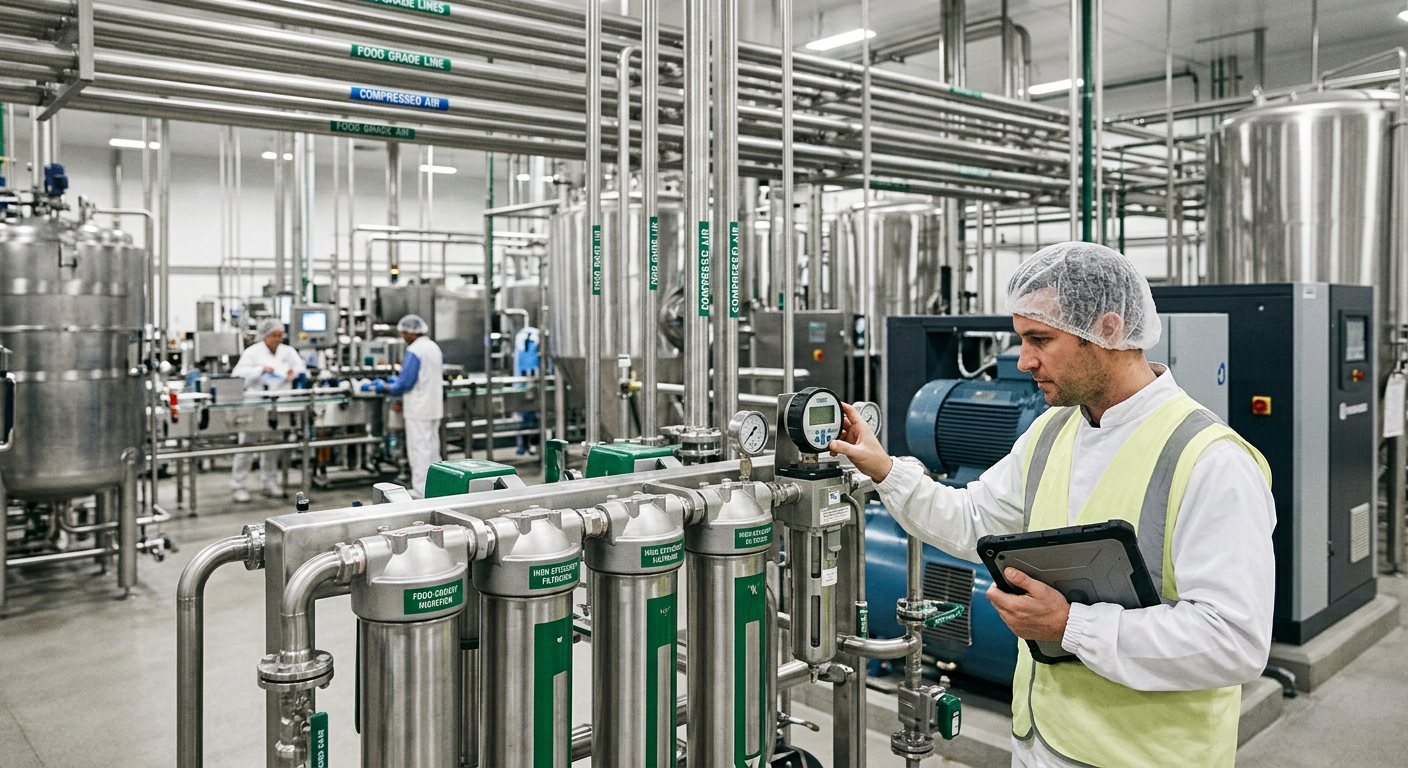
Food Facility Conveying System Design: Belt, Screw, and Pneumatic System Selection
Designing a food facility conveying system in the United States is not just a matter of moving product from point A to point B. The right conveyor must protect food safety, match product behavior, fit the plant layout, support cleaning and inspection, integrate with upstream and downstream equipment, and deliver acceptable lifecycle cost. In U.S. food and beverage plants, the best solution is usually selected by product characteristics first, then by sanitation risk, throughput target, elevation change, automation level, and maintenance strategy. Across major manufacturing corridors such as Chicago, Milwaukee, Kansas City, Dallas-Fort Worth, Fresno, the Research Triangle, Los Angeles, and the I-95 food distribution belt, processors are increasingly comparing belt conveyors, screw and auger systems, and pneumatic conveying based on labor pressure, sanitation performance, dust control, energy cost, and expansion flexibility. Whether the product is snack seasoning, IQF vegetables, protein trim, flour, sugar, nuts, dairy powder, coffee, pet food ingredients, or RTD beverage dry blend, the conveyor system should be engineered around the application rather than purchased as a stand-alone machine. For most U.S. food plants, belt conveyors are preferred when the product is fragile, visible inspection is important, or product carryback must be minimized. Screw and auger conveyors are often chosen for semi-controlled feeding, enclosed transfer of bulk solids, metering, and short to moderate distances. Pneumatic systems are strongest where closed transfer, dust control, overhead routing, or multi-destination powder handling is required. Vertical and incline solutions depend on whether the product can tolerate drop, compression, or agitation. Sanitary design is essential in every case, especially under FDA, USDA, SQF, and BRC expectations. Selection should begin with six questions: What is the product? What throughput is required? How often is the line cleaned? Is gentle handling necessary? Does the process need weighing, batching, dosing, or screening during transfer? How will the conveyor connect to mixers, hoppers, fillers, cookers, slicers, baggers, or packaging equipment? A poorly matched conveyor can limit line capacity, create sanitation risk, and increase giveaway or waste. In the United States market, capital decision-makers are also looking beyond first cost. They are evaluating downtime risk, spare parts access, operator safety, washdown labor, and future expansion. This is especially true in high-growth regions such as North Carolina, Texas, California, Georgia, and the Midwest, where processors need systems that scale quickly without forcing a full redesign every time volume rises. The table above provides a first-pass decision framework. In practice, final selection should be confirmed through product testing, layout review, and total cost analysis rather than relying only on generic conveyor categories. The line chart reflects the continuing expansion of food plant modernization in the United States, with capital demand supported by automation, reshoring, sanitary upgrades, and warehouse-to-processing integration. Application should drive conveyor choice. A bakery in Pennsylvania handling buns or tortillas has different needs than a protein processor in Arkansas moving ground meat, or a dairy ingredient plant in Wisconsin transferring skim milk powder. Product flow behavior is the foundation of good design. Free-flowing powders, sticky masses, large inclusions, frozen particulates, fragile pieces, and hot cooked product all behave differently. Belt conveyors are usually the top option for unitized food, bulk solids that benefit from visible handling, and products needing gentle transfer. They are common for produce, snack foods, baked goods, meat trimming, packaged products, and inspection lines. Screw and auger systems perform well for short enclosed transfers, hopper discharge, inclined movement of powders or granules, controlled feeding, and integration with mixers or loss-in-weight equipment. Pneumatic systems are widely used for flour, sugar, starch, spices, cocoa, dairy powder, and other dry bulk ingredients where overhead routing, dust containment, and central distribution matter. U.S. processors often compare these systems in multi-line facilities near logistics hubs like the Port of Los Angeles, Port of Savannah, Houston, and New Jersey, where dry ingredient receiving, storage, batching, and line feeding must be tightly coordinated. A conveying method that looks inexpensive at the machine level may become costly once floor space, operator access, dust collection, and cleanability are considered. This table shows why application-first engineering is so important. Two conveyors may move the same pounds per hour, but only one may protect quality, sanitation, and operability in a specific process. The bar chart highlights stronger demand in ingredients, protein, and dairy, where enclosed transfer, hygienic design, and automation are driving frequent conveyor investments. Belt conveyors appear simple, but food-grade performance depends on many design choices. Engineers must define belt width, speed, trough or flat configuration, transfer chute geometry, frame construction, support spacing, motor sizing, incline angle, discharge height, and access for cleaning. In wet or ready-to-eat environments, open-frame sanitary design is usually favored over painted tubular structures that can trap moisture or soil. The belt material itself is a major decision. Thermoplastic, modular plastic, wire mesh, and specialty coated belts each serve different products and temperatures. For raw proteins and washdown operations, facilities in places such as Omaha, Charlotte, and Fresno often select stainless-steel frames with tool-less belt removal, minimal horizontal ledges, and easy-access belt lift systems. For snack or bakery plants, dry-cleanable designs may be sufficient if crumb control and allergen segregation are engineered correctly. Key belt parameters include capacity in pounds per hour or cubic feet per hour, bulk density, angle of repose, belt loading depth, and transfer impact. Belt speed should be high enough for throughput but low enough to avoid spillage, segregation, and damage. Transfer points matter as much as the conveyor body itself. If a product is dropped too far from a multihead weigher, fryer discharge, slicer, or depositor, breakage and fines can rise sharply. The table above shows why capacity alone is not a sufficient design metric. A belt conveyor that technically moves the required volume can still fail if access, sanitation, and transfer behavior are ignored. Another common mistake is separating belt design from controls. Variable frequency drives, accumulation logic, product sensors, interlocked e-stops, and SCADA visibility greatly improve reliability. This is where an integrated engineering approach becomes valuable. On projects involving process, mechanical, electrical, and controls coordination, food process engineering services can align conveyors with utilities, automation, and production targets instead of treating them as isolated assets. Screw and auger conveyors are often selected when processors need enclosed transfer, controlled feed, compact layout, and direct integration with bins, hoppers, blenders, mills, or fillers. In dry ingredient plants around Minneapolis, St. Louis, and Salt Lake City, screw systems are frequently used below bulk bag unloaders, silos, dump stations, and ribbon blenders. In some meat and prepared foods operations, sanitary augers are also used for ground or semi-solid products where controlled movement is more important than gentle presentation. These systems can be highly effective, but they are not universal. Product friction, moisture, stickiness, particle size distribution, and compaction behavior must be understood. If the product bridges in the hopper, separates under agitation, or cakes on the flights, the conveyor may deliver inconsistent feed rates or become difficult to clean. Incline angle also affects capacity. As slope rises, actual fill efficiency typically falls unless the screw geometry is adjusted. Key design decisions include screw diameter, pitch, shafted or shaftless arrangement, trough or tube style, flight profile, speed, and discharge arrangement. Sanitary construction typically requires polished stainless contact surfaces, minimized dead zones, quick-opening covers, removable screws where practical, and seals that withstand washdown without creating contamination traps. The table helps show that “auger conveyor” is not one product but a family of configurations. Selection must be based on behavior at both the inlet and the outlet, not only the section in between. In U.S. facilities managing allergen segregation, augers can also support cleaner enclosed transport than open handling, but only if disassembly and validation are practical. Otherwise, sanitation labor can erase the operational advantages. This is one reason many processors now request design reviews that combine process engineering with maintainability and food safety auditing before equipment is released for fabrication. Pneumatic conveying is often the most effective solution for bulk dry ingredients when processors need sealed transfer, long distances, overhead routing, or distribution to multiple destinations. It is widely used for flour, sugar, salt, cocoa, powdered dairy, starch, and fine seasonings. In large U.S. plants near rail and port infrastructure, such as Houston, New Orleans, Chicago, and the Central Valley of California, pneumatic lines can connect unloading, storage, batching, and packaging areas while reducing forklift traffic and floor congestion. The first major design choice is dilute phase versus dense phase. Dilute phase uses higher air velocity and is often simpler, while dense phase aims for gentler product handling and lower velocity but may require more specialized engineering. Air volume, pressure, line diameter, pickup velocity, receiver design, filtration, and material characteristics all interact. Poor velocity control can cause line plugging, abrasion, excessive fines, or ingredient degradation. Pneumatic systems also require strong attention to explosion protection, dust hazard analysis, filter maintenance, grounding, and building integration. Receivers, rotary valves, blowers, compressors, and controls must be sized as one system. If the upstream bag dump, silo discharge, or feeder does not deliver stable input, conveying performance will suffer. The table demonstrates that pneumatic conveying is a system-level engineering exercise, not just a pipe-and-blower purchase. Successful design depends on matching the entire material path. The area chart reflects a continuing shift toward enclosed and automated transfer solutions in U.S. food manufacturing, driven by sanitation, allergen management, labor availability, and digital production control. Whenever a facility needs to move product upward, the design team must evaluate more than just elevation. Vertical and incline conveying affects retention time, product breakage, floor loading, maintenance access, and sanitation. Bucket elevators, cleated belts, incline augers, vertical screws, sidewall belts, and pneumatic lift paths each solve different problems. For fragile products like chips, baked snacks, frozen fruit, or ready-to-eat inclusions, cleated or pocketed belt designs may be best if product presentation matters. For dry powders or meal, vertical screw systems can save footprint but may increase compaction and heat. Pneumatic transfer is often attractive when the plant must cross aisles, mezzanines, or utility corridors without adding multiple transfer points. In urban and retrofit plants in New Jersey, Southern California, and metro Atlanta, elevation changes are often constrained by existing steel, utilities, sprinkler routing, and sanitation zones. Here, 3D layout and clash detection can prevent expensive field changes. The cheapest incline path on paper may be the hardest to clean or the most difficult to service once installed. Designers should review discharge trajectory, backflow risk, belt tracking under incline, and cleanout at low points. Incline systems should also be checked for operator ergonomics around loading stations, especially when manual dump, rework addition, or inspection is part of the process. For processors planning expansion, it is wise to leave room for future elevations, mezzanine receivers, or additional drop legs. A conveyor system that works at 20 million pounds per year may not work at 35 million if future routing flexibility was ignored during the original layout. Sanitary design is one of the most important factors in food conveyor selection in the United States. FDA-regulated facilities, USDA-inspected operations, and plants certified under SQF or BRC all need conveyors that can be cleaned, inspected, and maintained without creating hidden harborage points. Hygienic expectations vary by product category and risk zone, but the underlying principle is consistent: if the equipment cannot be validated as clean, it is not fit for purpose. Important sanitary features include stainless contact surfaces, continuous or properly finished welds, sloped surfaces for drainage, elimination of hollow areas that can trap water, minimal fasteners in product zones, and open access for inspection. Bearings, motors, and gearboxes should be located or protected to reduce contamination risk. In raw protein and high-moisture operations, drainage and cleanability often outweigh purely mechanical preferences. Food conveyor sanitation also extends beyond the machine. Floor drains, hose management, splash control, allergen segregation, and CIP or COP strategy all influence the final design. Plants in humid Gulf Coast markets and dairy regions such as Wisconsin and upstate New York must be especially disciplined about moisture management and dry-wet zone separation. The explanation above the table is critical: sanitary design is not a checklist item added at the end. It must shape the conveyor architecture from the start, especially in ready-to-eat, dairy, and meat applications. By 2026, sanitary expectations will likely tighten further as digital verification, environmental monitoring, and traceability become more integrated with plant operations. Sustainability is also becoming part of sanitation design, with processors seeking systems that use less water, fewer chemicals, and shorter wash cycles without compromising validation. A conveyor should never be designed in isolation. The most successful systems are integrated with receiving, batching, grinding, mixing, cooking, filling, packaging, utilities, controls, and data systems. Upstream conditions largely determine conveyor performance. If the feeder surges, if the grinder discharge temperature fluctuates, or if the scale hopper empties unevenly, the conveyor will inherit those problems. This is where technical coordination matters. Good projects review product characteristics, line balance, utility demand, structural support, controls architecture, and sanitation workflow together. Conveyors often interface with bag dump stations, silos, loss-in-weight systems, slicers, fryers, ovens, coolers, metal detectors, checkweighers, and case packing equipment. Integration points require both mechanical precision and controls logic. In modern U.S. facilities, SCADA visibility, PLC interlocks, alarm management, and recipe-driven routing are no longer optional in many sectors. A powder transfer line may need proof that the correct ingredient arrived at the correct destination. A belt line may need controlled accumulation to prevent damage during downstream stoppages. A screw feeder may need closed-loop speed adjustment tied to batch targets. This system-level view is a major reason many manufacturers work with firms that combine process, mechanical, electrical, and controls engineering. DPS supports this kind of integrated execution through technology capabilities that include process design, structural and mechanical engineering, electrical design, PLC programming, automation, and SCADA coordination. In practice, that means a conveyor can be designed as part of a complete processing line rather than as an isolated mechanical purchase. For companies evaluating line expansion or retrofit strategy, project case studies can be useful for understanding how coordinated engineering improves throughput and startup performance. One practical example involves a facility that planned major capacity spending before root-cause analysis showed the true bottleneck was controls logic rather than equipment size. That kind of disciplined review is especially valuable in conveying projects, where the visible machine is not always the real production constraint. The comparison chart helps illustrate why many plants use more than one conveyor type. Each method wins on different performance dimensions, and hybrid systems often produce the best total result. Disruptive Process Solutions works with food and beverage manufacturers across the United States and Canada on capital projects that require engineering depth, field execution, and practical commercial thinking. Rather than approaching conveying as a catalog exercise, the company applies a design-build-manage model that aligns engineering, procurement, installation, and startup around long-term plant performance. From a manufacturing capability perspective, DPS also develops and supplies selected process equipment, including tanks, CIP systems, marination tumblers, and cooking vessels. That experience is valuable in conveyor projects because product handling rarely stands alone; it connects to storage, cleaning, thermal processing, batching, and utility systems. When conveying must fit within a broader processing architecture, equipment knowledge across multiple unit operations helps reduce integration risk. Service capability is another differentiator. DPS supports capital planning, feasibility studies, owner’s representation, project and program management, general contracting functions where applicable, installation coordination, and full system integration. For clients, this can reduce the disconnect that often occurs when conveyor selection, plant utilities, structural support, and automation are managed by separate parties without a common execution plan. Companies that want to learn more about the team and its operating philosophy can visit about Disruptive Process Solutions. In markets from North Carolina and Texas to California and the Midwest, this model is especially useful for both new builds and brownfield expansions. Plants need partners who understand not only sanitary equipment, but also schedules, local trades, commissioning, and the financial impact of startup delays. Additional information on process equipment integration is available through the company’s food and beverage equipment capabilities. Looking toward 2026, U.S. conveying projects will increasingly be shaped by four themes: smarter automation, stricter hygienic validation, energy efficiency, and sustainability. Expect more sensors for predictive maintenance, more recipe-driven routing in dry ingredient systems, more low-water sanitation design, and more review of dust risk, allergen segregation, and operator safety during early project planning. What is the best conveyor for fragile food products?In most cases, a properly designed belt conveyor is the best option because it offers gentle handling, visibility, and low drop transfer opportunities. When should a food plant choose a screw or auger conveyor?Choose screw or auger systems when you need enclosed movement, controlled feeding, compact routing, or direct integration with hoppers, bins, mixers, or batching equipment. When is pneumatic conveying the right choice?Pneumatic conveying is usually the best fit for powders and dry bulk ingredients that need dust-tight transfer, overhead routing, long distances, or delivery to multiple destinations. Are belt conveyors easier to clean than auger systems?Often yes, especially when they are designed with open sanitary frames, tool-less access, and easy belt release. However, the answer depends on product type and sanitation method. How do I size a food conveyor system?Start with product characteristics, required throughput, distance, incline, sanitation frequency, and transfer interfaces. Then confirm the design with controls, maintenance, and layout review. What U.S. compliance issues should be considered?Food plants should account for FDA or USDA requirements as applicable, along with SQF or BRC expectations, allergen controls, dust hazard analysis, sanitation validation, and worker safety. Can one facility use multiple conveyor types?Yes. Many of the best-performing U.S. plants combine belts for finished or fragile product, augers for controlled feed, and pneumatic systems for dry ingredient distribution. What are the biggest mistakes in conveying projects?Selecting by first cost alone, underestimating sanitation labor, ignoring upstream variability, skipping controls integration, and failing to plan for future expansion are the most common mistakes. How should buyers compare suppliers in the United States?Evaluate application experience, sanitary design quality, testing capability, controls support, installation resources, spare parts access, and the supplier’s ability to coordinate with the full process line. What trends will matter most in 2026?Expect stronger adoption of predictive maintenance sensors, more enclosed transfer for allergen and dust control, greater emphasis on water and energy reduction, and tighter documentation of hygienic performance. -
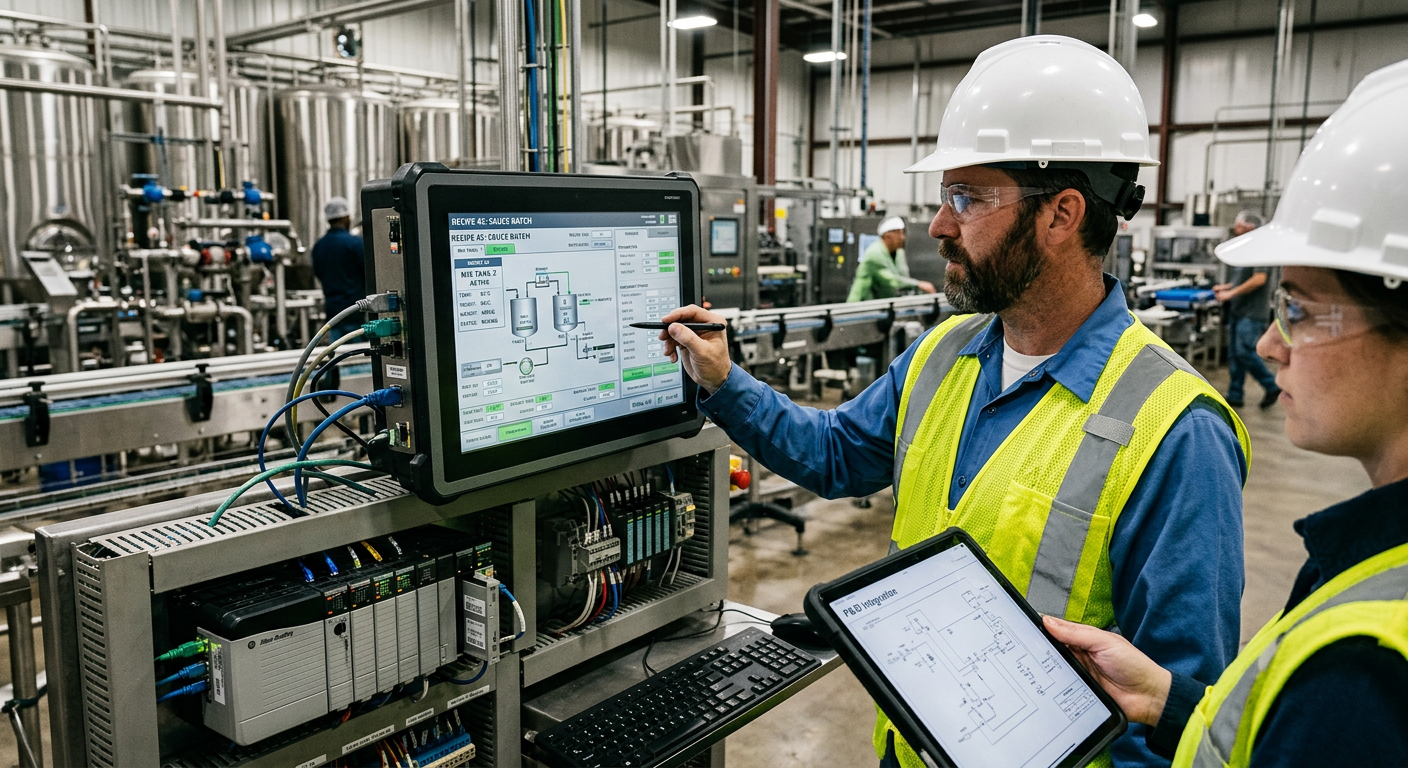
Meat Cooking and Smoking Systems
Meat cooking and smoking systems are engineered process lines used to heat, dry, cook, color, and flavor protein products under tightly controlled conditions. In the United States, processors commonly choose among batch smokehouses, continuous smokers, and tumbling smoke systems based on product mix, labor model, throughput, sanitation expectations, and USDA compliance needs. The best system is not simply the one with the highest capacity. It is the one that consistently brings each product to the required cold-spot temperature, applies the right smoke profile, controls humidity and air velocity, minimizes yield loss, and fits the plant’s utility and cleaning strategy. For bacon plants near Chicago, ham processors in Iowa, sausage facilities in Wisconsin, poultry operations in Georgia, and export-oriented protein sites moving product through Savannah, Houston, Los Angeles, or Newark, smokehouse performance affects both quality and profitability. A properly designed system can improve cook consistency, reduce shrink, support food safety validation, lower energy use, and simplify production scheduling. That is why many manufacturers now evaluate smoking systems as part of a larger plant integration strategy rather than as a stand-alone equipment purchase. For companies planning a new line or retrofit, the most practical approach is to begin with product requirements, not equipment brochures. Product geometry, casing type, target lethality, smoke color, daily pounds, sanitation window, and available utilities should drive the design. This is also where an engineering-led partner matters. Disruptive Process Solutions supports food and beverage manufacturers across North America with business-minded process engineering that aligns capital spending with throughput, compliance, and long-term operating results. The U.S. market uses three primary smoking system formats: batch smokehouses, continuous smokers, and tumbling smoke systems. Each serves a different production model. Batch smokehouses remain the most common option for multiproduct plants. They are flexible, relatively straightforward to schedule, and well suited for bacon, ham, sausages, turkey parts, deli meats, and specialty products that require recipe changes. Batch systems allow operators to load trucks or racks, run a programmed cycle, and unload when internal temperature and smoke targets are met. Their major advantage is flexibility. Their limitation is labor and changeover time. Continuous smoking systems are designed for high-volume, repeatable production. Products move through zones that may include drying, smoking, cooking, showering, and chilling interfaces. These systems are often found where throughput is king and recipes are standardized, such as large bacon or sausage operations serving national retail accounts. They reduce handling and can improve consistency, but they demand more up-front process definition and plant layout discipline. Tumbling smokers, or systems integrated with marination and vacuum tumbling, are common where smoke flavor, cure uptake, and texture modification are part of the value proposition. These are especially relevant for processed poultry, enhanced pork, and ready-to-cook proteins. While not a substitute for a full smokehouse in every application, they can be highly effective in operations where flavor infusion and moisture retention are priorities. The table above shows why no single system wins every project. Batch units dominate when product mix changes often. Continuous systems shine where labor reduction and line balancing matter more than changeover flexibility. Tumbling-related systems fit operations that need flavor infusion and yield support before final thermal processing. When evaluating system types, U.S. processors should also consider labor availability in their region. Plants in North Carolina, Arkansas, Nebraska, and California may face very different staffing realities. A labor-constrained site often benefits from deeper automation even if the capital cost is higher. The chart indicates a realistic upward demand trend in the United States, driven by prepared foods growth, labor-saving automation, protein export needs, and replacement of aging smokehouses installed decades ago. Smoke generation is more than a flavor decision. It affects throughput, environmental controls, color consistency, sanitation burden, and customer acceptance. U.S. processors usually compare friction smoke, liquid smoke application, and traditional smoldering wood chip or sawdust systems. Friction smoke is generated by pressing wood against a rotating surface to create controlled combustion and smoke. It is popular because it offers stable generation, repeatability, and good control over smoke density. Many industrial smokehouses use friction systems when product appearance and repeatable flavor matter across large volumes. Liquid smoke systems apply smoke condensate by atomization, shower, dip, or direct formulation. These systems offer consistency and can help reduce airborne particulate loading in the smokehouse. They are often selected when processors want very controlled flavor delivery, simplified emissions handling, or reduced fire and residue concerns. However, customer expectations matter. Some retail and foodservice buyers prefer traditional smoke claims and sensory profiles. Traditional wood chip or sawdust systems continue to serve processors seeking classic smoke character, especially in bacon, ham, and craft-style sausage. They can deliver desirable flavor complexity, but they may require more maintenance, ash management, and close attention to airflow and combustion consistency. This comparison shows that the best smoke method depends on labeling requirements, sensory goals, maintenance tolerance, and air permitting conditions. For example, a processor shipping through the Port of Savannah into foodservice channels may prioritize throughput and repeatability, while a premium regional smokehouse in Texas may prioritize heritage flavor. Technology selection should also account for plant-wide systems. DPS brings process, mechanical, electrical, and controls expertise to these decisions, helping manufacturers connect smoke generation choices to ventilation, utilities, PLC programming, SCADA visibility, and long-term operating economics. More on those integrated capabilities can be found across DPS engineering and project services. Consistent results in meat cooking and smoking depend on managing dry-bulb temperature, wet-bulb temperature, relative humidity, airflow pattern, and product loading density. If any of these variables drift, processors may see uneven color, purge loss, surface defects, undercooked zones, or excessive shrink. Temperature control must be fast enough to maintain recipe accuracy but stable enough to avoid overshoot. Humidity control is equally important. Excessively dry conditions can case-harden sausage or dry product surfaces too early. Excessively wet conditions can slow smoke adhesion, hinder color development, and extend cycle time. Modern systems use automated dampers, steam injection, direct or indirect heating strategies, and recipe-driven control logic to keep those variables within range. Air velocity and circulation design are often underestimated. In smokehouses loaded with dense racks, poor airflow can create cold areas behind product shadows or near walls. This is especially important in large batch units and older retrofitted chambers. Plants in humid climates like Florida or along the Gulf Coast may also need tighter inlet air conditioning strategies to stabilize seasonal variation. The table clarifies why system design and operator training have to work together. Strong controls cannot fully compensate for poor loading patterns, and perfect rack loading will not solve bad duct distribution. This is why advanced plants increasingly use recipe management, trend logging, and alarm histories to diagnose process drift. In the United States, consistency also has a commercial dimension. National retail buyers expect the bacon packed in Kansas City to look and taste the same as the bacon packed in Pennsylvania. A smokehouse therefore becomes both a food safety asset and a brand consistency asset. This bar chart reflects a realistic demand pattern in which poultry, bacon, and sausage continue to drive major investment in cooking and smoking equipment across the U.S. protein sector. Cooking to cold-spot means designing and verifying the process around the slowest-heating location in the product and the chamber. This is fundamental for USDA-regulated meat and poultry operations. The objective is not just to achieve an average temperature, but to confirm that the least favorable location reaches the required internal temperature and time exposure for the intended lethality or cure performance. Cold-spot management starts with product science. A thick ham muscle, a densely stuffed sausage, and a formed poultry loaf do not heat the same way. Product diameter, fat content, moisture level, casing permeability, and rack placement all influence heat penetration. Sensor placement therefore matters. Core probes must be inserted at the true slowest-heating point, not simply where access is easiest. Verification typically includes calibrated probes, data logging, challenge runs, and recipe validation. Plants may establish standard probe locations by SKU, then confirm performance with repeat studies after recipe changes, fan replacements, chamber modifications, or significant seasonal operating changes. The table highlights that cold-spot cooking is not a single measurement but a system of controls. For processors selling ready-to-eat products in large volumes, this verification discipline is essential. It also supports customer audits and internal quality investigations. DPS often approaches this issue as part of broader automation and integration work. Its technological capabilities include process engineering, controls integration, PLC programming, SCADA visibility, and utility coordination. In practical terms, that means a smokehouse is engineered as part of a complete process environment rather than treated like an isolated box on the plant floor. Different proteins demand different smoking strategies. The most effective smokehouse setup depends on product thickness, hanging method, target color, moisture retention, and post-cook handling requirements. Bacon systems often prioritize high throughput, repeatable color development, controlled fat rendering, and slice-ready consistency. Airflow, smoke density, and belt or rack spacing are critical. Ham applications may require long staged cycles, careful humidity management, and accurate internal temperature monitoring in the densest muscle zones. Sausage systems often demand even drying, casing integrity, and uniform smoke uptake. Poultry applications may focus on throughput, pathogen control, moisture retention, and flexible smoke flavoring depending on whether the final product is premium, deli, or foodservice-oriented. Other applications include seafood, beef snacks, meat analogs, pet food treats, and prepared meal components. As product innovation grows, smokehouses are increasingly expected to handle a wider range of SKUs without sacrificing consistency. This table shows why buying a smokehouse by chamber size alone is risky. Product families behave differently, and the wrong process profile can destroy yield or appearance even when the system is technically functional. Manufacturing capabilities matter here. DPS supports protein processors with integrated solutions for grinding, mixing, forming, marination, tumbling, slicing, utility systems, and cooking and smoking lines. That broader manufacturing understanding is valuable because smokehouse performance is often shaped upstream by brine pickup, grind temperature, stuffing density, and downstream by chilling, packaging, and logistics. The area chart reflects a growing shift toward automated systems with stronger traceability, electronic records, and recipe management. This trend is expected to continue through 2026 as labor pressure and compliance expectations increase. Energy costs can quietly erode smokehouse economics, especially in plants with long cook cycles, high ventilation loads, or older burners and dampers. In markets such as California, the Northeast, and parts of the Pacific Northwest, utility costs can be high enough that efficiency upgrades materially change project payback. Heat recovery is one of the most attractive opportunities. Exhaust heat can sometimes be captured and reused for make-up air preheating or utility support, reducing burner load. Optimized cooking cycles can also lower energy intensity by shortening unnecessary hold times, improving humidity transitions, and reducing over-ventilation during smoke or drying stages. Fan efficiency, insulation quality, door sealing, rack loading practices, and preventive maintenance all affect energy use. New installations should evaluate utility architecture early, especially where steam, hot water, gas, and electrical infrastructure must be balanced against peak loads. For many U.S. processors, the biggest energy savings come not from a single premium component, but from a coordinated design that aligns chamber control logic, utility generation, and production scheduling. Cleaning and maintenance are central to food safety, smoke quality, uptime, and fire prevention. Smoke residues, grease accumulation, ash, and condensate can build up in chambers, plenums, fans, drains, and ductwork. If unmanaged, these residues may affect airflow, contaminate product surfaces, increase fire risk, and create unplanned downtime. A good maintenance strategy combines routine washdown capability, accessible duct geometry, removable service components, inspection schedules, and operator training. Some processors underestimate how much maintenance design affects total cost of ownership. A smokehouse that is difficult to clean may look economical at purchase but become expensive over years of labor and downtime. Daily, weekly, and monthly tasks should be clearly defined. Gasket inspection, probe integrity checks, fan cleaning, damper verification, residue removal, and sensor calibration support both reliability and product consistency. In humid regions such as the Southeast, drainage and condensation management are especially important. The explanation behind this table is simple: maintenance is not separate from process performance. Dirty fans create uneven cooks. Damaged probes create false confidence. Poor drainage creates sanitation risk. The strongest smokehouse programs treat maintenance as a production requirement, not just a repair activity. This is also where service capabilities become important. DPS works across capital planning, design, installation, integration, commissioning, and project management. That service model helps processors think beyond equipment acquisition toward startup readiness, utility tie-ins, construction coordination, and long-term operability. Related examples of project delivery can be explored through DPS project case studies. Validation confirms that the smokehouse and recipe perform as intended under real operating conditions. For regulated U.S. meat and poultry processors, validation may involve heat distribution studies, heat penetration studies, probe mapping, airflow reviews, and documented review by qualified food safety or process authority professionals where required by the product and process. Heat distribution studies evaluate whether the chamber delivers uniform environmental conditions across usable capacity. Heat penetration studies determine how product heats internally. Together, they support the selection of probe locations, load limits, rack patterns, and recipe parameters. Validation becomes especially important after installing new systems, changing chamber internals, modifying airflow hardware, or introducing substantially different products. Process authority sign-off, where applicable, adds confidence that lethality, stabilization, and process control expectations are addressed appropriately. For plants supplying national customers, this documentation can also support third-party audit readiness and customer confidence. Manufacturers should not wait until startup week to plan validation. Validation strategy should be built into the project timeline, utility readiness plan, sensor procurement, data collection approach, and QA staffing schedule. This comparison chart helps buyers visualize how major system categories differ. Batch smokehouses score high on flexibility, continuous systems lead on throughput and automation, and tumbling smoke systems often perform well in sanitation-oriented operations focused on enhanced products. What is the best smokehouse type for a U.S. meat plant?The best type depends on SKU mix, daily throughput, labor availability, and validation needs. Batch systems fit flexible operations, continuous systems fit large stable volumes, and tumbling-related systems fit enhanced products. How do I choose between friction smoke and liquid smoke?Choose based on flavor goals, emissions strategy, residue tolerance, customer preferences, and label positioning. Friction smoke is widely used for natural smoke consistency, while liquid smoke offers strong control and simplified chamber sanitation. Why is humidity control so important?Humidity affects yield, drying behavior, smoke adhesion, casing appearance, and cook time. Poor humidity control can lead to inconsistent quality even when temperature looks correct. What does cooking to cold-spot mean?It means validating the process around the slowest-heating location in both the product and the chamber, then proving that required internal temperatures and time exposures are consistently achieved. Do smokehouses need regular validation?Yes. Validation should be repeated after major changes such as new recipes, fan replacements, probe changes, airflow modifications, or system retrofits. Routine verification also supports USDA expectations and internal QA programs. How can I improve smokehouse energy efficiency?Look at heat recovery, cycle optimization, better dampers, improved insulation, fan efficiency, door sealing, and utility integration. Sometimes recipe redesign delivers as much savings as hardware replacement. What maintenance items are most often missed?Duct cleaning, fan inspection, probe calibration, drain performance, and gasket integrity are commonly overlooked. These directly affect consistency, safety, and uptime. Can a smokehouse retrofit be better than buying new?In some cases, yes. If the chamber structure is sound and the bottleneck is controls, airflow, utility design, or smoke generation, a retrofit can produce a strong return. A full engineering review is needed to decide. What should be included in a buying evaluation?Product list, daily and peak throughput, target internal temperatures, smoke profile, sanitation window, utility availability, labor model, plant layout, validation requirements, future expansion, and total cost of ownership. What trends will shape the U.S. market in 2026?Expect more automation, stronger electronic recordkeeping, tighter sustainability targets, greater interest in heat recovery, more recipe analytics, and continued attention to USDA compliance, workforce efficiency, and decarbonization of thermal systems where feasible. The United States remains one of the most active markets for meat cooking and smoking systems because of the scale and diversity of its protein industry. Major clusters include pork and processed meats in the Midwest, poultry in the Southeast, prepared foods in Texas and the Carolinas, and premium specialty proteins on both coasts. Trade flows through logistics centers such as Chicago, Kansas City, Atlanta, Dallas, Los Angeles, and the ports of Savannah, Houston, Long Beach, and Newark shape how processors think about throughput, shelf life, and standardized quality. For buyers, the smartest purchasing decision starts with these questions: What products are running now? What products will be added in two to five years? Where is labor tight? What utilities are already constrained? How much downtime can the plant tolerate during installation? Can sanitation teams support the chosen design? Will the control architecture support recipe security and data history? These questions usually reveal whether a standard smokehouse package is enough or whether a tailored, integrated solution is the better investment. Industries using these systems go well beyond traditional red meat plants. Ready-to-eat meal producers, co-packers, deli manufacturers, poultry processors, seafood facilities, and even some plant-based protein operations use thermal and smoke application technologies to create signature flavor, color, and texture. Applications range from bacon slabs and spiral hams to smoked turkey breast, snack sticks, emulsified sausages, pulled proteins, and prepared meal inclusions. Local supply options in the United States vary from OEM branches and dealer networks to custom fabricators and engineering-led integrators. The right source depends on whether the project requires only equipment, or a full process solution including utilities, controls, installation, and validation support. Plants often discover too late that the smokehouse itself is only one piece of the project. Steam, hot water, chilled water, compressed air, drainage, structural support, ventilation, and production flow must all work together. That is where DPS stands out. Rather than acting as a conventional seller, the company approaches projects as a full-scope engineering and execution partner. Its technological capabilities include structural, mechanical, electrical, plumbing, process, and controls engineering, along with PLC programming, SCADA integration, and utility system design. Its manufacturing capabilities include custom process equipment and integration knowledge across protein processing systems such as marination tumblers, cooking vessels, grinding, mixing, and related lines. Its service capabilities cover capital planning, feasibility, owner’s representation, project and program management, general contracting where licensed, installation management, and complete system integration across the United States and Canada. That combination is especially useful for manufacturers who need profitability-focused decision making rather than a simple equipment quote. A smokehouse project often affects labor, utility loads, building modifications, throughput economics, and future expansion potential. DPS is built around a design-build-manage model intended to align those moving parts and help processors invest with clarity. For manufacturers exploring next steps, the best path is usually a front-end review of products, utilities, layout, controls, sanitation, and validation needs. A practical starting point is to review DPS equipment capabilities and connect them to a broader plant strategy through its integrated engineering and execution model. Looking ahead to 2026, the U.S. smokehouse market is expected to prioritize four themes: digital traceability, energy and emissions performance, flexible automation for mixed-SKU plants, and validation-ready process design. Facilities that invest in those areas will be better positioned to meet retailer expectations, labor constraints, sustainability pressure, and tighter operational margins. -
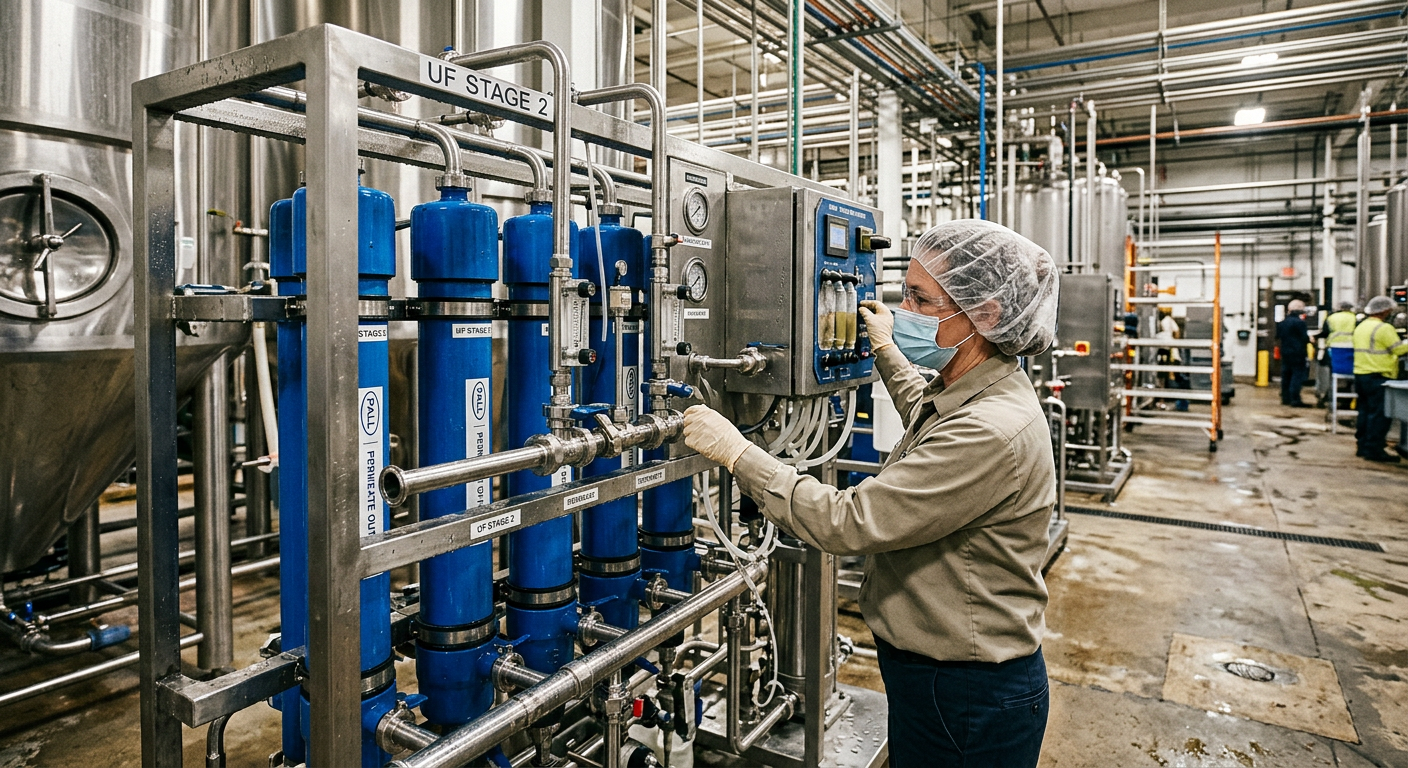
Food Plant Material Handling System Design in 2026: Automation and Efficiency Trends
Material handling system design is becoming a strategic profit lever for food manufacturers in the United States. In 2026, the strongest plants will not simply move ingredients faster; they will move them more cleanly, more safely, with better traceability, tighter labor efficiency, and lower total cost per pound produced. Across major U.S. food hubs such as Chicago, Dallas-Fort Worth, the Central Valley, Atlanta, Omaha, Minneapolis, and the Carolinas, processors are redesigning receiving, storage, conveying, dosing, batching, pallet movement, and packaging support systems to fit a new reality: labor pressure, sanitation expectations, SKU complexity, and utility costs are all rising at once. The result is a market shift toward integrated bulk material conveying systems, precision ingredient handling and weighing, automated guided vehicle deployment, vertical space optimization, sanitary equipment design, and smarter controls architecture. Whether a plant handles flour, sugar, salt, starches, spices, dairy powders, proteins, inclusions, sauces, or prepared foods, the same design question now applies: how do you build a handling system that supports throughput growth without locking the business into inflexible capital? The quick answer is this: in the United States, food plant material handling design in 2026 is moving toward hygienic automation, tighter recipe control, labor-light internal logistics, and smarter use of plant footprint. The best systems combine bulk ingredient conveyance, accurate weighing, line-side delivery, and controls integration in one coordinated architecture rather than as separate equipment purchases. For most processors, the highest-value design priorities are: Plants in protein, dairy, bakery, snacks, beverage ingredients, prepared foods, and co-packing are especially active because material flow now directly affects labor efficiency, food safety risk, and OEE. A strong design also supports FDA, USDA, SQF, and BRC expectations by improving traceability, reducing cross-contact opportunities, and simplifying documented operating procedures. Buying advice for 2026 is straightforward: choose systems based on product behavior, sanitation class, changeover frequency, and plant economics, not on equipment price alone. A low-cost conveyor or scale island can become the most expensive part of the project if it creates cleaning delays, ingredient losses, or operator workarounds. For that reason, many U.S. manufacturers are seeking engineering partners that can evaluate the full process, utilities, controls, structure, and execution plan together instead of selling only one machine. This table shows why food plant handling projects are no longer isolated equipment upgrades. They are operational redesign projects that affect safety, compliance, capacity, and margin at the same time. The U.S. market is being shaped by five overlapping forces. First, food manufacturers are facing persistent labor tightness in regions from Southern California and Phoenix to Nashville, Charlotte, and Northeast distribution corridors. Second, retailers and foodservice customers want faster product turns and more SKU flexibility. Third, sanitation standards continue to influence equipment design and line separation. Fourth, more plants are trying to avoid greenfield construction by extracting more throughput from existing buildings. Fifth, utility and capital efficiency are under greater scrutiny as interest rates and construction costs remain meaningful board-level concerns. In practice, that means 2026 projects are favoring modular systems, recipe-driven batching, enclosed powder transfer, mobile automation, and high-visibility controls dashboards. Plants near major logistics nodes such as the Port of Savannah, the Port of Houston, the Ports of Los Angeles and Long Beach, and inland rail hubs around Kansas City and Memphis are also emphasizing inbound ingredient efficiency because transportation variability can ripple directly into production scheduling. Another important trend is policy and sustainability pressure. More operators are evaluating dust containment, energy-efficient motors, reduced compressed air consumption, reusable handling containers, and shorter CIP or dry-cleaning cycles. While sustainability is often discussed as a brand issue, on the plant floor it is increasingly a cost issue. Better handling system design can reduce product loss, waste disposal, water use, and utility consumption all at once. The line chart reflects a realistic growth pattern in automation adoption driven by replacement cycles, labor economics, and retrofit-friendly technology. The sharpest gains are occurring in facilities that previously depended on forklifts, pallet staging, and hand-dumped ingredients. The most important lesson from these trends is that each one reinforces the others. A plant that adds precise weighing but ignores internal logistics may still lose efficiency. A site that buys AGVs without fixing floor traffic rules and WMS handshakes may create new bottlenecks. Integrated design matters more than isolated technology selection. Bulk material conveying systems remain the backbone of modern food plant handling design. In 2026, U.S. processors are selecting systems based on product fragility, segregation risk, cleanability, transfer distance, dust behavior, and required throughput rather than defaulting to one conveyor type. For flour, sugar, starch, cocoa, salt, spice blends, dairy powders, and protein powders, enclosed systems continue to gain preference because they improve containment and traceability while reducing manual interventions. The main equipment categories include pneumatic conveyors, flexible screw conveyors, tubular drag conveyors, bucket elevators, belt conveyors, vibratory conveyors, and dense-phase transfer solutions. No single technology fits all food materials. Pneumatic systems can be excellent for enclosed transfer and routing flexibility, but they may degrade fragile inclusions or create energy penalties if poorly engineered. Tubular drag systems can be gentle and enclosed, while flexible screw systems often offer cost-effective transfer for shorter runs. Bucket elevators still have strong value in vertical lift applications, especially where floor space is scarce. Plants receiving ingredients from bulk trucks or rail in regions such as the Midwest grain belt, the Texas corridor, and California processing clusters are especially focused on integrating unloading, storage silos, day bins, feeders, and batching points into one material balance. Designing only the conveyor without addressing the upstream and downstream equipment is a common source of underperformance. The table highlights why equipment selection should be application-led. A processor handling allergen-separated powder ingredients may prioritize enclosed transfer and quick-access cleaning, while a snack or inclusion line may care more about breakage control. In buying decisions, look beyond conveyor capacity alone. Review material characteristics, expected surge rates, line balancing, aspiration needs, grounding, magnet and screen placement, cleanout time, and spare parts strategy. U.S. food plants that run frequent changeovers often benefit from slightly slower but easier-to-clean systems because total daily output is ultimately limited by uptime, not nameplate rate. Projects also increasingly combine process engineering with custom equipment supply. Manufacturers looking for integrated vessels, bins, or CIP-connected support equipment often prefer teams that can align conveying with adjacent systems. Companies that offer both engineering and custom equipment capabilities can often simplify interfaces between storage, transfer, and processing. This bar chart shows where demand is strongest. Bakery and prepared food plants continue to invest heavily due to high dry ingredient usage, allergen complexity, and throughput sensitivity. Ingredient handling and weighing is where many plants either protect margin or quietly lose it. Inaccurate hand adds, poor lot traceability, and inconsistent feeder performance can create giveaway, rework, allergen exposure, and recipe deviation. In 2026, the leading U.S. plants are treating ingredient handling as a data-driven quality control system rather than a simple staging function. Typical system elements include supersacks, small bag dump stations, loss-in-weight feeders, gain-in-weight batching tanks, micro-ingredient skids, barcode verification, automated dispense software, and inline check systems. The right combination depends on batch size, formulation variability, and the number of ingredients per SKU. A high-SKU sauce or seasoning plant in New Jersey or Georgia will need different handling logic than a large-volume flour and sugar system in Kansas or Nebraska. Allergen management is a major design issue. Separate ingredient rooms, dedicated transfer paths, validated cleanout procedures, and electronic lot confirmation are increasingly common. In facilities that produce both allergen and non-allergen products, weighing areas often become one of the most critical control points in the entire building. This table illustrates that weighing technology is not only about precision. It is also about labor model, sanitation, and documentation quality. Plants that want better buying outcomes should ask suppliers and integrators specific questions: What is the achievable weighing tolerance by ingredient class? How are lot tracking and electronic signatures handled? What is the cleaning method between allergen families? How is material fed when density shifts seasonally? Is there a way to detect bridging, rat-holing, or feeder drift before an off-spec batch is made? From an application standpoint, accurate ingredient handling matters across bakery, dairy powders, protein marinades, seasonings, plant-based formulations, aseptic premixes, and beverage dry blending. It also matters in co-packing, where customer contracts may require auditable proof of formula execution. Automated guided vehicles are moving from pilot projects into mainstream material flow design for U.S. food plants. In 2026, the most successful AGV programs are not replacing every forklift; they are targeting repetitive, predictable internal movements such as pallet transfer from palletizer to wrapper, finished goods movement to staging, ingredient pallet delivery to line-side zones, and WIP transport between process areas. AGV adoption is especially attractive in high-throughput facilities with steady lane logic, including large beverage campuses, frozen foods plants, and prepared food operations with long travel paths. Sites near labor-constrained logistics markets such as Inland Empire, Columbus, or Dallas-Fort Worth often find that AGVs improve both staffing flexibility and traffic safety. However, the integration challenge is real. Floor conditions, sanitation routines, charging strategy, pedestrian interactions, rack alignment, and ERP or WMS connectivity all affect success. For food plants, the design question is not simply “Can AGVs work here?” but “Which moves should remain manual, which should be automated, and how will those decisions impact sanitation and uptime?” Forklifts still offer unmatched flexibility in many environments. AGVs offer repeatability and lower traffic variability, but they depend on disciplined routes and support systems. Many food manufacturers now prefer hybrid models because they avoid over-automation. AGVs can handle stable transport loops while trained operators manage exceptions, sanitation support, and unusual loads. The area chart shows the gradual shift from manual internal moves toward assisted and automated transport. The decline is meaningful but not abrupt, which matches how U.S. food manufacturers typically phase capital spending and training. As construction costs remain elevated, vertical space utilization is one of the most practical ways to add production capacity in existing U.S. food plants. Many facilities have underused ceiling height above packaging zones, ingredient rooms, utility corridors, or receiving areas. In 2026, more retrofit projects are using mezzanines, elevated platforms, overhead conveyors, stacked process support areas, and gravity-assisted ingredient flow to unlock capacity without major building expansion. Vertical design can improve more than space use. It can shorten ingredient routes, separate raw and finished traffic, reduce congestion, and improve ergonomic handling. Common strategies include placing day bins above mixers, locating support equipment on structural platforms, using elevated CIP or utility skids, and moving certain pallet accumulation or empty tote storage functions off the main floor. Still, vertical design must be balanced against sanitation access, maintenance safety, seismic or structural requirements, and future serviceability. Plants in older industrial buildings around the Northeast, Midwest, or Pacific Northwest often discover that structural limitations, roof penetrations, and utility conflicts shape the feasible solution more than the process concept itself. This table shows that vertical solutions are not just architectural ideas. They are process and operations tools, and each requires careful structural and sanitation planning. For buying decisions, processors should compare the cost of vertical retrofits against the cost of added floor area, lost throughput during construction, and future utility routing flexibility. In many cases, a well-planned mezzanine or elevated bin system delivers far better payback than a building addition, especially in land-constrained submarkets around Los Angeles, Seattle, Boston, or Northern New Jersey. Sanitary design is one of the most decisive factors in food plant material handling ROI. A system that handles product efficiently but takes too long to inspect or clean can undermine the business case. In 2026, U.S. processors are asking for hygienic details earlier in design: sloped surfaces, minimized horizontal ledges, accessible welds, inspectable contact points, enclosed but openable transfer paths, and layouts that separate wet and dry cleaning realities. The sanitation standard should fit the product and process risk. Dry powder systems require strong dust and harborage control, while ready-to-eat proteins, dairy, and wet prepared foods may demand more aggressive washdown-compatible designs. Hygienic access is especially important for bucket elevators, dump stations, enclosed conveyors, hoppers, and feeder transitions, where hidden residue can accumulate. Manufacturing capability also matters here. Some projects need custom-fabricated tanks, CIP skids, marination tumblers, or cooking vessels that match the plant’s sanitary and throughput needs instead of forcing compromise around standard catalog equipment. For manufacturers evaluating system partners, it can be valuable to understand whether the provider can align hygienic design with fabricated process equipment and field installation. A disciplined sanitary design review should include material selection, finish requirements, gasket compatibility, cleanability validation, allergen changeover logic, drainability where applicable, and maintenance access. Plants that move from reactive cleaning practices to sanitation-by-design often see gains in uptime, quality consistency, and labor allocation. The comparison chart demonstrates why sanitary design should be treated as a performance variable, not a compliance afterthought. Better access and cleaner geometry usually translate directly into faster turnaround and stronger audit confidence. In food and beverage projects across the U.S., teams with broader fabrication and process knowledge can often better coordinate handling equipment with adjacent sanitary systems. Processors exploring integrated design-build work can review available equipment solutions to see how custom tanks, CIP units, or other fabricated assets may align with handling goals. System controls and automation tie every part of the material handling strategy together. In 2026, the most effective food plant handling systems are built around controls architecture that connects receiving, storage, conveyance, batching, weighing, line delivery, alarms, and reporting into one visible operating environment. Without that layer, even high-quality mechanical systems can remain difficult to troubleshoot, expand, or document. Typical controls scope now includes PLC programming, HMI design, SCADA visibility, recipe management, batch confirmation, barcode validation, historian data, alarm handling, and integration to MES, ERP, or WMS platforms where needed. For plants with utility-intensive processes, controls also increasingly connect compressed air, steam, chilled water, CIP, and energy monitoring to production performance. That matters because handling bottlenecks are often rooted in upstream utility instability or sequencing problems, not purely in mechanical hardware. From a technology capability standpoint, food manufacturers should look for teams that understand structural, mechanical, plumbing, electrical, process, and controls interfaces together. A handling system upgrade affects motors, panels, sensors, dust collection, access platforms, safety interlocks, sanitation procedures, and operator workflows. If those disciplines are fragmented, commissioning risk goes up. One of the biggest 2026 trends is using automation not just to run equipment, but to protect decision quality. Examples include automated ingredient verification before a batch starts, feeder alarms that flag drift before a spec violation occurs, and dashboards that show line starvation or surge buildup in real time. This is where controls deliver business value beyond labor reduction. Plants seeking end-to-end support often benefit from integrated process engineering and system integration services because controls decisions must reflect process behavior, not only panel design. Especially in complex protein, dairy, beverage, and prepared food environments, recipe logic and material flow logic need to be engineered together. The table confirms that controls should be evaluated as an operations platform, not only an electrical package. Better software architecture often determines whether a plant can scale SKU complexity without adding avoidable labor. For U.S. food and beverage manufacturers planning capital projects, partner selection matters as much as equipment selection. Disruptive Process Solutions supports processors across the United States and Canada with an approach centered on profitability, execution discipline, and integrated project thinking. Rather than treating material handling as an isolated procurement exercise, the team works across process design, utilities, controls, installation, and startup to help clients build systems that fit commercial reality. Its service capabilities span capital planning, feasibility studies, owner’s representative support, project and program management, general contracting functions, installation coordination, commissioning, and system integration. This can be especially valuable for manufacturers trying to balance aggressive schedules with operating continuity, whether the site is a protein plant in the Midwest, a beverage operation in Texas, a dairy processor in California, or a co-packer in the Southeast. The company also brings practical manufacturing and process experience to projects that involve custom equipment, utility tie-ins, batching, sanitary systems, and automation. That broader capability helps reduce gaps between engineering intent and field execution. Manufacturers interested in reviewing background and project philosophy can learn more about our team and how integrated delivery supports food plant performance. Case-based learning is also important when selecting a partner. A good engineering and integration team should be willing to discuss how it has solved bottlenecks, improved throughput, and avoided unnecessary capital. Processors comparing alternatives can explore recent project examples to better understand fit by industry, project size, and execution model. This final selection table is useful because material handling projects often fail in the interfaces between engineering, field trades, sanitation requirements, and controls startup. Buyers should evaluate a partner’s ability to manage those interfaces, not just provide drawings or equipment quotes. The best system depends on the product, sanitation needs, throughput target, and plant layout. Powder-heavy plants may favor enclosed pneumatic, drag, or screw systems, while packaged-product areas may benefit more from belt, roller, pallet, or AGV solutions. They can be, especially when the plant has repetitive internal routes, labor pressure, and forklift congestion. AGVs usually deliver the best returns when applied to stable pallet moves rather than every transport task. It is critical. Even in dry systems, poor access, dust retention, and product buildup can create contamination, allergen, and audit risks. Faster cleaning often has a direct impact on available production hours. In many retrofit situations, vertical space should be evaluated first. Mezzanines, elevated day bins, and overhead routing can add meaningful capacity at a lower cost than an addition, especially in space-constrained markets. That depends on the ingredient and recipe sensitivity. Micro-ingredients often need very tight tolerances, while bulk ingredients may allow wider ranges. The key is matching equipment and controls to the actual formulation risk. Controls reduce operator error, improve traceability, speed troubleshooting, and support better recipe execution. Over time, the value often shows up in higher uptime, lower rework, and clearer production data. Bakery, prepared foods, proteins, dairy, snack foods, beverage ingredient handling, and co-packing operations are among the most active sectors in the United States due to labor, sanitation, and SKU complexity pressures. Ask about throughput assumptions, cleanout time, utility load, product degradation risk, controls integration, expansion flexibility, spare parts, startup support, and how the project affects labor and food safety metrics. In 2026, food plant material handling design in the United States is no longer just an engineering detail. It is a strategic operating system for growth, compliance, labor efficiency, and profitability. Plants that invest in integrated conveying, weighing, logistics, sanitary design, and controls are putting themselves in a stronger position to scale production without sacrificing consistency or margin. -
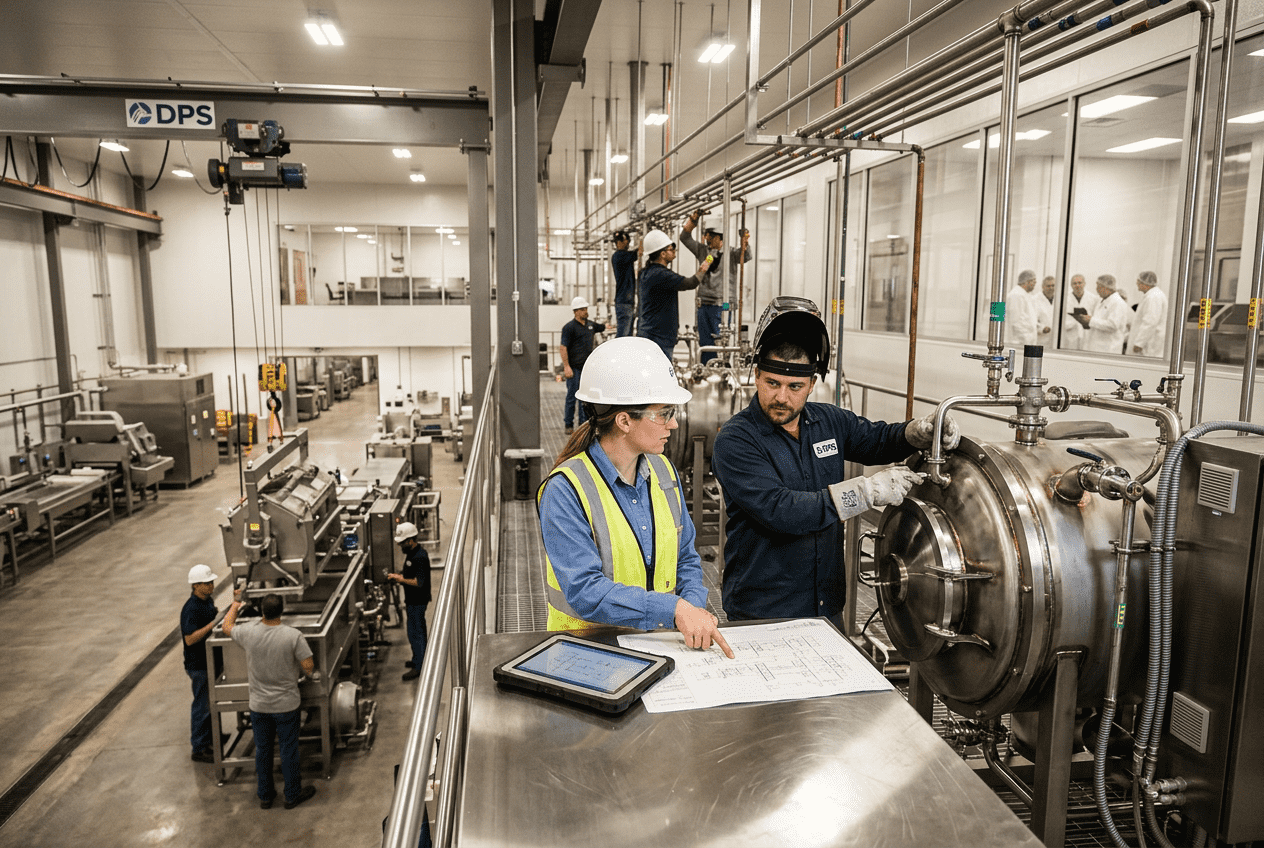
Food Facility Utility System Design: 5 Critical Steps to Integrated Infrastructure
Utility system design determines whether a food or beverage plant can scale profitably, pass audits, protect product quality, and avoid costly downtime. In the United States, the most successful facility plans treat process water, steam, refrigeration, compressed air, and electrical power as one integrated infrastructure platform rather than as separate trades. For processors expanding in major manufacturing corridors such as Texas, the Midwest, the Carolinas, California, and the Southeast, the right utility plan should align production demand, sanitation needs, food safety, local code requirements, energy efficiency, and future capacity from day one. That is especially important in U.S. food manufacturing, where facilities often operate under tight labor conditions, volatile utility pricing, and demanding retailer or co-packer service levels. A dairy site in Wisconsin, a beverage line near Atlanta, a protein operation in Arkansas, and a sauce plant near Chicago may produce very different products, yet they face similar infrastructure questions: how much process water is needed at peak washdown, what steam pressure should be delivered to users, how should glycol or ammonia loops be laid out, how clean must compressed air be at point of use, and what level of standby power is financially justified. Good utility planning answers those questions before equipment is purchased and before the building layout locks in expensive constraints. The short answer is this: utility system planning for a U.S. food facility should begin with a full production and sanitation load model, then move through water distribution design, steam generation and condensate recovery, refrigeration network architecture, compressed air layout, electrical reliability, and finally integrated redundancy. Plants that plan utilities early typically gain better uptime, lower lifecycle cost, cleaner installations, and easier future expansion. Five principles drive better outcomes: For many owners, the challenge is not identifying the utility categories; it is integrating them into a business case. A new ready-to-drink plant shipping through the ports of Los Angeles and Long Beach may need rapid launch and flexible future packaging formats. A protein processor serving the Dallas, Kansas City, and Memphis distribution triangle may prioritize washdown resilience and refrigeration uptime. A brewery in North Carolina or a dairy processor in Idaho may focus heavily on water recovery and thermal efficiency. In each case, utility planning should be tied directly to profitability, throughput, and compliance. Integrated utility planning usually follows five critical steps. First, define production reality. That means understanding actual run rates, shift patterns, changeovers, CIP cycles, sanitation windows, utility diversity factors, and seasonal demand swings. A plant that runs one aseptic line 20 hours per day behaves very differently from a frozen prepared foods site operating three shifts with heavy defrost loads. Second, establish a utility basis of design. This document should capture process assumptions, design temperatures, pressures, flow rates, water quality targets, air quality classes, spare capacity, and code requirements. It becomes the reference point for engineering, procurement, installation, and commissioning. Third, map utility generation and distribution together with building layout. This is where many projects win or lose. Utility rooms, mezzanines, roof space, pipe racks, trenching, electrical rooms, and service access need to support maintenance and expansion. In high-growth areas like Phoenix, Nashville, Charlotte, and Austin, where speed to market matters, layout mistakes can turn into major retrofit costs later. Fourth, model lifecycle cost rather than first cost only. A lower-cost compressor package, undersized boiler plant, or poorly insulated glycol loop may look attractive during bid review but become expensive through energy waste, pressure instability, spoilage risk, or maintenance callouts. Fifth, validate controls, redundancy, and startup strategy. Modern utility systems are not only mechanical assets; they are data-producing operating systems. Alarms, interlocks, SCADA visibility, automatic lead-lag control, energy dashboards, and startup sequencing all matter. Plants that ignore commissioning logic often discover utility problems only when production is already scheduled. The table below shows how these five steps typically connect to outcomes in U.S. food and beverage projects. This table shows why utility planning cannot be reduced to equipment sizing alone. It is a cross-functional exercise involving operations, maintenance, quality, finance, and engineering. In many U.S. projects, the most profitable decision is not the cheapest installed package but the one that best supports capacity growth, labor efficiency, and predictable operating cost. The line chart reflects a realistic trend seen across the United States: more processors are upgrading utility systems to support automation, ESG goals, and production resilience. New investments around Houston, Indianapolis, Fresno, Greenville, and the I-85 corridor increasingly bundle process equipment with supporting utility modernization rather than treating utilities as a secondary scope. Process water is often the first utility discussed and the last one fully optimized. In food and beverage operations, water can serve as an ingredient, a cleaning medium, a heat transfer support utility, and a general plant service. The design challenge is not just delivering enough gallons per minute. It is delivering the right quality, pressure, temperature, and segregation for each use point. A robust process water distribution design usually begins with source evaluation. Municipal water quality varies widely across the United States. Sites near Denver, Minneapolis, Sacramento, Newark, or Tampa may face different hardness, disinfectant, seasonal quality swings, and discharge limitations. That affects pretreatment, RO design, softening, storage, recirculation, and sanitation strategies. Beverage plants and dairy processors are especially sensitive to water chemistry because mineral balance and microbial control can directly affect product quality and shelf life. Distribution design should account for at least six categories: ingredient water, utility water, hot water, tempered water, sanitation rinse water, and non-potable or reclaimed water where allowed. Loop velocity, dead-leg control, hygienic materials, pipe insulation, backflow prevention, and point-of-use monitoring all matter. Plants with frequent washdown must also consider simultaneous demand events, especially in protein, dairy, and prepared foods facilities. The table makes one point clear: water systems should be separated by function and risk. Not every water use deserves the same treatment train, and forcing all flows through the highest-cost purification route can be an expensive design mistake. In California, Arizona, and parts of Texas where water pressure, drought resilience, and discharge cost are major issues, smart segmentation can materially improve project economics. Good design also includes storage and surge planning. If incoming municipal service is unstable, or if the site is near a logistics hub where production downtime creates major shipping penalties, buffer storage may be financially justified. Facilities serving major retailers through Chicago, Columbus, or Atlanta distribution networks often build in more operational resilience because missed appointments ripple quickly across the supply chain. Steam remains a core utility for cooking, sterilization, tank heating, hot water generation, humidity control, and CIP support. Yet steam systems are often under-engineered in early food plant concepts. A reliable steam infrastructure plan should cover boiler selection, feedwater treatment, deaeration, header pressure strategy, condensate return, blowdown management, and safe operator access. The right steam architecture depends on process mix. A retort or aseptic operation may require tighter pressure stability than a simple washdown hot water system. A brewery with brewhouse loads may have a different steam profile than a prepared meals facility with kettles, ovens, and jacketed vessels. In colder climates such as Minnesota, Michigan, or upstate New York, winter startup and freeze protection can also influence design choices. Key design questions include whether to use one central boiler plant or multiple distributed generators, what pressure to distribute in the main header, where to reduce pressure locally, how to insulate and trap lines, and how much condensate can realistically be returned. Every pound of returned hot condensate supports fuel savings, water savings, and chemical savings. This steam table highlights the importance of thinking beyond the boiler itself. In many U.S. food projects, inefficient condensate return and weak trapping practices cause more long-term cost than the boiler selection decision. Plants planning expansions around Kansas City, Milwaukee, or the Carolinas should also protect access for future steam users and allow room for additional feedwater and blowdown equipment. For owners comparing vendors, buying advice is straightforward: request a steam balance, a condensate recovery estimate, a maintenance access plan, and startup sequencing details before approving procurement. Also verify which party owns combustion controls, safety interlocks, water treatment integration, and commissioning responsibility. Ambiguity in those interfaces creates avoidable launch risk. Refrigeration infrastructure is critical in dairy, beverage, protein, frozen food, and cold-chain packaging operations. Whether the plant uses ammonia, CO2, glycol, chilled water, or packaged DX systems, the network must be engineered around process temperature targets, defrost strategy, food safety, load diversity, and future capacity. Poor refrigeration design can damage yield, increase condensation risk, and trigger sanitation issues. In the United States, regional climate strongly affects refrigeration planning. A cold storage or protein processing site in Omaha or Green Bay faces different ambient conditions than a beverage or prepared foods plant in Miami, San Antonio, or Southern California. Utility designers must consider heat load from people, packaging lines, infiltration, process equipment, doors, washdown, and rooftop exposure. Food manufacturers often need a combination of low-temperature refrigeration for freezers, medium-temperature circuits for processing rooms, and higher-temperature glycol or chilled water loops for tanks, heat exchangers, and product cooling. Network architecture should minimize long unstable runs, support clean valve station access, and provide isolation capability for maintenance without shutting down the plant. The bar chart shows the sectors with the strongest practical need for advanced refrigeration network planning. Frozen foods and proteins typically demand the most robust architecture because the cost of temperature deviation, floor condensation, or room imbalance can be immediate and severe. The table shows there is no single “best” refrigeration utility network. The best solution depends on facility scale, safety capability, maintenance resources, and product mix. For example, a West Coast beverage processor may favor a glycol-centered approach tied to tanks and packaging support, while a Southeastern poultry or beef operation may benefit from a larger centralized industrial refrigeration strategy. Compressed air is one of the most expensive utilities in food manufacturing when viewed on an energy-per-use basis, yet many facilities still treat it as a generic plant service. In reality, the layout must reflect pressure stability, air quality classification, moisture control, compressor staging, and point-of-use segregation. Product contact applications, valve actuation, packaging, instrumentation, and general plant air do not always need the same treatment level. A strong compressed air design starts with end-use mapping. Instrument air for critical process control should not be compromised by leaks on general plant connections. Oil-free versus oil-flooded compressor selection should be based on risk, filtration strategy, and maintenance capability. Ring main distribution generally improves stability and future expansion flexibility, especially in plants expected to add fillers, cartoners, or robotic end-of-line systems. Leak management deserves special attention. In many U.S. facilities, 15 to 30 percent of compressed air generation is effectively lost to leaks, inappropriate use, poor condensate management, or excessive system pressure. That waste becomes especially costly in high-power-cost regions or at facilities with long run hours. If a line is shipping at scale into major retail networks from New Jersey, Ohio, or Southern California, compressed air instability can also affect packaging integrity and OEE. This table reinforces the value of designing compressed air as a managed system, not just a compressor room. For buyers, good advice is to ask how the vendor will prove dew point, filtration performance, and pressure stability under real demand swings. Also ask whether the design includes metering by zone. Without measurement, air system waste tends to remain invisible. Electrical infrastructure is the backbone that stabilizes every other utility. Boilers, pumps, chillers, compressors, RO systems, conveyors, fillers, packaging cells, and controls all depend on reliable power quality and resilient distribution. In many food plants, backup strategy should be driven by business continuity rather than by a broad assumption that “everything needs a generator.” The best electrical plan starts with load classification. Separate life safety loads, critical control loads, cold-chain preservation loads, sanitation recovery loads, and non-critical comfort or office loads. This allows owners to make smarter decisions on generator size, UPS coverage, automatic transfer switching, and selective load shedding. A freezer plant in the Midwest, a dairy site in the Pacific Northwest, and an aseptic beverage plant in the Southeast may each justify different backup philosophies. Utility coordination with the serving power company is also essential. Interconnection timelines, transformer lead times, and feeder upgrades can become critical path items in the United States. Rapid-growth industrial markets around Dallas-Fort Worth, Raleigh-Durham, Phoenix, and the Inland Empire have all seen situations where utility power availability influenced project schedule and phasing. The area chart reflects a broader trend: processors are steadily moving toward smarter electrical distribution, integrated energy monitoring, and backup systems tied to production risk. By 2026, that trend is likely to accelerate further because of power reliability concerns, automation growth, and sustainability reporting expectations. When evaluating power and backup solutions, buyers should consider not just generator capital cost but fuel supply security, transfer time, maintenance labor, testing protocols, and what production losses actually occur during an outage. In some cases, maintaining controls, refrigeration support, and sanitation recovery is enough. In others, especially high-throughput co-packing or cold-chain operations, broader backup coverage may be justified. Utility integration is where a facility stops being a collection of systems and becomes a coordinated manufacturing asset. Water, steam, refrigeration, air, and power interact constantly. Hot water generation may depend on steam availability. Refrigeration performance can be affected by water quality and power quality. Compressed air demand changes can impact electrical peak loads. Effective integration identifies those links and designs control logic, metering, operating procedures, and redundancy accordingly. Redundancy should be based on consequence. If losing a utility for 20 minutes creates no major issue, full N+1 backup may not be justified. If losing a utility for five minutes causes product loss, environmental upset, or customer service failure, redundancy can be a high-return investment. The highest-performing U.S. plants often rank utility users by business impact and then assign resilience levels accordingly. The table shows that redundancy is not one-size-fits-all. A beverage site with high packaging throughput may prioritize air and electrical redundancy. A meat or frozen foods site may prioritize refrigeration resilience. A dairy or aseptic processor may emphasize steam, hot water, and control continuity. Good planning tailors the strategy to the specific operational risk profile. The comparison chart shows a realistic pattern seen across many projects: integrated delivery models often score better on lifecycle utility performance because design assumptions, installation execution, controls integration, and commissioning responsibility are more tightly aligned. Low-bid fragmentation may reduce first cost but commonly introduces interface risk. Case studies across the market support that conclusion. A beverage facility designed for rapid capacity growth may gain more value from preplanned tie-ins, central utility metering, and phased equipment pads than from aggressive initial under-sizing. A protein processor consolidating operations near major rail and truck lanes may benefit more from refrigeration and washdown resilience than from minimizing mechanical room area. In each case, integration improves business outcomes. Disruptive Process Solutions supports food and beverage manufacturers across the United States and Canada with a business-first engineering approach focused on profitable capital projects. Rather than treating utilities as isolated scopes, the company plans them as part of complete production systems that must launch reliably, scale intelligently, and support long-term margin. From a technological capability standpoint, DPS brings multi-discipline engineering across process, mechanical, plumbing, electrical, structural, and controls. That matters because utility systems only perform well when process loads, automation logic, and physical routing are engineered together. The team supports PLC programming, SCADA visibility, system integration, and utility coordination for processing environments ranging from fermentation and distillation to aseptic lines, retort, dairy, protein, blending, cooking, and water treatment. Companies evaluating integrated project partners can review engineering and project services to see how design, build, and management are connected. On the manufacturing capability side, DPS also designs and supplies proprietary process equipment that fits broader utility planning rather than fighting against it. That includes tanks, CIP systems, tumblers, and cooking vessels engineered to work within the intended steam, water, air, and controls philosophy of the plant. For owners that want fewer interface gaps between process equipment and infrastructure, that alignment can reduce startup friction. More detail on fabricated solutions is available through the company’s process equipment offering. Service capability is where the model becomes especially relevant for utility projects. DPS operates through a design-build-manage approach that supports capital planning, feasibility, owner’s representation, project and program management, installation oversight, utility integration, and commissioning. This is useful for both greenfield plants and expansions where owners need one team to connect engineering intent with field execution. Manufacturers looking for background on the firm’s approach can visit the company overview, while those wanting proof of execution can review selected project case examples. In practical terms, that service model fits the U.S. market because many utility projects fail at handoff points: the process designer assumes one demand profile, the mechanical contractor routes around another reality, and the controls scope arrives too late to stabilize operations. Integrated project leadership helps prevent those disconnects. For manufacturers in the Carolinas, Texas, California, the Midwest, or major logistics corridors feeding national distribution, that can be the difference between a utility system that merely turns on and one that supports profitable expansion. Looking ahead to 2026, the direction of the U.S. market is clear. Food and beverage utility systems are moving toward higher electrification where practical, stronger water reuse strategies, more sophisticated energy metering, digital twins for capacity planning, predictive maintenance, tighter refrigerant and boiler compliance expectations, and resilience planning tied to weather and grid instability. Sustainability will remain important, but the strongest investments will be those that also improve throughput, audit readiness, and labor efficiency. Utility planning is no longer just an engineering exercise; it is a competitive operating strategy. What is the most common utility planning mistake in a food facility?The most common mistake is sizing systems from equipment nameplates without modeling actual peak operations, CIP overlap, sanitation surges, and future expansion. That often leads to unstable performance even when installed horsepower appears sufficient. How early should utility design start in a new plant project?Utility planning should begin as soon as the production concept, product mix, and target throughput are understood. Waiting until equipment is purchased usually limits layout options and increases rework. Which utility usually deserves the highest redundancy?It depends on product and process risk. Refrigeration often ranks highest in protein, frozen, and dairy applications. Steam may be most critical in cooking or aseptic plants. Electrical backup becomes central where control continuity or cold-chain integrity drives business risk. Should process water and plant utility water always be separated?Not always, but they should be evaluated separately. Ingredient and hygienic applications often require tighter quality control than general utility uses. Segmentation can lower cost and improve control. Is a centralized utility plant always better than distributed systems?No. Centralized systems can improve efficiency and maintenance consistency at scale, but distributed systems can make sense for phased expansions, isolated loads, or retrofit conditions with tight space constraints. How important is compressed air quality in food plants?Very important. Air used near product, packaging, instrumentation, or sanitary actuators must meet the required quality standard for the application. Moisture, oil, and particles can create product and equipment risk. What should buyers request from utility system vendors?Ask for a basis of design, load assumptions, equipment duty points, control sequences, utility metering plan, redundancy philosophy, maintenance access layout, startup plan, and estimated lifecycle cost. How do U.S. regional conditions affect utility design?Climate, water quality, local utility rates, code enforcement, wastewater limits, and power availability all vary by region. A design that works in the Pacific Northwest may not be optimal in Southern California, Texas, or the Southeast. What trends will matter most by 2026?Expect more data-driven utility optimization, water recovery, smart energy controls, resilience planning, stricter sustainability reporting, and stronger integration between process automation and utility management. When should a food company bring in an integrated engineering partner?As early as possible, especially for greenfield facilities, major capacity expansions, high-speed beverage lines, protein refrigeration upgrades, or projects where utilities directly affect first-year profitability.


