-
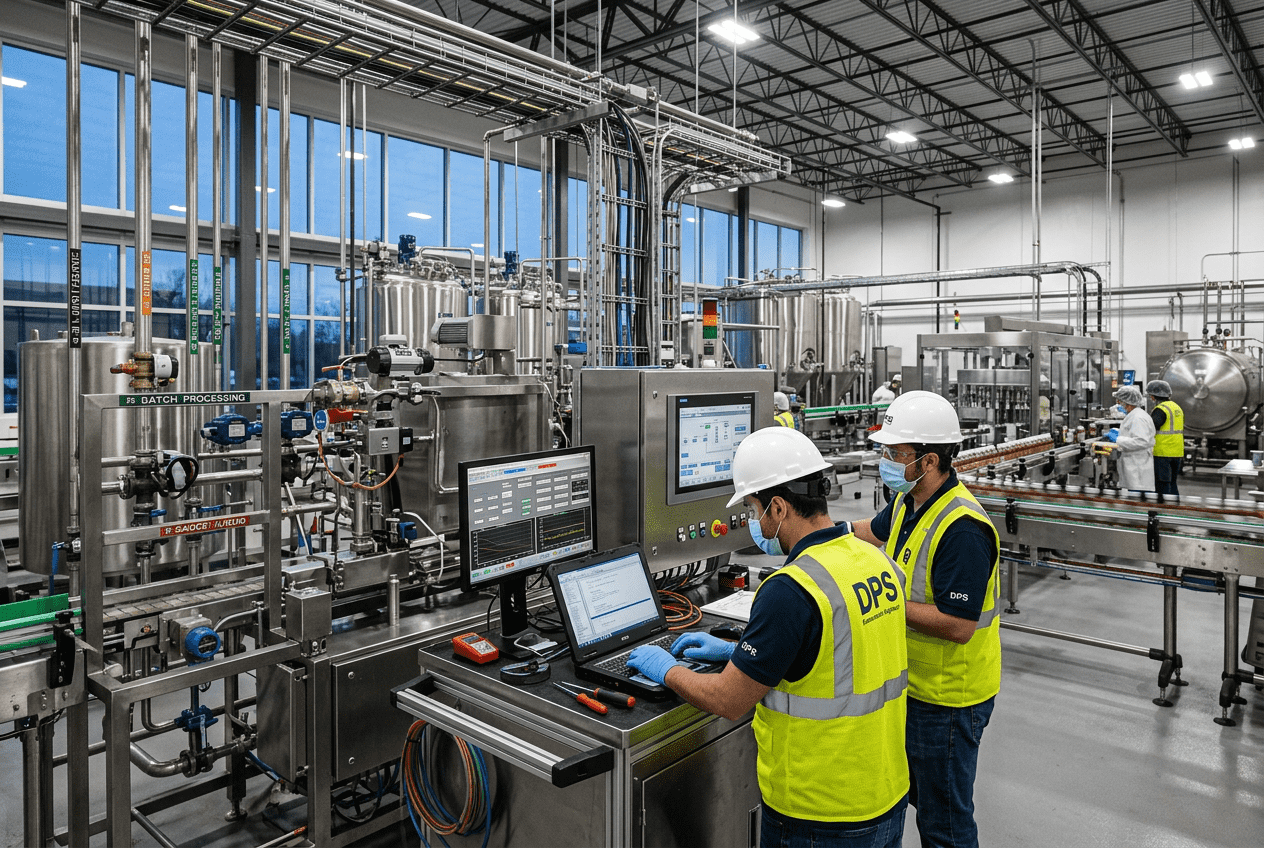
Beverage Plant Capacity Planning
Beverage plant capacity planning is the process of aligning equipment, labor, utilities, floor space, materials, and production schedules with actual and expected demand. In the United States, this means balancing seasonal peaks, retailer promotions, SKU growth, and food safety requirements while protecting margin. For beverage manufacturers, co-packers, breweries, distillers, juice processors, and ready-to-drink brands, strong capacity planning reduces overtime, avoids underused assets, improves service levels, and helps capital spending go to the real bottleneck instead of the most visible one. Capacity planning is not only about adding a faster filler or a new tank. It includes upstream processing, syrup rooms, blending, pasteurization, utilities, CIP, packaging changeovers, warehouse flow, labor availability, and controls logic. Plants in major U.S. manufacturing and logistics corridors such as Chicago, Dallas-Fort Worth, Atlanta, Charlotte, Los Angeles, Houston, and New Jersey often face very different constraints based on freight access, utility rates, labor markets, and customer networks. Facilities shipping through the Ports of Los Angeles and Long Beach, the Port of Savannah, the Port of Houston, or inland rail hubs near Memphis and Kansas City must also plan around transportation volatility, packaging lead times, and import risk. Beverage plant capacity planning is the discipline of determining how much product a facility can reliably produce, package, and ship at the required quality and cost. The best plans look beyond nameplate speeds and use real operating data such as OEE, changeover time, labor availability, utility limits, warehouse constraints, and demand variability. In practice, a U.S. beverage plant should forecast demand by product family and channel, map every process bottleneck, compare available versus required capacity, test scenarios for peak season, and then decide whether to debottleneck, add shifts, outsource, or invest in capital equipment. For buyers and operators, the smartest advice is simple: do not buy equipment before validating the true constraint. A filler may look slow, but the real issue may be line control logic, downstream accumulation, CIP duration, syrup room throughput, or package changeovers. That is one reason many manufacturers work with engineering partners that can evaluate processing, packaging, utilities, controls, and project economics together. Companies like Disruptive Process Solutions support this kind of integrated decision-making by tying capacity strategy to profitability rather than to equipment sales alone. The table above shows why beverage capacity planning must be cross-functional. Even if one area appears to have excess capacity, the plant performs only as well as its weakest link. A complete planning model should therefore evaluate process, packaging, labor, maintenance, utilities, and outbound logistics at the same time. Beverage plant capacity planning is the structured analysis used to determine whether a facility can meet market demand with existing assets or whether it needs changes in scheduling, staffing, outsourcing, controls, utilities, or capital equipment. In beverage operations, the term often covers both process capacity and packaging capacity. Process capacity refers to the plant’s ability to receive, blend, ferment, filter, pasteurize, carbonate, hold, and transfer product. Packaging capacity refers to filling, capping, seaming, labeling, cartoning, palletizing, and shipping. In the U.S. market, capacity planning is increasingly important because beverage producers are dealing with faster product cycles, more channels, and more package formats. A single plant may run cans, PET, glass, bag-in-box, kegs, pouches, or aseptic formats across alcoholic and non-alcoholic SKUs. Each format affects sanitation, line speed, change parts, labor, warehouse layout, and quality verification. A facility making kombucha, functional beverages, dairy-based drinks, juices, carbonated soft drinks, and spirits-based RTDs cannot rely on one average production number. It needs capacity models by family, by line, by shift, and by season. Well-run capacity planning also protects capital efficiency. Many operators assume the answer to growth is a bigger line, but the better solution may be system integration, a revised production sequence, improved CIP design, automation upgrades, or better material flow. This is where specialized engineering and execution teams become valuable. Through its engineering and project services, DPS works with manufacturers on processing design, utility integration, capital planning, installation, and execution management so expansion decisions are tied to real plant performance. Capacity planning should answer six core questions: This framework matters because many capital projects fail when managers compare demand to design capacity instead of to actual sustainable capacity. The explanation behind the table is straightforward: the only capacity number that matters commercially is the amount of quality product the plant can repeatedly make and deliver on time. Beverage plants face distinct planning pressures compared with many other food sectors. Two of the biggest are seasonality and SKU proliferation. Seasonality affects nearly every beverage category in the United States, but not in the same way. Carbonated soft drinks and bottled water often peak in hot weather, especially across the Sun Belt, Florida, Texas, Arizona, and Southern California. Spirits and wine may see spikes around holiday buying patterns. RTD cocktails can jump around summer events and retailer resets. Sports drinks and functional beverages are influenced by weather, promotions, and regional distribution wins. Dairy-based beverages can see different spikes around school cycles and foodservice demand. SKU proliferation is the second major challenge. Flavor extensions, pack-size complexity, limited-time launches, club-store formats, and channel-specific labels all eat into line efficiency. A plant that once ran a few high-volume SKUs may now manage dozens or hundreds. Each change creates lost time for rinsing, labeling, coding, recipe changes, quality checks, and material staging. Plants serving both e-commerce and retail also deal with different ship configurations and case packs. Seasonality and SKU growth interact in harmful ways. Peak demand usually arrives when operators are running the widest mix. That means the plant needs more flexibility exactly when efficiency is already under pressure. This is why production planning in beverage environments should group products by allergen profile, package type, carbonation, fill temperature, or change-part commonality. Sequencing runs intelligently can recover more capacity than simply forcing overtime. U.S. beverage operators also face geographic factors. Facilities in the Midwest may build inventory ahead of winter storms. Plants in hurricane-prone Gulf and Southeast regions must plan for utility interruptions and inbound delays. West Coast operations may adjust for import packaging risk through Los Angeles or Oakland. Northeast facilities often manage tighter warehouse footprints and freight costs into dense urban markets such as New York, Boston, and Philadelphia. The explanation here is practical: beverage plants do not lose capacity only because machines run slowly. They lose capacity because the product portfolio, commercial calendar, and supply chain force more interruptions into the schedule. Better planning reduces those interruptions before capital is spent. Demand forecasting is the starting point for good capacity planning. If the forecast is flawed, the plant will either carry too much cost or miss customer orders. For beverage manufacturing, the most useful approach combines statistical forecasting with commercial intelligence. Historical data alone is not enough because beverage demand often shifts due to promotions, weather, distribution gains, retailer resets, sports calendars, and new product launches. Most U.S. beverage producers should forecast at multiple levels: category, SKU family, package format, region, and customer channel. For example, a national RTD brand may need one forecast for the Southeast grocery channel, another for club stores in Texas and California, and another for on-premise or convenience channels. The planning horizon should also be layered: 18 to 24 months for capital needs, 3 to 12 months for labor and procurement, and weekly or daily planning for sequencing and finite scheduling. Common forecasting methods include moving averages, seasonal indices, regression models, collaborative planning with sales teams, and demand sensing based on near-real-time order flow. Weather-adjusted forecasting can be particularly valuable for water, energy drinks, and carbonated beverages. Event-based forecasting helps brands prepare for major sports events, holidays, or chain promotions. For new products with limited history, planners often use analog forecasts based on similar launches. The key is not choosing one perfect method. It is creating a forecast process that gets smarter over time and feeds directly into production planning, procurement, staffing, and inventory strategy. Data from ERP and MES systems should be compared with actual line performance so the business learns where the plan consistently breaks down. This table shows that different beverage categories need different forecast tools. The explanation is that production planning becomes more reliable when statistical data and commercial knowledge are blended instead of treated as competing sources. When demand is expected to grow, beverage manufacturers usually choose among three core capacity strategies: lead, lag, and match. A lead strategy adds capacity before demand fully arrives. This is common when a brand has strong customer commitments, wants faster market entry, or sees strategic value in extra flexibility. A lag strategy waits until demand is proven before investing. This lowers short-term risk but can lead to lost sales and service issues. A match strategy adds capacity in smaller steps as demand develops, balancing risk and responsiveness. In U.S. beverage manufacturing, the right choice depends on product shelf life, channel pressure, capital availability, utility readiness, labor access, and co-packing options. A national functional beverage launch may justify a lead approach if shelf life is adequate and retailer authorizations are secured. A regional craft beverage brand may prefer a lag strategy to preserve cash. A co-packer scaling from 20 million to 80 million cases may use a match strategy through modular utilities, phased tanks, expandable syrup rooms, and flexible packaging lines. Buying advice is especially important here. If your plant is under pressure, do not assume a new line is the only path. Ask whether the gap can be closed through debottlenecking, controls optimization, revised scheduling, warehouse redesign, added accumulation, or a second shift. If a capital project is needed, it should fit a phased growth plan with defined trigger points. That is how smart capital meets smart manufacturing: expansion should happen when economics, operations, and market demand align. The value of this comparison is that strategy should match business context. A premium spirits RTD producer in Nashville or Louisville may have different needs than a high-volume soft drink co-packer in Texas or a juice processor in California’s Central Valley. One planning model does not fit all. Packaging lines are where many beverage capacity plans succeed or fail. Operators often cite filler speed, but true line capacity depends on the balance of every machine from depalletizer to palletizer, as well as product flow, changeover routines, maintenance practices, and operator response. The most effective measurement is OEE, which combines availability, performance, and quality. OEE gives a more complete view of what the line can actually deliver over time. Throughput should be measured by SKU family, package type, and shift. A can line may perform well on one high-volume energy drink but poorly on a specialty slim-can product with complex cartons. Glass lines may be limited by label application or packer speed. Aseptic lines may be constrained by sterilization, environmental controls, or package supply. In many facilities, the hidden issue is changeover optimization. Ten small improvements in setup, sanitation, material staging, and automation can unlock more capacity than one large equipment purchase. Best practices include SMED-style setup reduction, standard work, pre-staged components, automatic recipe loading, quick-connect utilities, better line accumulation, digital downtime tracking, and packaging family rationalization. Controls and SCADA upgrades can also improve recovery from faults and reduce operator variation. Manufacturers looking for integrated solutions often review available process and equipment capabilities alongside line performance data to decide whether to modify existing assets or install new ones. The explanation for these metrics is simple: capacity planning needs measurements that reflect real manufacturing behavior, not assumptions. Plants that track OEE and changeovers at a detailed level can forecast production commitments with much higher accuracy. Labor is one of the most underestimated components of beverage plant capacity planning. A line may have the mechanical ability to run another shift, but the plant may not have enough trained operators, quality technicians, maintenance staff, forklift drivers, sanitation workers, or supervisors to support it. In many U.S. regions, especially around fast-growing manufacturing corridors in the Southeast and Southwest, labor availability has become a strategic constraint. Workforce planning should include core staffing by line, relief coverage, overtime thresholds, maintenance windows, sanitation turnaround, and onboarding time for new employees. Plants with complex products or regulated processes should also factor in training for food safety, allergen control, alcohol compliance where relevant, and automation interfaces. Flexible labor models can help during peak periods, but they work only if standard work and operator support systems are strong. Shift structure affects capacity, cost, and equipment care. A traditional two-shift model may be enough for stable demand, while a three-shift or 24/7 schedule may be justified during summer peaks or for high-volume co-packers. Some facilities use weekend crews or seasonal staffing. Others rely on planned downtime blocks for preventive maintenance. The right answer depends on demand pattern, labor market, and equipment reliability. For beverage companies evaluating plant expansion or a new facility, local labor conditions should be weighed as heavily as tax incentives or utility rates. A plant near Charlotte, Indianapolis, Phoenix, or Dallas may offer strong logistics access, but wage competition and technician availability still shape long-term effective capacity. Capacity planning becomes much more accurate when it is integrated with ERP and MES systems. ERP typically manages demand, inventory, purchasing, orders, and financial planning. MES manages production execution, quality checks, downtime, and real-time plant data. When these systems are linked, planners can compare forecasted demand with actual runtime, material availability, and labor performance. For beverage manufacturers, this integration supports better scheduling of formulas, tanks, fillers, and package materials. It also helps plants see where service failures start. For example, if sales commits a retailer promotion without visibility into changeover losses, the schedule may collapse. If ERP shows enough cans on hand but MES reveals a utility bottleneck on the line, the output plan will still fail. Integration solves these disconnects by creating one operational truth. Technological capability matters here. DPS supports beverage projects with process, mechanical, electrical, controls, and automation expertise, including PLC programming, SCADA, utility integration, and system coordination. That matters because digital planning tools are only useful when they reflect actual plant design and equipment behavior. In practical terms, strong system integration can connect recipe and batch control, CIP timing, line performance dashboards, and capital planning decisions so managers act on better information. Plants should aim for a data structure that includes the following: actual line rates by SKU, planned and unplanned downtime categories, utility usage by process area, labor by shift, material usage variance, and quality loss data. With that information, planners can build more realistic finite schedules and improve forecast confidence. Scenario planning is one of the best tools for beverage capacity management because demand rarely follows a perfect baseline. What-if analysis lets operators test how the plant would respond to a 20 percent summer increase, a lost customer, a late can shipment, a utility outage, a new line startup, or a major retail authorization. This approach is especially useful for co-packers, multi-brand plants, and facilities with heavy promotional calendars. A strong what-if model should include at least four scenarios: base case, upside demand case, downside case, and disruption case. More advanced models may separate pricing-driven volume shifts, geographic expansion, labor shortage risk, and packaging supply interruptions. The goal is not to predict the future exactly. The goal is to create pre-approved responses so management does not improvise under pressure. Manufacturing capability and project execution also matter in scenario planning. DPS supports beverage manufacturers across North America with end-to-end facility and process work that can include blending and batching systems, pasteurization, carbonation and bright tank systems, aseptic solutions, water treatment, CIP, utility infrastructure, proprietary tanks, and integrated installation. That breadth is valuable in scenario planning because many capacity changes are interconnected. A new filler may require more compressed air, more chilled water, different tank turns, revised CIP sequencing, and a warehouse layout change. Case-based learning can sharpen scenario planning. In one example from DPS’s operating philosophy, a client was preparing for a multimillion-dollar capacity project aimed at a modest output increase. Analysis showed that PLC programming limitations, not major hardware, were the true bottleneck. After reprogramming, the plant achieved significantly more output without the original capital spend. This illustrates a critical lesson for beverage producers: test the system before buying the headline asset. More examples of project execution approaches can be explored through DPS project case studies. The explanation behind scenario planning is that resilience is now part of capacity. A plant is not truly capable if it performs only in perfect conditions. U.S. beverage manufacturers need plans that work under volatility in labor, freight, demand, packaging, and utilities. What is the biggest bottleneck in beverage plant capacity planning?The biggest bottleneck is often not the machine with the lowest nameplate speed. It is usually the system constraint that most limits flow, such as changeovers, CIP duration, tank availability, utility capacity, controls logic, or labor coverage. How often should a beverage plant review capacity?At minimum, monthly for S&OP or integrated business planning, weekly for scheduling, and immediately when a major customer change, line issue, or new SKU launch occurs. How do U.S. co-packers approach capacity differently?Co-packers usually need more flexible planning because they manage many customers, more frequent changeovers, and higher schedule volatility. They often rely on match strategies, modular utilities, and broader scenario planning. Should we add a new bottling line or improve the one we have?Start with a debottlenecking study. If OEE, changeovers, controls, material flow, or utilities are the real issue, improving the existing line may create capacity at lower cost and with less disruption. What systems should be connected for better capacity planning?At a minimum, ERP, MES, quality systems, maintenance systems, and line performance data. The more these systems share data, the more realistic the production plan becomes. How do sustainability and policy trends affect 2026 planning?By 2026, more U.S. beverage plants are expected to prioritize water reuse, energy management, lightweight packaging, traceability, and resilient utility infrastructure. State-level packaging policies, retailer ESG expectations, and pressure to reduce waste will increasingly influence capacity design. Flexible systems that reduce water, product loss, and energy per case will support both margin and compliance goals. What product types need the most detailed capacity planning?Aseptic beverages, carbonated beverages, dairy-based drinks, fermented products, RTD cocktails, and high-mix functional beverages usually need the most detailed planning because they combine strict process requirements with complex packaging and sanitation needs. How do local suppliers fit into the planning process?Local and regional suppliers can improve responsiveness for installation trades, maintenance support, fabricated components, and utilities work. However, critical process systems should still be designed around performance, sanitation, compliance, and long-term integration, not just proximity. What should buyers ask before approving a capital project?Ask what the verified bottleneck is, what throughput was proven with current assets, what utilities are required, how labor changes, what the payback assumptions are, how the line handles future SKUs, and whether phased expansion is possible. Why do beverage manufacturers use integrated engineering partners?Because capacity planning touches process design, packaging, controls, utilities, compliance, installation, and project management. An integrated partner can align technical design with commercial goals and reduce the risk of solving the wrong problem. In summary, beverage plant capacity planning in the United States is both an operational and strategic discipline. It affects growth, customer service, labor stability, capital efficiency, and profitability. The most successful manufacturers treat capacity as a system, not a single machine speed. They forecast carefully, measure actual performance, integrate plant data, test scenarios, and invest only after the true bottleneck is understood. For organizations seeking that level of rigor, an engineering-led partner with process, manufacturing, and execution depth can make the difference between expensive expansion and profitable expansion. From a service capability standpoint, DPS operates as a design-build-manage partner for food and beverage manufacturers across the U.S. and Canada, supporting capital planning, feasibility, owner representation, project management, general contracting where licensed, equipment integration, and execution oversight. That model is useful for beverage companies because capacity planning often moves from analysis to installation to commissioning quickly, and continuity across those phases reduces project risk. -
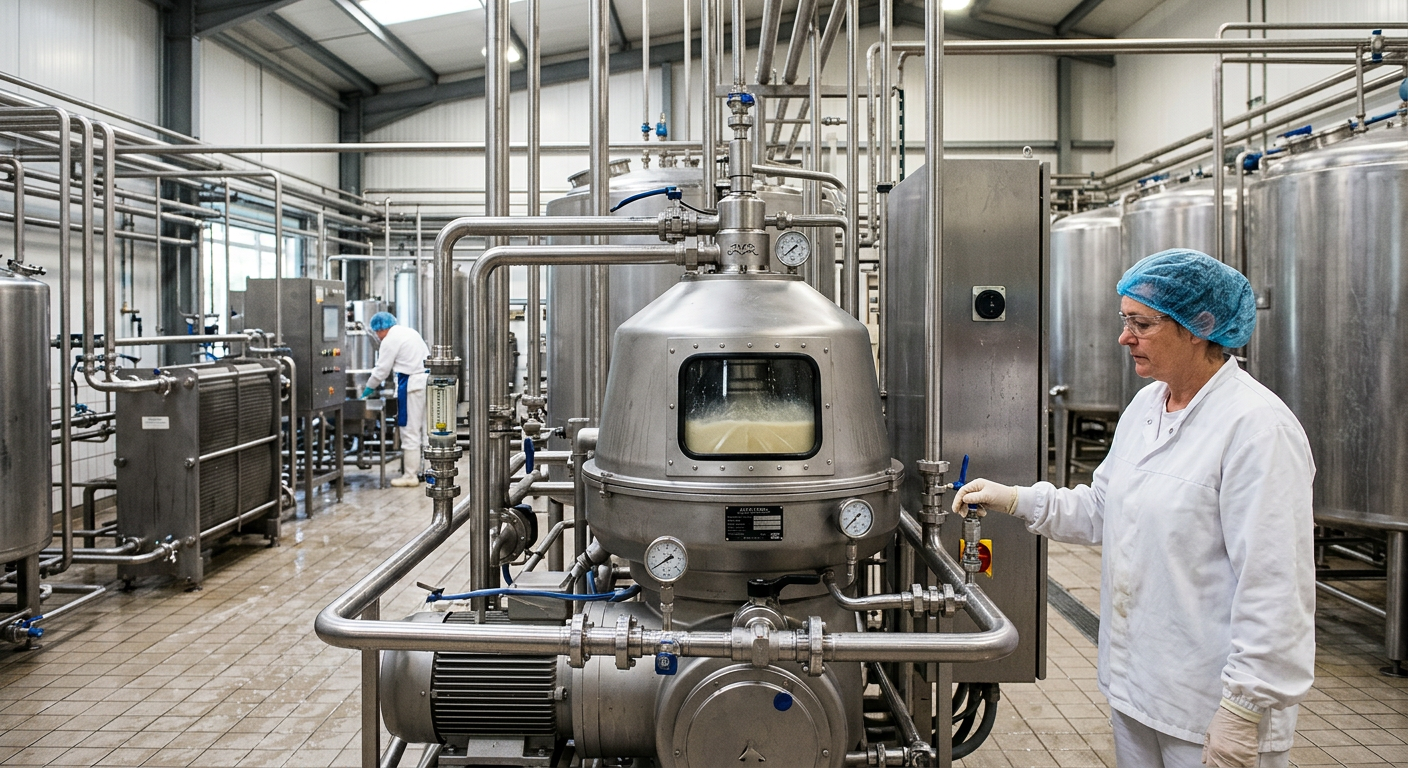
5-Phase Food Plant Equipment Lifecycle Management
Managing food plant equipment over its full useful life is no longer a maintenance-only task in the United States. It is a capital strategy, an operating discipline, and a profitability lever. For processors in hubs such as Chicago, Dallas, Fresno, Charlotte, Omaha, Atlanta, Los Angeles, and the Port of Houston corridor, the best lifecycle programs start before a machine is purchased and continue through commissioning, production optimization, repair decisions, and eventual replacement. When manufacturers connect engineering standards, operator training, sanitation requirements, spare parts planning, and CMMS data into one framework, they reduce downtime, improve food safety, and make smarter reinvestment decisions. In food and beverage plants, lifecycle management applies across mixers, tanks, pumps, pasteurizers, retorts, fillers, conveyors, refrigeration systems, boilers, CIP skids, packaging lines, controls networks, and utility infrastructure. The stakes are high because a poorly specified asset can create years of hidden labor, changeover, sanitation, and energy costs. A well-managed asset, by contrast, supports throughput, compliance, and long-term margin. Food plant equipment lifecycle management is the structured process of planning, buying, installing, operating, maintaining, and replacing production assets to maximize uptime, food safety, and return on capital in the United States. The strongest programs use five practical phases inside a broader business framework: equipment acquisition and specification, installation and commissioning, operational performance monitoring, maintenance and repair optimization, and end-of-life replacement planning. These phases are tied together by total cost of ownership analysis and lifecycle data captured in a CMMS or enterprise asset management system. For U.S. processors, the direct answer is simple: buy only what your process truly needs, commission it correctly, monitor real performance instead of nameplate promises, maintain it with data rather than habit, and replace it based on economics instead of age alone. This approach matters whether you run a poultry facility in Arkansas, a dairy plant in Wisconsin, a beverage co-packer in North Carolina, or a protein line near the rail and cold-chain networks of Kansas City. In practice, lifecycle success depends on several market realities in the United States: The chart above reflects a realistic growth pattern driven by modernization, labor scarcity, retrofit automation, and stronger asset governance. By 2026, many U.S. manufacturers are expected to expand lifecycle management beyond maintenance into engineering, finance, and plant leadership decision-making. The lifecycle of food processing equipment is won or lost at the specification stage. Too many plants still buy around initial price, available floor space, or a favorite vendor relationship. In the United States, that approach often leads to chronic issues: undersized utilities, poor washdown design, limited maintenance access, control system incompatibility, and excessive changeover time. Better acquisition planning begins with business needs. Is the plant chasing capacity, labor reduction, yield, sanitation improvement, SKU flexibility, or geographic expansion? A ready-to-drink line serving Southeast distribution through Atlanta and Savannah has different design priorities than a frozen protein operation feeding the Midwest through Omaha and Minneapolis. The specification must reflect product type, line speed, packaging format, regulatory environment, utility profile, and future expansion needs. Common equipment categories that benefit from lifecycle-based specification include: Buying advice for U.S. processors: evaluate cleanability, spare parts access, controls openness, local service coverage, domestic code alignment, utility consumption, and operator ergonomics before comparing quotes. Also account for freight routing and installation logistics if your plant sits near congested corridors such as Southern California, New Jersey, or the Chicago intermodal region. This table shows why equipment specification must be cross-functional. Engineering, operations, quality, sanitation, finance, and maintenance should all sign off before procurement. That alignment reduces expensive surprises during startup and the first year of operation. Manufacturers looking for a structured front-end approach often benefit from external engineering support that connects process goals to capital scope. A partner with feasibility, utility design, and integration experience can prevent overspending on the wrong asset. For a broader view of project planning and execution support, manufacturers can review food and beverage engineering services that cover design, project management, and capital planning. Installation is where paper assumptions meet field reality. In many U.S. projects, problems arise not because the equipment is poor, but because alignment, piping slope, controls handoff, utility balancing, or operator training were incomplete. A successful commissioning phase is more than “turning it on.” It is the formal proving of mechanical integrity, control logic, safety interlocks, sanitation performance, and process capability. Plants in expanding manufacturing regions such as Texas, Tennessee, and the Carolinas often face compressed schedules and multiple trades working simultaneously. That makes structured commissioning even more important. Every tank, skid, conveyor, valve cluster, and packaging machine should be tested against documented criteria before final acceptance. The table highlights a key point: commissioning is a multi-discipline process, not a single event. It should include operators, maintenance technicians, quality managers, sanitation leads, and automation specialists. If any of these groups are missing, hidden failure points often surface weeks later. For example, a filler installed in a beverage plant near Charlotte may pass a no-load run but fail during sticky, high-sugar production because CIP spray coverage or drain-back behavior was never validated. A retort line in California’s Central Valley may meet throughput targets but create thermal process inconsistencies if steam quality fluctuates under full utility demand. These are lifecycle issues, not isolated startup issues, because weak commissioning creates years of operating penalties. Once an asset is live, the next phase is monitoring what it actually does, not what the brochure said it would do. U.S. processors increasingly use OEE, downtime codes, energy intensity, sanitation cycle time, product giveaway, and maintenance response data to evaluate equipment health and value. The most useful metrics vary by equipment type and application: The chart suggests where lifecycle investment pressure is strongest across U.S. food and beverage sectors. Beverage, protein, and dairy operations often move first because they combine strict quality risk with expensive downtime. This KPI table is valuable because it links numbers to action. Monitoring without defined response thresholds only creates reports. Plants should set review cadences by asset criticality, typically daily for bottleneck lines, weekly for utilities, and monthly for broader capital planning. By 2026, future-ready plants in the United States are expected to deepen performance monitoring with predictive analytics, vibration data, thermal imaging, and historian-driven process alarms. Sustainability policy and customer pressure will also make water use, energy intensity, and wastewater load more visible in asset reviews. Maintenance optimization means choosing the right mix of preventive, predictive, condition-based, and corrective work. In food plants, this balance is complicated by sanitation windows, production variability, allergen segregation, and labor shortages. A robust program does not simply add more PMs. It applies maintenance effort where failure consequences are greatest. Critical assets usually include thermal processing systems, refrigeration, compressed air, CIP, water treatment, primary packaging, control panels, and production bottlenecks. A line may have dozens of minor components, but only a handful truly threaten safety, compliance, or volume if they fail. For buying and operating advice, U.S. plants should ask these questions: This table shows that maintenance optimization is a portfolio decision. Plants should not apply one method to every asset. A centrifugal pump in a noncritical washwater loop may justify a different strategy than a homogenizer feeding a dairy HTST line in Wisconsin or a retort control valve in a shelf-stable operation near Memphis. 2026 trend: more plants will blend predictive maintenance tools with remote support, especially for multi-site manufacturers. However, technology alone will not solve reliability issues if the plant lacks clean downtime data, parts discipline, and standard work for lubrication, inspection, and operator care. End-of-life planning is one of the most misunderstood parts of equipment lifecycle management. Equipment is not “end of life” simply because it is old. In many U.S. plants, a 20-year-old system can still outperform a newer one if it has been well maintained, upgraded intelligently, and matched to the current product mix. Replacement should be based on economics, risk, compliance exposure, and strategic fit. Typical replacement triggers include: The table clarifies that replacement planning should link plant-floor symptoms to business impact. This is especially important in sectors with thin margins and fast growth, such as co-packing, RTD beverages, prepared meals, and protein processing. Case patterns in the U.S. show that many replacement decisions are delayed too long because teams look only at repair invoices, not lost capacity, utility waste, sanitation labor, or customer service risk. A better model is to forecast the next three years of operating burden and compare that with retrofit or replacement options. Total cost of ownership, or TCO, is the financial language that connects engineering decisions to executive approval. In food processing, purchase price usually accounts for only a portion of asset cost. Installation, utilities, water, chemicals, labor, maintenance, downtime, spare parts, validation, and compliance all influence the true cost of an equipment decision. For example, a lower-priced tank system might require more manual cleaning, more operator intervention, and more product loss during changeovers. A more expensive pasteurizer may reduce energy use, improve controls integration, and shorten startup variation. Over five to ten years, the second option may be financially superior. The area chart reflects an important market shift: U.S. food plants are moving away from reactive repair culture and toward data-guided asset ownership. This trend is likely to accelerate in 2026 as ESG reporting, utility cost management, and labor scarcity increase the value of predictable operations. This TCO table explains why procurement decisions should never be made on quote value alone. Strong U.S. manufacturers compare multiple scenarios: new purchase, retrofit, rebuild, used equipment with modifications, and phased modernization. That approach is especially relevant when interest rates, lead times, or utility costs are uncertain. Lifecycle management becomes scalable only when asset data is organized. A CMMS should hold more than work orders. It should connect asset hierarchy, manuals, critical spare parts, PM frequencies, failure codes, lubrication standards, calibration history, sanitation procedures, and cost records. For processors running multiple facilities across the United States, standardizing this structure is a major advantage. It allows a beverage plant in North Carolina, a protein facility in Texas, and a prepared foods site in Illinois to compare similar assets on a common basis. It also supports better capital prioritization at the portfolio level. Best-practice CMMS integration elements include: This comparison chart illustrates a common U.S. buying lesson: the lowest quoted equipment cost may score well on initial price but poorly on support, integration, and long-term value. Lifecycle-focused sourcing often produces stronger business outcomes, especially for systems that touch food safety, automation, or plant bottlenecks. As policy and sustainability reporting evolve in 2026, more plants are expected to track carbon intensity, water consumption, and refrigerant performance at the asset level. CMMS and connected data platforms will become increasingly important for documenting these outcomes and supporting capital requests. Disruptive Process Solutions supports manufacturers across the United States and Canada with a business-first view of engineering and capital execution. Rather than treating equipment as isolated hardware, the company approaches projects as integrated operating systems meant to improve profitability, scalability, and long-term plant performance. From a technological capabilities perspective, DPS works across structural, mechanical, plumbing, electrical, process, and controls engineering. That includes PLC programming, SCADA, batch and recipe control, utility systems, water treatment, thermal processing, aseptic applications, and complete process integration. This breadth matters because lifecycle performance depends on how equipment, controls, and utilities behave together, not separately. From a manufacturing capabilities perspective, DPS supplies and manufactures selected branded process equipment such as tanks, custom CIP systems, marination tumblers, and cooking vessels. That practical equipment knowledge supports stronger specification, cleaner integration, and more realistic commissioning outcomes. Manufacturers exploring available process systems can review food processing equipment solutions to see how asset selection aligns with plant performance goals. From a service capabilities perspective, DPS provides capital planning, feasibility, owner’s representation, project and program management, general contracting support where licensed, and turnkey installation and integration. That model is especially valuable for food and beverage plants that need one team to align engineering intent, field execution, and startup accountability. Companies wanting background on this approach can visit the DPS company overview. In real project environments, this integrated model helps clients avoid costly misalignment between concept, procurement, construction, and production ramp-up. It is well suited to beverage, dairy, protein, aseptic, prepared foods, and co-packing applications, particularly where utilities and automation are as important as the process line itself. What is the biggest mistake in food plant equipment lifecycle management?Focusing only on purchase price. In the United States, downtime, sanitation labor, utility consumption, and controls obsolescence often cost more over time than the original machine quote. How often should equipment be reviewed for replacement?Critical assets should receive an annual repair-versus-replace review, with quarterly monitoring of downtime, repair spend, and capacity constraints. Which industries benefit most from lifecycle management?All food and beverage sectors benefit, but the impact is especially strong in dairy, protein, beverages, prepared foods, aseptic systems, and co-packing operations where uptime and sanitation are tightly linked to margin. Is a CMMS necessary for smaller plants?Yes. Even a smaller plant in regions such as the Midwest, Southeast, or Pacific Coast gains from standardized work orders, spare parts control, and failure history. The system can be simple at first, then expanded. Should plants rebuild old equipment or buy new?It depends on controls support, sanitary design, energy use, and production fit. A rebuild can be the best option when the base asset is mechanically sound and the process requirements remain stable. How do local supplier networks affect lifecycle planning?They matter significantly. Plants near major manufacturing and logistics hubs like Chicago, Dallas-Fort Worth, Los Angeles, Houston, and Charlotte may have faster access to stainless fabricators, electricians, controls support, and emergency parts. Remote plants should account for travel and inventory risk in TCO models. What should be included in a handover package after commissioning?As-built drawings, controls backups, PM schedules, spare parts lists, manuals, sanitation procedures, training records, alarm rationalization, and acceptance test results. How can case studies help with lifecycle decisions?They show how specification, automation upgrades, utility integration, and startup discipline affect long-term value in real plants. For practical examples of integrated project execution, manufacturers can explore project case studies in food and beverage facilities. What are the top 2026 trends in U.S. equipment lifecycle strategy?Predictive maintenance expansion, stronger energy and water tracking, cybersecurity-driven controls modernization, more modular skids, broader use of digital twins for commissioning, and tighter sustainability reporting tied to asset performance. What is the best first step for a plant that wants to improve?Start with an asset criticality ranking, collect twelve months of downtime and repair history, identify the top bottleneck systems, and then build a lifecycle roadmap that combines engineering, maintenance, operations, and finance. Across the United States, from West Coast beverage facilities to Gulf Coast processing hubs and Midwestern protein plants, food equipment lifecycle management is becoming a core business capability. Plants that specify wisely, commission rigorously, monitor honestly, maintain strategically, and replace based on economics will outperform those that simply react. The result is more reliable production, stronger compliance, better capital efficiency, and a plant platform built for 2026 and beyond. -
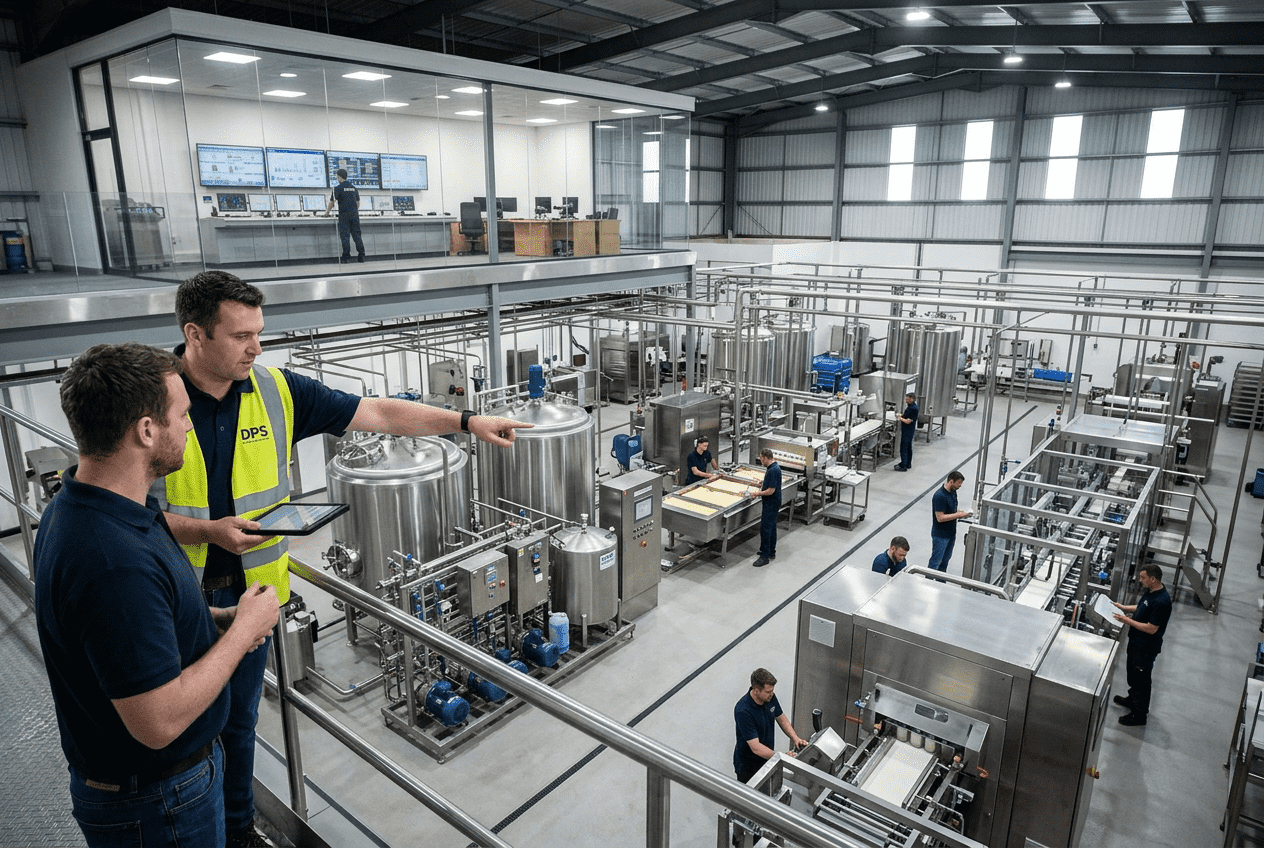
Beverage Plant ROI Analysis
For beverage manufacturers in the United States, return on investment is not just a finance metric. It is the operating logic behind every tank, filler, boiler, syrup room, warehouse lane, and labor schedule. A strong beverage plant ROI analysis connects capital spending to throughput, margin, working capital, utility demand, and market access. Whether a company is evaluating a greenfield plant in Texas, an expansion in North Carolina, or a contract manufacturing strategy near Chicago or Los Angeles, the goal is the same: invest capital where the profit path is clearest and the operational risk is manageable. In practical terms, a U.S. beverage ROI model should answer five questions. First, how much volume can the plant realistically sell by SKU and channel? Second, what will it cost to make and deliver each unit? Third, how long until the project reaches break-even and positive free cash flow? Fourth, how sensitive is the investment to seasonality, freight, labor shortages, and packaging costs? Fifth, which project structure creates the best return: new build, plant expansion, or outsourcing production? This guide is written for beverage executives, private equity operators, plant managers, founders, controllers, lenders, and investors who need a usable framework, not a generic formula. It also reflects the way sophisticated engineering partners approach capital planning. Companies such as Disruptive Process Solutions work at the intersection of process design, construction execution, and profitability planning, helping clients align facility decisions with real commercial outcomes rather than simply installing equipment. Beverage plant ROI analysis is the process of measuring whether a manufacturing investment will generate enough operating profit and cash flow to justify its cost. In the United States, this usually means modeling capital expenditure, sales volume by product and channel, cost of goods sold, labor, utilities, logistics, maintenance, and financing costs over a multi-year period. A good model estimates payback period, internal rate of return, net present value, break-even volume, and downside risk under different operating scenarios. For most beverage projects, ROI improves when capacity is phased, SKU complexity is controlled, packaging is standardized, and utility infrastructure is sized to actual ramp-up rather than ultimate theoretical demand. Plants that look attractive on a simple revenue multiple often underperform if line changeovers are frequent, warehouse throughput is constrained, or the market mix shifts toward lower-margin channels. Conversely, some projects that appear expensive upfront create superior long-term returns because they reduce labor dependence, improve yield, and support higher-value product categories such as functional beverages, RTD cocktails, aseptic products, or premium co-packing. If leadership needs a quick rule of thumb, the investment should not be approved until management can explain: the expected annual contribution margin, the monthly cash burn during ramp-up, the exact break-even case volume, the utilization rate needed for target EBITDA, and the fallback plan if demand arrives six to twelve months later than forecast. Beverage plant ROI analysis is a structured financial and operational study used before a capital decision is made. It combines engineering assumptions with commercial assumptions. Finance teams often start with a formula such as annual net profit divided by total investment, but that is only the surface. In beverage manufacturing, ROI depends on line speeds, fill size mix, sanitation time, package availability, warehouse turns, route density, and compliance requirements. In the U.S. market, the analysis is especially important because production economics vary sharply by geography and product type. A carbonated soft drink line near Atlanta may benefit from access to distribution lanes across the Southeast. A functional beverage co-packer in Southern California may face higher labor and real estate costs but gain faster access to West Coast retail and import channels through Long Beach and Los Angeles. A Midwest operation near Columbus or Indianapolis may optimize freight and improve service levels to grocery, club, and e-commerce networks. ROI analysis also helps define the best project scope. Some investments fail not because the technology is wrong, but because the project is oversized, underutilized, or poorly sequenced. A business may not need a full new plant in year one. It may need debottlenecking, a revised controls strategy, a better CIP system, an upgraded blending room, or an additional packaging format that unlocks margin. This is where engineering discipline matters. The most effective project teams evaluate the plant as a profit engine, not just a collection of assets. From a capability standpoint, a strong engineering partner should understand process systems such as blending, batching, carbonation, pasteurization, aseptic handling, water treatment, utilities, automation, and SCADA. Those technological capabilities directly influence yield, uptime, labor productivity, and quality consistency, all of which feed the ROI model. A practical ROI framework for beverage manufacturing starts with four layers: capital costs, operating economics, cash flow timing, and risk adjustment. Capital costs include land, building, process equipment, utilities, controls, installation, startup, permitting, validation, and contingency. Operating economics include volume, net sales, gross margin, labor, maintenance, freight, overhead, and working capital. Cash flow timing reflects when spending occurs versus when revenue begins. Risk adjustment tests what happens if volume ramps slower, costs rise, or customer mix changes. The most common performance metrics include simple ROI, payback period, EBITDA margin, free cash flow, break-even units, net present value, and internal rate of return. In board discussions, payback and downside resilience often matter more than top-line enthusiasm. Lenders and investors also want to see how the business performs at 60%, 75%, and 90% of projected volume, not just at full utilization. The table above shows why ROI cannot be treated as a single percentage. In beverage plants, timing and operating detail matter as much as total spend. A line that runs at 600 bottles per minute on paper but loses capacity to flavor changeovers, carbonation variance, or downstream palletizing disruptions will not produce the modeled return. The chart above illustrates a realistic growth pattern in U.S. beverage capacity investment. The trend is supported by continued demand for functional drinks, RTD alcohol, low-sugar beverages, protein beverages, and premium private label programs. However, growth does not guarantee project success. Plants must still match technology and capacity to actual demand. Revenue modeling begins with a simple question: what exactly will the plant sell, in what package, through which channels, at what net realized price? Many beverage models fail because they forecast total annual cases without separating SKUs, package formats, line compatibility, retailer deductions, and channel-specific freight or slotting economics. In the United States, beverage demand can vary widely by channel. Grocery offers scale but heavy price pressure. Convenience stores favor single-serve formats and faster turns. Club stores reward pallet efficiency and larger pack sizes. Foodservice can be margin-rich but contract-dependent. E-commerce has different packaging damage risk and fulfillment costs. Contract manufacturing may provide base load volume but lower gross margin per case. A credible ROI model should allocate volume by SKU and channel month by month during the ramp period. It is also important to model product families separately: carbonated beverages, juices, dairy-based drinks, kombucha, sports nutrition, alcoholic RTDs, and aseptic products all behave differently. Shelf-life, process complexity, microbial risk, ingredient volatility, and package constraints affect both pricing and cost. The revenue table highlights why weighted average pricing alone is not enough. A plant serving Dallas, Charlotte, and Phoenix may sell the same brand in multiple formats, but each format creates different throughput, margin, and inventory implications. The best models translate commercial plans into operational load: required hours, changeover frequency, warehouse space, and ingredient procurement cycles. Manufacturing capabilities also matter here. A facility designed for blending, carbonation, hot fill, cold fill, fermentation, or aseptic packaging should be matched to the product portfolio. If the equipment architecture does not support the revenue mix, theoretical sales will not convert into profitable production. Companies often explore engineering and capital planning services at this stage to validate whether the line design truly supports the sales forecast. The demand chart shows how category momentum can shift ROI assumptions. Functional beverages, RTD alcohol, and aseptic nutrition continue to attract investment because they often support stronger pricing than legacy commodity segments. Still, higher-margin categories usually require tighter process control and more sophisticated validation. A beverage plant may win on revenue and still miss its return targets because costs are poorly understood. Cost structure analysis should separate variable costs from fixed costs and identify which items move with volume, which move with complexity, and which move with time. In most U.S. facilities, cost of goods sold includes ingredients, packaging materials, direct labor, utilities, sanitation chemistry, quality consumables, and line scrap. Operating expenses include supervision, maintenance, insurance, software, warehouse overhead, property taxes, and administrative support. Packaging is often the largest cost driver after labor and ingredients. Aluminum cans, closures, corrugate, labels, and PET resin can materially change project economics. Ingredient costs are also volatile in categories using sweeteners, dairy inputs, fruit concentrates, caffeine systems, nutraceuticals, or alcohol bases. Utilities matter more than many executive teams expect, especially where boilers, chillers, compressed air, tunnel pasteurization, or aseptic sterilization are involved. The explanation from this table is straightforward: not all costs scale the same way. Labor may rise faster than volume in a manual packaging environment, while utilities may be more efficient at higher throughput if the system is properly sized. This is why automation decisions must be evaluated in ROI terms, not only in engineering terms. Service capabilities are especially relevant in cost analysis. A full-scope partner that can combine process engineering, owner representation, project management, installation oversight, equipment integration, and commissioning can reduce hidden cost leakage during execution. That is one reason many manufacturers review both project strategy and equipment sourcing together, including specialized process equipment options that fit the production profile without overspending on unnecessary complexity. The area chart shows a broad industry shift toward automation. By 2026 and beyond, labor reliability, traceability, and energy management are expected to play larger roles in plant economics. Automation does not always reduce headcount immediately, but it can improve yield, shorten changeovers, strengthen data visibility, and reduce compliance risk. Break-even analysis identifies how many cases, production hours, or revenue dollars are needed before the plant covers all fixed and variable costs. For a new beverage facility, this should be mapped monthly, not just annually. The first twelve to twenty-four months often include training losses, vendor learning curves, working capital spikes, and customer onboarding delays. A useful break-even model includes at least three scenarios: conservative, base, and accelerated ramp. In the conservative case, launch customers order late, scrap is high, and freight is inefficient. In the base case, volume builds as expected. In the accelerated case, customer demand is strong but additional working capital and labor are required sooner. Management should know whether growth creates a cash need before it creates a profit benefit. This table shows that faster break-even does not always mean better long-term economics. A complex aseptic line may take longer to stabilize but deliver stronger margins once commercial volume is secured. An expansion within an existing plant may break even earlier because utilities, labor leadership, and quality systems are already in place. Case studies often reveal this clearly. In one type of real-world scenario, a manufacturer may assume that a multimillion-dollar capacity expansion is needed to unlock growth, only to discover that the actual bottleneck is controls logic, scheduling, or line synchronization. Evaluating debottlenecking before construction can dramatically improve ROI. Manufacturers comparing options often benefit from reviewing prior project case examples that show how engineering decisions changed commercial results. Seasonality is one of the most underappreciated risks in beverage economics. Demand for soft drinks, teas, sports beverages, and convenience-oriented products often builds ahead of spring and summer. Retail promotions, distributor inventory builds, and ingredient buys can force a plant to spend cash months before revenue converts into collections. If the model does not include seasonal inventory and receivable pressure, the project can appear profitable on paper while straining liquidity in practice. Seasonal cash flow analysis should track monthly raw material purchases, finished goods inventory, accounts receivable days, and the timing of promotional deductions. It should also account for planned shutdowns, maintenance windows, weather disruptions, and utility peaks. For alcoholic beverages, seasonality may tie to holiday demand or distributor ordering patterns. For functional drinks, social media campaigns and retailer resets can create lumpy order timing. The table makes clear that ROI is inseparable from cash timing. A plant can report solid annual margins while still requiring emergency financing if summer inventory builds are not funded. In the United States, this is particularly relevant for businesses shipping into large retail networks from hubs such as Atlanta, Chicago, Dallas-Fort Worth, the Inland Empire, or New Jersey distribution corridors. When beverage companies plan for growth, they usually face three strategic paths. The first is a new build, which offers control and long-term capacity but requires the most capital and the longest ramp. The second is expansion of an existing facility, which usually improves payback because utilities, workforce, and compliance systems already exist. The third is contract manufacturing, which minimizes initial capital but can reduce margin control and scheduling flexibility. The correct choice depends on commercial certainty, category complexity, geographic needs, and capital access. A greenfield facility may be ideal for a company with secured multi-customer demand and a long-term footprint strategy. An expansion is often best when an existing site already serves the market well and bottlenecks are identifiable. Contract manufacturing is useful when demand is uncertain, product development is still evolving, or leadership wants to preserve capital for sales and brand building. This comparison shows why many U.S. manufacturers do not jump directly to a new plant. A phased approach can preserve capital and reduce demand risk. For example, a brand may co-pack in the Midwest while validating East Coast grocery traction, then expand into owned capacity in the Carolinas once annualized demand is more predictable. Others may expand an existing Texas site to serve both regional growth and export adjacency through Gulf Coast logistics. The comparison chart reflects a common reality: expansions often produce the strongest risk-adjusted ROI, while new builds offer the highest strategic upside if utilization is secured. Hybrid models are becoming more popular as companies manage uncertainty while preserving future optionality. Lenders and investors do not fund enthusiasm; they fund disciplined assumptions. To secure financing for a beverage plant, management should present an ROI model that is operationally grounded, sensitivity-tested, and supported by realistic execution plans. The model should show revenue by customer and channel, not just by category. It should quantify line utilization, labor efficiency, gross margin by SKU family, and monthly cash flow through the ramp period. Strong financing packages typically include a base case, downside case, and mitigation plan. The downside case should address delayed customer wins, higher packaging costs, labor inefficiency, slower commissioning, or reduced throughput. The mitigation plan should explain how the company can phase equipment, adjust shifts, outsource overflow, or defer noncritical capital. This is also where a credible project partner adds value. Investors respond well when the engineering and construction approach is integrated with the business case. A design-build-manage mindset is useful because it connects concept, budget, execution, and operating performance. In practice, this means the plant is not being designed in a vacuum. It is being engineered around return targets, startup timing, compliance needs, and long-term maintainability. For 2026 and beyond, financing conversations increasingly include automation readiness, sustainability, and policy resilience. Lenders want to know whether a plant can manage energy use, water efficiency, traceability, and future regulatory requirements. Projects with heat recovery, efficient CIP design, better water treatment, stronger controls, and utility right-sizing may attract better support because they show lower long-term operating risk. Sustainability should not be treated as a branding add-on. In beverage manufacturing, it is increasingly tied to actual cash economics and investor confidence. When presenting to investors, include the following buying advice. First, do not overbuild for a five-year dream if the first two years are uncertain. Second, protect the project with flexible line design and clear debottleneck plans. Third, invest in automation where it solves a measurable cost or compliance problem. Fourth, anchor location strategy around customer density, labor quality, utility reliability, and freight access. Fifth, choose engineering and execution teams that understand both manufacturing reality and capital discipline. From an “our company” standpoint, Disruptive Process Solutions is relevant because it approaches projects as profitability platforms rather than equipment-only jobs. Its teams support beverage and food manufacturers across the United States and Canada with process engineering, capital planning, owner representation, project management, equipment integration, installation, and execution oversight. Its beverage experience spans brewing, distillation, wine, kombucha, RTD, carbonated and non-carbonated drinks, dairy beverages, and aseptic systems. That breadth matters because ROI improves when technical design, manufacturing fit, and service execution align from the start. What is the best ROI metric for a beverage plant?There is no single best metric. Most U.S. operators use a combination of payback period, EBITDA margin, free cash flow, break-even volume, and internal rate of return. For lenders, downside cash flow often matters more than headline ROI. How long does it usually take a beverage plant to break even?Many projects break even between 10 and 24 months after startup, depending on scale, category, existing customer commitments, and how much infrastructure already exists. Expansions usually break even faster than greenfield builds. Should I build a plant or use contract manufacturing first?If demand is still uncertain, contract manufacturing or a hybrid model is often safer. If volume is secured and margin control matters, an owned plant or expansion may create better long-term returns. What costs are most often missed in ROI models?Startup scrap, commissioning labor, utility upgrades, quality compliance costs, spare parts, inventory carrying costs, and seasonal working capital are frequently underestimated. How important is plant location in the United States?Very important. Freight density, labor availability, utility reliability, water access, tax structure, and customer proximity can materially change ROI. Cities and corridors such as Dallas-Fort Worth, Atlanta, Chicago, Charlotte, Columbus, Phoenix, and Southern California each offer different advantages. How does automation affect beverage plant ROI?Automation can improve yield, uptime, traceability, sanitation consistency, and labor efficiency. It works best when tied to a specific financial outcome, such as reducing overtime, shortening changeovers, or improving batch accuracy. What should investors want to see in a beverage ROI model?Investors should expect detailed revenue assumptions by SKU and channel, realistic throughput assumptions, monthly cash flow, working capital needs, downside scenarios, and a clear execution plan supported by experienced engineering and project teams. What trends will matter most in 2026?Expect more emphasis on energy efficiency, water reuse, data visibility, automation, traceability, domestic supply resilience, and sustainability-linked operating design. Functional beverages, premium RTD categories, and aseptic nutrition are likely to remain active investment areas. In summary, beverage plant ROI analysis in the United States is most effective when it connects market demand, product strategy, engineering design, and financial discipline in one model. The companies that outperform are usually the ones that ask the hardest questions before spending capital: where profit will come from, what operational constraints could delay it, and which investment structure creates the best risk-adjusted return. -
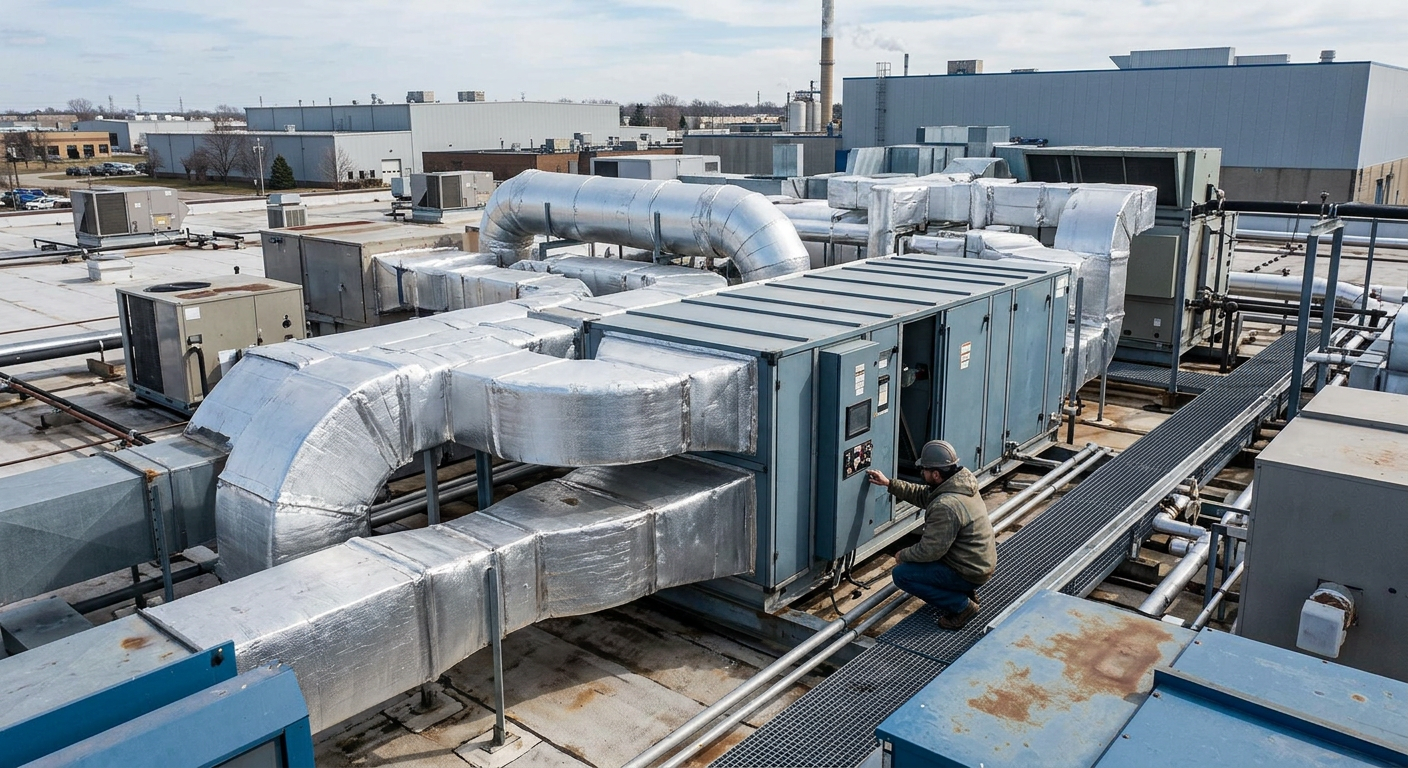
Food Plant Equipment Specification Standards 2026
Specifying food processing equipment correctly is one of the most important decisions in any United States plant expansion, retrofit, greenfield build, or line replacement. A strong equipment specification does more than describe a tank, filler, blender, cooker, pasteurizer, conveyor, retort, or clean-in-place skid. It defines sanitary performance, materials of construction, automation logic, utility demands, safety expectations, documentation, acceptance criteria, and long-term maintainability. In a U.S. market shaped by FDA, USDA, SQF, BRCGS, labor pressure, energy costs, and supply-chain volatility through gateways such as Los Angeles, Long Beach, Houston, Savannah, Newark, and Chicago, the difference between a detailed specification and a vague one can mean months of delay and millions in avoidable cost. This guide explains how manufacturers in dairy, protein, beverage, prepared foods, sauces, aseptic products, and co-packing operations can build practical equipment specification standards for 2026. It is written for plant owners, operations leaders, engineering teams, procurement professionals, quality managers, and investors who need capital projects to perform on day one and stay profitable over time. In the United States, food plant equipment specification standards should define nine essentials: process duty, target throughput, hygienic design, material selection, code and regulatory compliance, controls integration, utility requirements, documentation package, and factory/site acceptance criteria. If any one of those is weak, the project often suffers from change orders, sanitation issues, poor OEE, operator frustration, or delayed startup. For 2026, the strongest specifications also account for three newer realities. First, automation and recipe control must be written as part of the equipment scope rather than treated as a late-stage add-on. Second, sustainability targets such as water reuse, heat recovery, compressed air efficiency, and chemical optimization now matter financially, not just reputationally. Third, documentation needs to support multi-site corporate governance because many U.S. food and beverage companies now standardize equipment decisions across facilities in North Carolina, Texas, Wisconsin, California, Georgia, Tennessee, and the Midwest. A practical buying rule is simple: write specifications around process outcomes, sanitation access, utility consumption, operator use, and acceptance testing, not around brochure claims. When plants do that well, they reduce startup risk and improve lifecycle value. The market trend above reflects a broad increase in specification-driven capital planning. More plants are moving away from generic RFQs and toward disciplined specification standards because labor, compliance, and utility costs continue rising faster than many operating budgets. An equipment specification should read like an operating agreement between the owner, the OEM, the integrator, and the startup team. It should define what the machine must do, how it must be built, how it will connect to the rest of the plant, and how success will be measured. This is especially critical in high-throughput hubs such as Dallas-Fort Worth, Atlanta, Memphis, and the Chicago corridor, where downtime and installation windows are tightly compressed. At minimum, the specification should describe product characteristics, expected viscosities or solids load, temperature ranges, cleanability, batch or continuous operation, hourly or daily throughput, utility availability, control architecture, allergen separation needs, operator interaction, and maintenance access. It should also distinguish clearly between “vendor standard” and “owner required.” That single distinction prevents many disputes. For plants seeking a more integrated approach, it helps to align equipment standards with engineering, installation, and startup planning from the beginning. Companies often benefit from working with teams that can connect process design and field execution, such as food and beverage engineering services that cover process, utilities, controls, construction coordination, and commissioning. This table shows the backbone of a strong specification. In practice, each line item should be translated into measurable requirements rather than general language. For example, “easy to clean” should become “fully drainable to low-point outlet with no pooling after CIP final rinse.” Technology capability is now part of core specification practice. Advanced processors increasingly require PLC-based batch control, SCADA visibility, remote diagnostics, recipe management, inline Brix monitoring, thermal profile logging, and utility metering. These are no longer premium extras in many beverage, dairy, protein, or aseptic plants; they are operating necessities. For that reason, the best specifications treat automation, electrical integration, and process controls as core process requirements, not post-award decisions. Sanitary design should be the center of every food equipment specification in the United States. A machine can hit its speed target and still fail commercially if it traps soil, takes too long to clean, or creates recurring environmental monitoring findings. Hygienic design standards are especially important for ready-to-eat proteins, dairy, sauces, cultured beverages, aseptic products, and facilities that run multiple allergens. Good sanitary design starts with accessible geometry. Product contact areas should be inspectable, cleanable, drainable, and free of unnecessary crevices. Welds should be smooth and consistent. Hollow members should be sealed or avoided. Fasteners in splash zones should be minimized. Belting, pump seals, spray devices, instrumentation ports, valve clusters, and transition points all need scrutiny. The explanation here is straightforward: sanitation performance is a design outcome, not a housekeeping outcome. Plants that struggle with chronic sanitation issues often discover the problem was built into the equipment layout or geometry from the start. In the U.S. market, sanitary design requirements also vary by product risk. A low-acid shelf-stable retort line in the Midwest has a different risk profile than a refrigerated dairy beverage line in California’s Central Valley or a cooked protein slicing room in Arkansas. Your specification should therefore state whether the area is raw, ready-to-eat, allergen-controlled, high-moisture, dry processing, or aseptic, because design details change materially by zone. This demand comparison highlights why hygienic design remains such a high-priority specification category. Ready-to-drink beverages and protein processing continue to drive strong investment because both sectors face strict quality expectations and intense pressure to reduce cleaning downtime. Material selection is often oversimplified as a choice between 304 and 316 stainless steel, but U.S. food plants need a more disciplined framework. Product chemistry, chloride exposure, cleaning chemicals, abrasion, temperature cycling, and environmental washdown all affect material life. A vinegar-based sauce line, a dairy CIP skid, a brine marination system, and a high-sugar beverage blending system do not have the same corrosion or wear profile. Proper specifications should identify contact materials, non-contact materials, elastomers, insulation jacketing, coatings if any, valve seat compounds, and instrument wetted parts. They should also define finish requirements and post-fabrication treatment where appropriate. In many projects, buying a slightly more robust material package reduces replacement frequency, sanitation risk, and unplanned downtime. The key point from this table is that material selection should be tied to service conditions, not habit. A lower first cost often becomes the highest lifecycle cost when corrosion, gasket failure, or surface degradation begins affecting production. Manufacturing capability matters here as well. Buyers should evaluate whether the supplier can consistently fabricate tanks, CIP systems, vessels, and skids to the specified finish and quality level. For plants that need custom process vessels, cleaning skids, tumblers, or cooking systems, it is useful to review a supplier’s process equipment capabilities alongside fabrication details, weld standards, testing methods, and installation support. Strong manufacturers do not just build to print; they understand how fabrication decisions affect startup and sanitation in the field. Many projects fail because capacity is specified only as a nameplate number. In reality, food and beverage plants need equipment that performs under actual operating conditions: real product temperatures, changeovers, SKU variation, sanitation windows, operator staffing, utility fluctuations, and upstream or downstream interruptions. A 400-bottles-per-minute filler or 20,000-pound-per-hour cooker may only achieve that speed under narrow conditions. For better results, specifications should define normal throughput, sustained throughput, peak throughput, first-pass yield, CIP duration, heat-up time, cooldown time, product loss at changeover, utility consumption, and expected OEE assumptions. They should also state if the line must scale for future expansion. In fast-growth regions such as Phoenix, Nashville, Charlotte, and Austin, many plants need phase-one systems that can support phase-two capacity without tearing out utilities later. The explanation is simple: capacity without context is misleading. A usable performance standard should reflect the plant’s actual scheduling, labor, utility, and product mix so that procurement decisions support profitability instead of just maximum output claims. By 2026, more U.S. owners are also writing in sustainability metrics as performance criteria. These include water use per gallon produced, heat recovery targets, compressed air leakage tolerance, and chemical concentration control. This is especially important for beverage, dairy, and aseptic plants where water and energy intensity can materially affect EBITDA. The area trend shows how fast buyers are moving toward performance-based specifications. This change is being driven by co-pack growth, private equity oversight, utility cost pressure, and tighter startup deadlines across the United States. Equipment specifications for the United States must align with applicable regulatory and certification requirements from the outset. Depending on the product and facility, this may include FDA food safety requirements, USDA inspection expectations, PMO considerations for dairy, low-acid canned food process needs, OSHA safety concerns, local building and fire code, electrical code, and customer-driven frameworks such as SQF or BRCGS. In practice, compliance is not a single checkbox; it is a layered requirement that influences design, installation, controls, validation, and records. Plants in meat and poultry regions such as Nebraska, Kansas, Iowa, Georgia, and Arkansas often face different documentation and design expectations than beverage plants clustered around California, Texas, or the Carolinas. The specification should therefore state the compliance environment clearly and assign responsibilities for submittals, labeling, verification, and startup records. The reason this table matters is that code and certification expectations often drive hidden scope. If they are not written into the specification, they appear later as costly field changes, delays in commissioning, or failed audits. Service capability becomes critical at this stage. Owners often need project teams that can connect process engineering, code coordination, field installation, startup management, and owner representation. When compliance requirements are complex, a partner with cross-functional execution experience and a documented project record can lower risk. Reviewing a supplier’s project case studies is often more revealing than reading a generic qualifications sheet. No equipment specification is complete without layout integration. Even excellent machines fail if they are forced into poor plant geometry, awkward sanitation zones, or underdeveloped utility corridors. U.S. food plants often expand within tight footprints, especially in legacy facilities near Chicago, Philadelphia, Cincinnati, Milwaukee, and the Northeast corridor, where old buildings constrain access and ceiling height. The specification should include dimensional envelopes, maintenance pull space, operator circulation, pallet and forklift travel, mezzanine loading, floor drainage strategy, utility routing, and sanitation segregation. It should also define process adjacency: where raw ingredients enter, where in-process transfers occur, how personnel move, where waste exits, and how allergen or ready-to-eat areas stay protected. This matters even more in large beverage and co-pack facilities where syrup rooms, boilers, air compressors, cooling towers, process water, wastewater, and filling lines must operate as one coordinated ecosystem. Utility systems should be specified with the same seriousness as the process equipment itself because they often determine whether the process can run at full intended rate. Integration with layout also now includes digital infrastructure. Plants increasingly require network drops, secure PLC communication, historian access, and remote diagnostics strategy as part of equipment placement decisions. In 2026, cybersecurity, panel accessibility, and remote support readiness are becoming standard specification topics rather than IT afterthoughts. This comparison illustrates a common market reality: suppliers that understand plant integration usually outperform commodity-only vendors on startup support, utility coordination, documentation quality, and future scalability. Documentation is where many projects either gain discipline or lose control. A complete equipment specification should require detailed submittals before fabrication, a clear document package before shipment, and objective acceptance tests before final payment. Plants should avoid vague language such as “machine to be tested” and instead define exact FAT and SAT procedures, durations, products, pass/fail thresholds, and punch-list closeout rules. At a minimum, the document package should include P&IDs, general arrangement drawings, utility connections, electrical schematics, panel layouts, I/O lists, bill of materials, spare parts list, recommended PM schedule, weld maps if required, surface finish records if required, software backups, operator manuals, sanitation instructions, and training records. If the line has recipe or batch functionality, version control and change management should also be included. The explanation is that documentation is not paperwork for its own sake. It is the mechanism that turns purchased equipment into a maintainable, auditable operating asset. For most owners, acceptance should include three layers: functional acceptance, sanitation acceptance, and performance acceptance. A line that powers on but cannot meet target throughput, fails cleaning validation, or generates unstable controls alarms should not be considered complete. Buying advice for 2026 is clear: tie progress payments to documentation quality and acceptance milestones. This encourages discipline across procurement, fabrication, shipping, installation, and startup. Disruptive Process Solutions, or DPS, supports food and beverage manufacturers across the United States and Canada with an approach built around design, build, and execution management. Rather than operating as a narrow equipment reseller, the company works across process engineering, installation coordination, utilities, automation, and capital planning to help owners make better project decisions early and execute them efficiently later. You can learn more about the team on the about us page. From a technology standpoint, DPS works across process, mechanical, electrical, plumbing, structural, and controls disciplines. That includes automation, PLC programming, SCADA, batch logic, and integration of systems such as pasteurization, sterilization, retort, aseptic processing, water treatment, mixing, blending, fermentation, distillation, and utility infrastructure. This range is valuable when an equipment specification needs to account not only for the machine itself, but also for how it interacts with boilers, glycol, compressed air, process water, wastewater, or packaging systems. From a manufacturing standpoint, DPS also develops selected process equipment solutions including tanks, CIP systems, tumblers, and cooking vessels. That fabrication perspective helps connect specification language with real-world buildability, finish expectations, and field installation needs. In practical terms, that means specifications can be written with a better understanding of what separates a clean drawing set from a truly usable production asset. From a service standpoint, DPS supports capital planning, process design, owner representation, turnkey installation, project and program management, and commissioning support. That is especially useful for owners who need a partner capable of bridging the gap between strategy and field execution. Whether the project is a beverage facility scaling rapidly in the Southeast, a protein retrofit in the Midwest, or a utility-heavy co-pack build in Texas, the company’s model is built to keep project decisions tied to profitability rather than simply equipment spend. What makes this relevant to equipment specification standards is philosophy. The best standards come from teams willing to challenge weak assumptions, identify real bottlenecks, and define what success looks like before steel is ordered. In many plants, that level of honesty creates better outcomes than simply approving the biggest equipment package. What is the biggest mistake in food equipment specifications?Writing around brochure features instead of operating outcomes. Plants should specify throughput, sanitation, controls, utilities, and acceptance criteria in measurable terms. Should every specification require stainless steel?Not necessarily. Product-contact and washdown areas often do, but utility skids or support systems may allow mixed materials depending on service, environment, and lifecycle cost. How detailed should FAT and SAT requirements be?Very detailed. Define test sequence, runtime, alarms, safety checks, product trial conditions, utility conditions, and pass/fail thresholds before the purchase order is issued. What standards matter most in the United States?That depends on the product and plant, but FDA, USDA where applicable, OSHA, electrical code, customer audit requirements, and sanitary design expectations are typically central. How should plants prepare for 2026 trends?Build specifications that include automation readiness, cybersecurity, water and energy efficiency, modular expansion capability, digital records, and clearer sustainability metrics. Are custom specifications worth the effort for smaller projects?Yes. Even smaller upgrades benefit from a structured specification because it reduces ambiguity, protects schedule, and improves startup performance. How can a plant compare suppliers fairly?Use a scoring model across sanitary design, material quality, controls capability, utility fit, lead time, documentation, service support, and total cost of ownership rather than purchase price alone. What industries benefit most from strict specification standards?Dairy, protein, ready-to-drink beverages, sauces, aseptic foods, retort products, and co-packing operations typically see the greatest return because downtime and compliance risk are expensive. Do plant layout and utilities really belong in the equipment spec?Absolutely. Equipment performance depends on clearances, drainage, steam, water, air, cooling, power, and controls connectivity. Ignoring those items creates expensive field rework. What should an owner do first before issuing an RFQ?Confirm process intent, product range, cleaning method, utilities, future capacity goals, and acceptance criteria. A strong pre-bid package usually saves far more money than it costs to develop. In 2026, food plant equipment specification standards in the United States are becoming more disciplined, more data-driven, and more integrated with operations strategy. The companies that perform best are usually the ones that define sanitary design, material selection, capacity, controls, compliance, documentation, and plant integration before procurement begins. Whether the project is in California, Texas, Wisconsin, North Carolina, Illinois, or anywhere in between, good specifications remain one of the cheapest forms of risk reduction available to a manufacturer. -
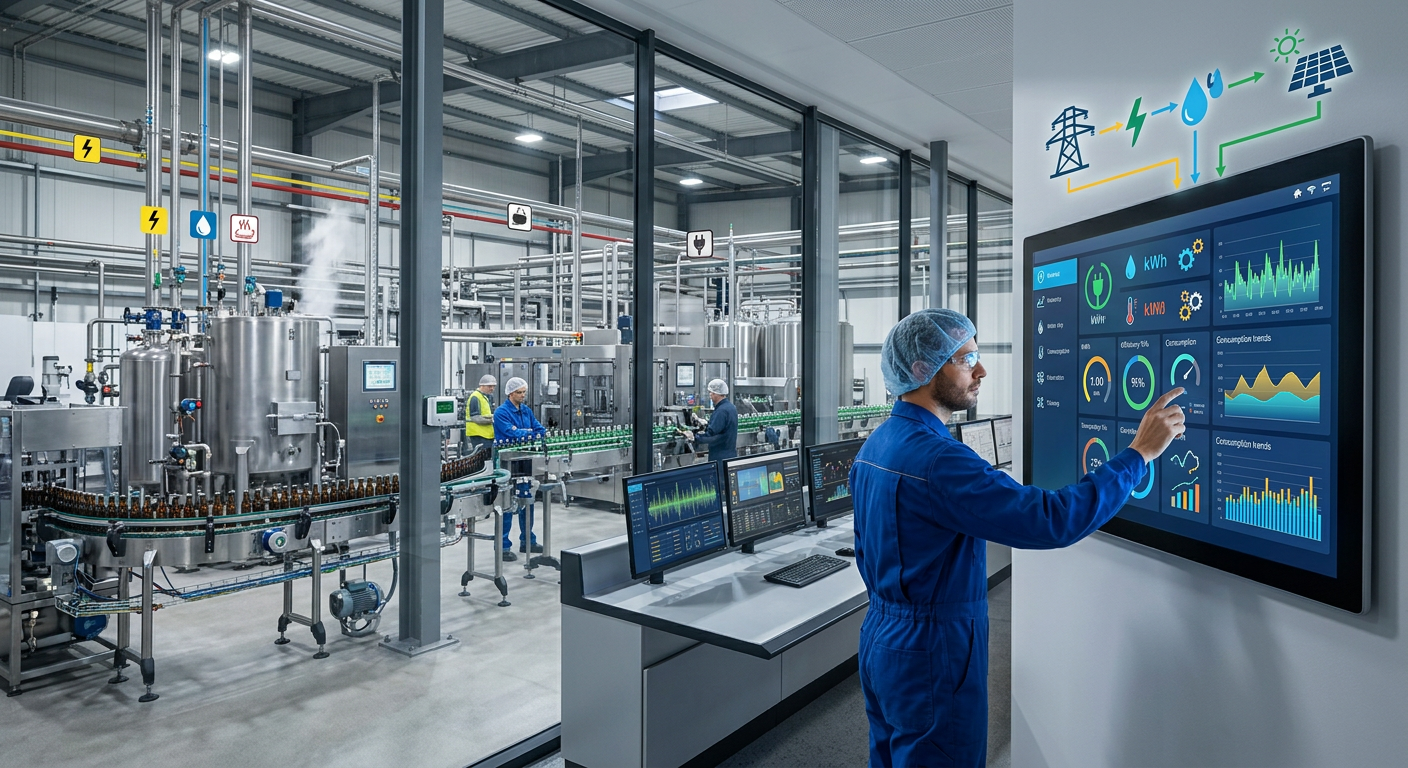
Food Facility Construction Safety Program: OSHA and FSMA Compliance
Construction inside an active food or beverage plant in the United States is not managed like ordinary commercial work. It requires a layered safety and food protection program that combines worker protection, facility hygiene, air control, contamination prevention, sanitation recovery, incident planning, and documented verification. The practical standard is to align OSHA expectations for worker safety with food-manufacturing controls commonly required under FDA, USDA, FSMA, SQF, and BRC programs. In real operating environments, that means trained crews, sealed work zones, negative air pressure when dust is possible, approved personal protective equipment, validated sanitation transition procedures, and constant auditing before, during, and after the work. For manufacturers operating in hubs such as Chicago, Dallas-Fort Worth, Los Angeles, Fresno, Charlotte, Atlanta, Kansas City, the Inland Empire, the Port of Houston corridor, and the I-95 distribution belt, the stakes are high. A poorly managed shutdown or retrofit can trigger safety citations, product holds, allergen cross-contact, microbiological risk, missed production windows, and customer complaints. A strong program protects people first, but it also protects throughput, brand reputation, and capital efficiency. If you need a direct answer, a compliant food facility construction safety program in the United States should include six non-negotiable elements: OSHA-trained supervision, food-specific site orientation, containment barriers, pressure-managed air control, plant-approved PPE, and sanitation release before production restarts. These controls should be documented in pre-task plans, permit systems, cleaning records, inspection logs, and closeout reports. The best programs also connect construction sequencing to production realities, especially in high-care, ready-to-eat, dairy, beverage, protein, and aseptic environments. Buyers evaluating contractors for food plant expansion, equipment relocation, utility upgrades, or greenfield commissioning should look beyond price. They should confirm whether the provider understands the difference between worker safety compliance and food-safe execution. In many projects, both must happen at the same time. A crew may be fully compliant with general jobsite safety rules but still create unacceptable contamination risk if they cut concrete without air control, move tools through hygienic areas without transition, or restart utilities before sanitation verification. The U.S. market continues to invest in processing capacity near transportation and labor centers. Beverage growth remains strong around North Carolina, Texas, California, and the Midwest. Protein, prepared foods, sauces, dairy, and cold-chain facilities continue to expand near interstates, rail access, and ports serving domestic and export demand. As this capital spending grows, so does the need for disciplined construction safety programs designed specifically for food manufacturing operations. The table above shows why a food plant program must bridge safety, quality, and operations. Each control is useful on its own, but the real value comes from coordination. When those six controls are integrated, projects move faster with fewer surprises, less rework, and better startup performance. The line chart reflects a realistic market pattern: more U.S. manufacturers are requiring documented barrier management, sanitation recovery, and food-safe construction methods as standard bid requirements. This trend is especially visible in regulated categories such as dairy, protein, ready-to-drink beverages, and aseptic processing. OSHA 30 remains a strong baseline for supervisors and project leaders because it establishes discipline around hazard recognition, communication, lockout concerns, electrical awareness, fall prevention, and site accountability. However, OSHA 30 alone is not enough for active food and beverage environments. Teams also need food-specific training on hygienic zoning, traffic segregation, tool control, allergen awareness, water management, drain protection, waste routes, sanitation holds, glass and brittle plastic rules, and emergency communication with plant operations. For example, a contractor working in a dry ingredient plant near Kansas City or a protein room in Arkansas may face entirely different contamination pathways than a craft beverage line in North Carolina or an aseptic filler project in California. The training content should match product type and process risk. Low-moisture plants often focus on dust and allergen control; RTE plants focus more heavily on pathogen prevention; beverage facilities often prioritize utility integrity, CIP interfaces, and packaging line separation. Strong buyer advice in this category is simple: ask to see the provider’s role-based training matrix. A mature team will distinguish between general labor, welders, electricians, controls staff, millwrights, startup technicians, and supervisors. It will also define refresher timing, onboarding triggers, and facility-specific overrides. The explanation behind this matrix is practical. Training should not be treated as a single classroom event. It should be deployed as a layered operational system tied to permits, sanitation risk, and production timing. Manufacturers in major U.S. logistics corridors often expect this because they cannot afford unplanned downtime tied to preventable site behavior. From a technology perspective, construction partners with broad engineering depth add value because they can connect field training to design intent. That matters when integrating process, mechanical, plumbing, electrical, and controls work. A team that understands PLC logic, SCADA visibility, utility sequencing, and process flow can better explain why one valve isolation matters, why one drain must stay protected, or why a temporary tie-in changes sanitation risk. This is one of the reasons clients often review a firm’s engineering and integration background before awarding sensitive work. For a closer view of integrated project capabilities, manufacturers can review food and beverage engineering services that combine design, construction management, and execution oversight. Containment barriers are the frontline defense between construction activity and food production. In the United States, the exact barrier design depends on work scope, product exposure, air movement, utilities, and hygiene zoning. A simple maintenance partition may be acceptable in a warehouse expansion, while a rigid sealed barrier with dedicated access control may be required next to a ready-to-eat slicing line or aseptic support area. Barrier protocols should define material type, height, ceiling closure, sealed penetrations, signage, entry rules, tool transfer controls, debris exit routes, and inspection frequency. They should also identify when the barrier must be upgraded because of escalated work such as concrete cutting, grinding, welding, roof penetrations, or overhead work. Plants near humid Gulf Coast markets or older East Coast facilities may face added complexity because existing building envelopes and HVAC interactions make dust and moisture harder to predict. For product types such as powdered ingredients, dairy powders, seasonings, bakery mixes, and plant proteins, dust migration control is essential. For wet processing, sauces, dressings, dairy, seafood, and prepared meals, moisture management and traffic control become equally important. In beverage plants, the concern often shifts to packaging exposure, syrup room protection, utility continuity, and line sanitation interfaces. This table shows that the right barrier is not chosen by budget alone. It is chosen by consequence. The higher the hygiene risk and the more invasive the work, the more robust the containment system should be. Plants that run 24/7 often save money by investing in stronger barriers upfront because they reduce sanitation recovery time and avoid broader shutdowns. When manufacturers compare suppliers, they should ask whether the contractor performs barrier risk assessments, not just barrier installation. That distinction matters. A supplier that only hangs partitions may not understand how utilities, drains, lift paths, forklift routes, or sanitation crews interact with those partitions during the project lifecycle. Negative air pressure systems are used when the project creates dust, fumes, or airborne particles that could migrate into sensitive areas. In food plants, they are especially important during demolition, core drilling, floor removal, overhead modifications, insulation disturbance, and similar work. The basic goal is to pull air from cleaner adjacent spaces into the work zone, then filter and discharge that air in a controlled way. This helps contain contaminants rather than letting them escape into production or ingredient storage areas. HEPA-filtered negative air units are common, but success depends on more than equipment placement. The project team should verify airflow direction, calculate enough air changes, inspect filter condition, and avoid accidental short-circuiting through open doors or unsealed penetrations. Pressure logs and visual smoke checks are often used to confirm performance. In large U.S. facilities around Memphis, Indianapolis, the Central Valley, or the Port of Savannah, where production schedules are tightly sequenced, reliable air control can determine whether adjacent lines stay online. By 2026, more facilities are expected to pair temporary air systems with digital monitoring. Sensors that track differential pressure, particulate levels, humidity, and temperature can support faster decisions and cleaner documentation. This trend aligns with broader policy and sustainability goals as plants seek targeted rather than excessive cleaning, more efficient filter changes, and better data for audit trails. The area chart highlights the market shift from basic containment toward monitored containment. That shift is driven by stricter customer expectations, more demanding audit environments, and the simple reality that documented performance is easier to defend than assumptions. The explanation is straightforward: negative air only works when the enclosure, equipment, and operating behavior are managed together. Open doors, overloaded filters, and poor discharge routing can undermine the entire strategy. That is why experienced teams write air control into daily planning, not just into a kickoff meeting. PPE in a food plant construction program must protect both the worker and the environment. Hard hats, eye protection, gloves, high-visibility garments, hearing protection, respiratory protection, cut-resistant gloves, arc-rated clothing, and fall protection may all be required depending on task. But food facilities also apply added controls such as dedicated footwear, beard covers, hair restraints, color-coded smocks, zone-specific gloves, and restrictions on loose items that could become foreign material hazards. The best practice is a task-and-zone PPE matrix. For example, the PPE needed for utility work in a boiler room in Houston is different from the PPE for line modifications near exposed dairy product in Wisconsin or retort work in New Jersey. Respiratory needs should also be reviewed carefully when dust-generating work occurs in confined areas or when sanitation chemicals are present nearby. Facilities should avoid one-size-fits-all PPE policies. Overly broad rules often create noncompliance because the gear feels impractical for the actual task. Instead, the program should specify minimum site PPE, task-specific upgrades, hygiene-area additions, and prohibited items. The matrix should also define who can approve deviations and how disposable PPE is handled to prevent cross-zone contamination. The bar chart reflects how certain sectors, especially aseptic, protein, and dairy, tend to require tighter PPE discipline because of microbiological sensitivity, cleaning intensity, and customer audit scrutiny. The logic behind the table is that PPE should support operational flow, not fight it. When the standards are clear and visible, supervisors can coach behavior faster, sanitation teams can predict recovery needs, and QA can release areas with more confidence. Sanitation transition procedures govern how the site moves from construction status back to food-safe operating status. This is often the most overlooked part of the program. Many projects finish the physical work but fail to define who cleans what, how debris is removed, what verification is needed, and who gives final release. In food and beverage facilities, startup without a clear sanitation transition can be more damaging than the construction itself. A proper transition plan covers gross debris removal, tool and material exit, dust control verification, drain inspection, utility restoration, equipment wipe-down or washdown, allergen review, environmental monitoring as needed, pre-operational inspection, and final QA sign-off. The sequence may vary by facility type. A low-moisture bakery in Ohio will not use the same recovery method as a wet dairy plant in Idaho or a seafood processor in the Pacific Northwest. In buying decisions, manufacturers should ask whether the contractor participates in sanitation recovery planning or simply hands the area back. The stronger providers work side by side with QA, sanitation, maintenance, and operations to define the transition early. This reduces disputes, compresses downtime, and improves startup success. This sequence matters because it separates construction clean-up from food-grade sanitation. They are related but not identical. One removes project residue; the other verifies the area is fit for manufacturing. Confusing the two is a common source of avoidable risk. Manufacturing capability also influences how well a project transitions back into production. A partner with experience in custom tanks, CIP skids, process vessels, marination systems, cooking systems, or integrated utility packages understands how fabricated equipment surfaces, weld finishes, piping routes, and startup sequences affect cleanup and validation. That kind of practical manufacturing knowledge can reduce handoff problems on complex projects. Companies evaluating process equipment and integrated systems can explore processing equipment capabilities when comparing suppliers that support both fabrication and installation. Even with strong controls, incidents can happen. The question is whether the project team can contain them quickly and communicate clearly. Incident response planning for food facility construction should address worker injury, contamination events, utility failures, fire and hot work problems, ammonia or refrigerant concerns where relevant, water intrusion, barrier breaches, unexpected debris release, and product exposure scenarios. Good plans define event classification, immediate stop-work triggers, area isolation, notification order, evidence preservation, product hold criteria, sanitation escalation, and restart authority. The response path should be short and practical. In a busy plant near Atlanta or the Inland Empire, a complex chain of approval can waste valuable minutes. The best plans place decision rights close to the operation while preserving QA and EHS control over critical release decisions. Applications vary by industry. In beverage plants, utility interruption and packaging exposure may drive the response. In meat and poultry, water management and traffic segregation are often central. In dairy and aseptic systems, hygienic boundary integrity and process restart verification become especially sensitive. Case studies across North America consistently show that early incident planning lowers total project cost. Small issues stay small when teams know exactly who responds, what gets quarantined, and how documentation is captured. When those steps are unclear, even a minor barrier tear can trigger broad area cleaning, longer downtime, and strained customer communication. The comparison chart illustrates a common market reality: specialized food and beverage project teams typically outperform general construction providers in planning depth, documentation, and hygienic recovery. That does not mean a general contractor cannot succeed, but it usually means more owner oversight is needed to close the gap. Auditing turns a construction safety program from a set of intentions into a repeatable management system. In the United States, effective audits usually happen at three levels: pre-mobilization review, active site inspection, and post-project closeout. The first checks readiness, the second confirms real execution, and the third captures lessons learned. For multi-site operators with plants in places like California, Texas, the Carolinas, Wisconsin, and Pennsylvania, standardized audit templates help compare performance across locations. Continuous improvement should measure both safety and food protection outcomes. Useful metrics include recordable incidents, near misses, barrier failures, sanitation delays, QA holds, air-control deviations, permit nonconformances, startup delays, and change-order causes tied to poor planning. By 2026, more owners are expected to combine these indicators in digital dashboards that link EHS, QA, maintenance, and capital project teams. Sustainability is increasingly part of the conversation as well. Better containment and air management can reduce over-cleaning, prevent unnecessary product disposal, and limit wasted filters and disposable materials. Smarter sequencing can also reduce energy-intensive shutdowns and restarts. As policy expectations and customer scrutiny continue to rise, efficient compliance will matter as much as basic compliance. This table is useful because it connects measurement to action. Audits are not just about catching mistakes. They help owners decide where to standardize, where to retrain, and where to change supplier expectations. A company that learns from every shutdown, expansion, or line retrofit will outperform one that repeats the same recovery problems site after site. Service capability is often the deciding factor here. Some firms can engineer and install systems, but the owner still carries the burden of managing trades, documentation, schedule risk, and closeout quality. Others provide broader support through capital planning, owner’s representation, program management, process engineering, integration, and general contracting coordination. That service depth is valuable for manufacturers balancing production pressure with compliance expectations. To understand how that model works in practice, companies can review project case examples showing how integrated oversight improves execution. Disruptive Process Solutions, or DPS, supports food and beverage manufacturers across the United States and Canada with an integrated project approach built around design, build, and manage execution. Rather than acting as a narrow trade contractor, the company operates as an engineering-led capital project partner focused on profitable outcomes, practical planning, and direct accountability. That approach fits especially well in active operating plants where construction safety, food protection, utility coordination, and startup timing must work together. On the technology side, DPS brings process, mechanical, structural, plumbing, electrical, and controls expertise to projects that range from utility upgrades to complete processing systems. The team works across automation, PLC programming, SCADA visibility, process design, and system integration, which is critical when a construction safety plan must reflect how real equipment, recipes, controls, and sanitation circuits behave during installation and startup. On the manufacturing side, DPS supports custom process equipment and integrated systems used across beverage, dairy, protein, prepared foods, aseptic operations, and related sectors. Experience with tanks, CIP systems, marination equipment, cooking vessels, and broader process infrastructure helps the team anticipate sanitation transitions, material compatibility, and startup requirements, not just structural installation tasks. On the service side, DPS supports feasibility, capital planning, owner’s representation, project management, construction coordination, installation, and commissioning. For owners, that means one partner can help shape the scope, manage local trades, protect the schedule, and maintain visibility from concept through handover. It also means field decisions can be tied back to the business case, which is important when downtime costs and startup delays carry real commercial consequences. Manufacturers looking for a partner that understands both profitability and compliance can learn more about DPS and its project philosophy. The company’s work across food and beverage categories, combined with a lean execution model, is especially relevant for clients who need fast decisions, technical depth, and disciplined field management without unnecessary bureaucracy. In the current U.S. market, local supplier selection still matters. Regional mechanical contractors, electrical firms, sanitary welders, insulation crews, and clean-build specialists often vary by geography. A national project partner with a vetted local network can help owners maintain consistent standards whether the job is in North Carolina, Southern California, the Midwest, the Gulf Coast, or the Northeast. This matters because compliance failures are rarely caused by one missing document alone; they usually come from uneven execution among multiple parties in the field. What is the difference between OSHA compliance and food-safe construction?OSHA compliance focuses on worker safety. Food-safe construction adds controls that protect ingredients, packaging, equipment, and finished product from contamination. Both are required in active food and beverage operations. Is OSHA 30 mandatory for every worker?Not always. Many plants require OSHA 30 for supervisors and OSHA 10 or equivalent for field personnel. What matters most is that the training matrix matches role, hazard, and facility risk. When is negative air pressure necessary?It is typically needed when the work creates dust, fine debris, fumes, or airborne particles that could move into adjacent production or storage areas. Demolition, grinding, drilling, and floor removal are common triggers. Do all projects need rigid barriers?No. Barrier type should match risk. Light work in low-risk spaces may use temporary soft barriers, while high-care, RTE, or dust-heavy work often requires rigid sealed barriers with controlled entry. Who signs off before production restarts?Usually QA or a plant-authorized release owner, often with support from sanitation, operations, maintenance, and the project lead. The exact authority should be defined before the work starts. How should buyers compare contractors?Review training depth, barrier planning, air-control capability, sanitation handover process, documentation quality, and experience in similar product categories. Price alone is not a reliable indicator of project value in food environments. Which industries need the strictest controls?Ready-to-eat foods, dairy, protein, aseptic processing, and high-care beverage operations generally require the most disciplined control systems. Dry ingredient and allergen-sensitive plants also need strong containment planning. What are the main 2026 trends?Expect more digital air monitoring, stronger documented hygienic zoning during construction, tighter customer audit expectations, and more sustainability-driven planning that reduces wasted cleaning, filters, and downtime. Can one partner handle engineering, equipment, installation, and compliance coordination?Yes, and that model often reduces risk because design decisions, field execution, and startup requirements are connected. It is especially useful for complex retrofits, utility expansions, and high-speed growth projects. Why is continuous improvement important if the project is one-time?Because many manufacturers manage repeated shutdowns, line additions, and facility upgrades across multiple sites. Lessons learned from one project can improve safety, speed, sanitation recovery, and cost control on the next one. -
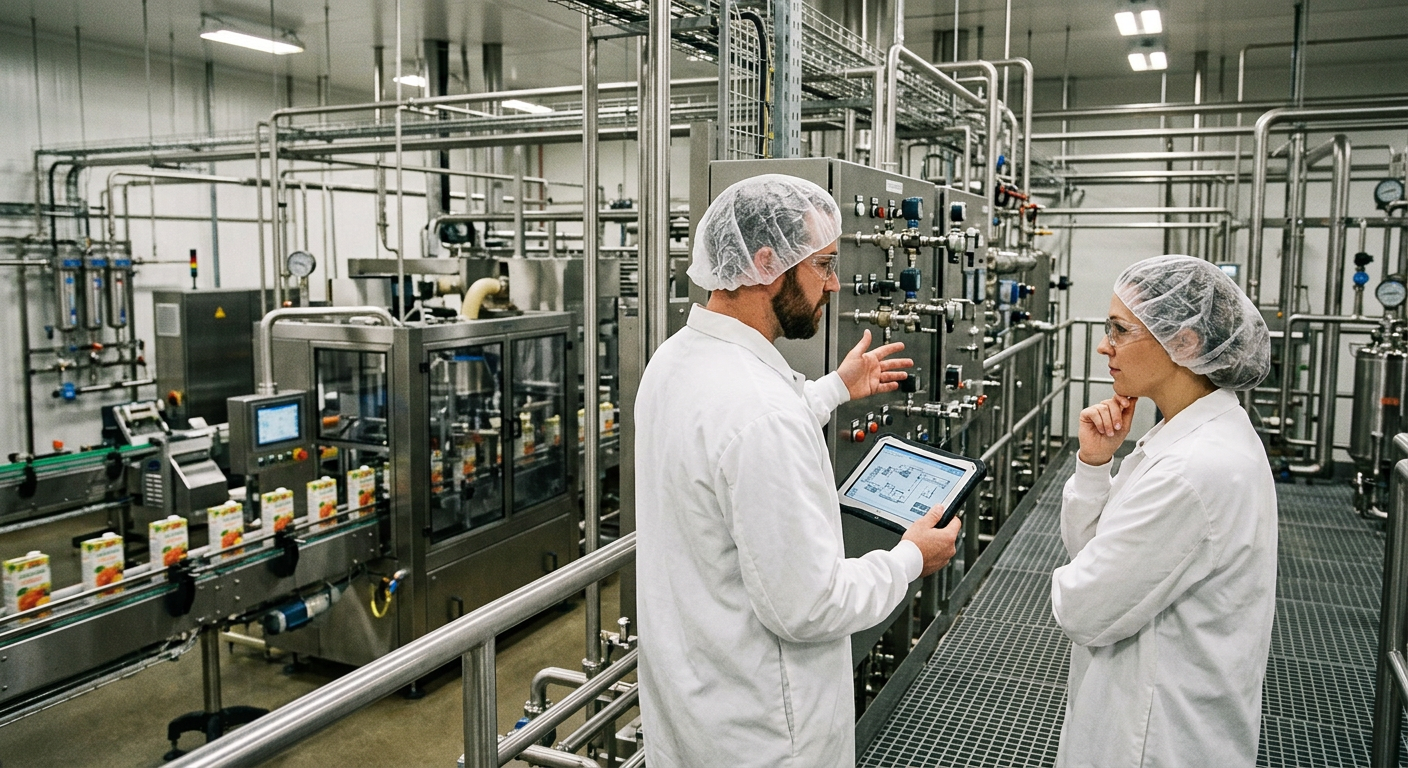
Beverage Plant Feasibility Study
Launching or expanding a beverage manufacturing operation in the United States requires more than a strong formula or a promising brand story. A modern beverage plant feasibility study determines whether a project can succeed commercially, technically, financially, operationally, and regulatorily before capital is committed. For investors, founders, co-packers, breweries, distilleries, dairy beverage manufacturers, and large strategic processors, the right feasibility work reduces waste, exposes hidden constraints, and aligns facility design with a realistic path to profit. In the U.S. market, feasibility analysis must account for regional labor conditions, utility rates, freight lanes, water quality, wastewater discharge rules, FDA expectations, alcohol permitting where relevant, and category-specific consumer demand. A plant that looks attractive on paper can underperform if line speeds are mismatched, if wastewater surcharges are underestimated, if a syrup room is undersized, or if the chosen site lacks enough power or sanitary drainage capacity. That is why experienced engineering and project partners often begin with a disciplined assessment rather than jumping directly into construction drawings or equipment procurement. Disruptive Process Solutions supports manufacturers across all 50 states and Canada with planning, engineering, integration, equipment supply, installation, and execution management. Its approach is especially relevant to beverage projects because feasibility is not treated as a generic report. It is tied to throughput, labor, utility consumption, packaging format, sanitation strategy, and first-year profitability. Readers looking for a practical project partner can learn more about the company, review its broader engineering and project services, explore available process equipment solutions, and see representative project examples. A beverage plant feasibility study is a structured analysis used to determine whether a proposed beverage manufacturing project in the United States should move forward, how it should be designed, what it will cost, what risks it carries, and what operating model gives it the best chance of profitability. It examines market demand, product mix, package types, equipment requirements, utility loads, labor, permitting, site readiness, water and wastewater capacity, food safety design, capital budget, operating costs, and break-even timing. For a startup kombucha facility in Austin, a contract canning operation near Chicago, a dairy beverage line in Wisconsin, or a spirits plant near Louisville, the core question is the same: can the business produce the right volume, at the right quality, at the right cost, in a facility that can legally and reliably operate? A feasibility study answers that question with data rather than optimism. The table above shows why beverage feasibility must be integrated. Market promise alone is not enough; every successful project connects consumer demand to equipment, labor, utilities, and compliance. A beverage plant feasibility study is a decision-making framework used before greenfield construction, brownfield renovation, co-packing expansion, line addition, or capacity relocation. It is broader than a business plan and more practical than a high-level concept deck. In U.S. manufacturing, it usually combines commercial analysis, process engineering, facility planning, cost modeling, and implementation strategy. The scope varies by project type. A ready-to-drink coffee line in New Jersey may focus heavily on thermal processing, filling technology, and refrigerated or ambient distribution assumptions. A carbonated soft drink project near Atlanta may emphasize syrup room design, carbonation, can line speeds, depalletizing, and utility redundancy. A distillery in Tennessee or Texas must also account for TTB permitting, bonded space, explosion protection, and barrel warehousing strategy. A dairy beverage project in California or upstate New York may require tighter sanitary zoning, washdown design, allergen controls, and cold chain modeling. Most strong studies answer five operational questions. First, what products and packaging formats will the plant make: cans, PET bottles, glass, cartons, kegs, bag-in-box, or aseptic packs? Second, what annual and peak volumes must be supported in years one, three, and five? Third, what process architecture is needed: blending, carbonation, fermentation, filtration, HTST, UHT, tunnel pasteurization, hot fill, cold fill, or HPP support? Fourth, what site and utility platform can support those needs at acceptable cost? Fifth, what investment level can the business support without harming cash flow? At this stage, specialized engineering input matters. DPS is known for approaching feasibility with an operations-first mindset rather than simply maximizing project spend. That means challenging assumptions when needed, identifying cheaper ways to unlock capacity, and connecting plant design to commercial outcomes. This is especially valuable for founders and operators who need a plan that works in real manufacturing conditions, not just in a spreadsheet. This table highlights how feasibility must be tailored to product and operating model. A one-size-fits-all report is rarely useful in beverage manufacturing. Market feasibility begins with category selection. The U.S. beverage market is large, but demand is fragmented. Carbonated soft drinks remain high volume, yet growth in many regions is slower than in energy drinks, functional beverages, protein shakes, premium water, low-sugar refreshment, kombucha, spirit-based RTDs, and certain dairy-adjacent formats. Feasibility teams must understand not only national growth but channel-level demand by geography, season, package type, and margin structure. For example, a premium canned mocktail line may perform differently in Los Angeles, Miami, and New York City than in secondary inland markets. A sports hydration beverage may rely heavily on summer seasonality and big-box retail access. A refrigerated probiotic drink must account for shorter shelf life, cold distribution, and retail spoilage risk. A plant built around one category should stress-test adjacent products so the line stays utilized if consumer preferences shift. U.S. trade hubs matter here. Facilities near Chicago can reach major Midwest markets with balanced freight economics. Plants near Dallas-Fort Worth or Houston gain broad access to Texas growth and Gulf logistics. Southern California sites can connect to the Ports of Los Angeles and Long Beach but face higher labor and utility costs. New Jersey and Pennsylvania support dense East Coast population centers. Atlanta, Charlotte, and Nashville offer strong transportation access and growing regional demand. Market feasibility should compare category demand against freight realities, not only consumer trends. By 2026, several trends are likely to shape feasibility decisions: continued pressure toward lower sugar and cleaner labels, automation to offset labor constraints, sustainability claims tied to water and packaging efficiency, tighter retailer expectations around service levels, and stronger scrutiny of ingredient sourcing and traceability. Plants designed only for one short-lived trend may struggle; facilities designed for flexible batching, multiple can sizes, and future product extensions are more resilient. The line chart illustrates why growth category selection matters. High-volume legacy beverages can still be profitable, but faster-growing segments may justify more flexible or premium-capable production systems. The bar chart shows a realistic demand ranking used in strategic screening. High-demand categories may support quicker line utilization, while niche categories need stronger pricing power to justify capex. This table is useful for buying advice. Investors and operators should not choose a category solely because it is popular nationally; they should choose one where local route-to-market, product differentiation, and plant economics align. Technical feasibility converts the business model into an operating system. This is where many beverage projects fail, because founders often underestimate the interaction between process design, packaging speed, sanitation, utility demand, and future expansion. The right technical plan starts with the beverage itself. Is it still or carbonated? Acidified or low acid? Ambient shelf-stable or refrigerated? Alcoholic or non-alcoholic? Pulp-containing or clear? Sensitive to oxygen pickup? Every answer changes the equipment architecture. Typical processing blocks include ingredient handling, water treatment, blending and batching, in-line Brix control, carbonation where needed, pasteurization or sterilization, surge capacity, filling, secondary packaging, CIP, and plant utilities. In some beverage categories, especially premium nutrition or aseptic products, the filler is not the whole story; upstream thermal treatment, hygienic zoning, and recipe repeatability are often the larger technical risk. DPS brings unusual depth to this area. On the technological side, the company works across structural, mechanical, plumbing, electrical, process, and controls engineering, with automation support that includes PLC programming, SCADA, recipe systems, batch control, and integration of complete utility platforms. For beverage manufacturers, that means feasibility can cover fermentation systems, distillation, carbonation and bright tanks, HTST and UHT processing, hot fill and cold fill, aseptic processing, filtration, clarification, reverse osmosis, disinfection, and complete CIP strategy. Instead of viewing equipment as isolated machines, the engineering focus is on throughput, reliability, sanitation, and profitable line balance. Utilities are equally important. A can line rated at 400 cans per minute is not truly feasible if compressed air delivery is unstable, glycol is undersized, boiler capacity cannot support CIP and thermal loads, or the electrical service requires a long utility upgrade lead time. Across the United States, utility availability varies sharply. Sites in Phoenix may face water concerns; California municipalities may impose strict discharge and sustainability expectations; Gulf Coast locations may offer strong industrial infrastructure but require weather resilience planning; older Northeast buildings may need expensive electrical and drainage modernization. The table above helps operators compare options during equipment purchasing. A lower machine price can become more expensive if it creates changeover delays, sanitation issues, or utility inefficiency. On the manufacturing capabilities side, DPS also designs and supplies proprietary process equipment, including tanks up to 12,000 gallons and custom CIP systems, while integrating third-party processing and packaging assets into complete plants. That makes it easier to evaluate whether a project needs fully custom fabrication, a hybrid supply model, or strategic reuse of existing equipment. For clients with fast growth plans, the advantage is not simply buying machinery, but building a phased process platform that can scale from first-year demand to much higher case volumes without reworking the entire utility backbone. Financial feasibility translates engineering and commercial assumptions into a capital decision. In beverage manufacturing, startup cost errors are common because teams focus only on visible line equipment and overlook building improvements, utility infrastructure, water treatment, permitting, warehouse fit-out, controls integration, startup scrap, spare parts, validation, and working capital. A practical U.S. beverage plant model should include both one-time capex and the true operating cost profile of the first 24 months. Startup costs vary widely. A modest pilot and regional production setup may require a few million dollars, while a highly automated multi-line co-packing plant can require tens of millions. Cost drivers include package type, sanitation standard, utility intensity, required speed, degree of automation, and whether the project is greenfield or retrofit. Retrofitting an older food facility in the Midwest can save shell costs but create expensive drainage, slab, or power upgrades. Greenfield sites offer cleaner layout options but higher initial development cost and longer schedules. Revenue models also differ by business type. Brand owners usually model revenue by case sales, pricing tiers, promotional deductions, and channel mix. Co-packers often model by tolling rates, minimum runs, changeover charges, warehouse services, and pass-through ingredient or packaging fees. Breweries and distilleries may layer in hospitality or direct-to-consumer revenue. A good feasibility study stress-tests all of these, not just the base case. The area chart reflects an important 2026 trend: flexible lines are gaining strategic value because they reduce risk when product mix changes. Financially, this often justifies higher capex if utilization is improved across categories or customers. This table shows why break-even analysis must go beyond machine quotations. The true cost of readiness often determines whether a project survives its first year. Break-even modeling should include line efficiency assumptions, not just nameplate speed. If a line is rated for 300 bottles per minute but only runs at 62% OEE after changeovers, sanitation, and minor stops, the business case changes quickly. Sensible revenue models should test low, base, and high scenarios. For many U.S. projects, the most dangerous mistake is assuming immediate utilization. In reality, new plants often ramp in stages as customers are onboarded, operators are trained, and process stability improves. Choosing the right site can save millions of dollars over the life of a plant. Site feasibility should examine logistics, labor, utilities, zoning, food-grade suitability, expansion room, climate exposure, and access to customers or supply nodes. In the United States, beverage manufacturing sites often compete on four dimensions: inbound packaging and ingredient cost, outbound freight efficiency, labor availability, and utility reliability. Facilities near major trade and logistics corridors have obvious advantages. Chicago offers rail, road, and broad Midwest reach. Dallas-Fort Worth supports national freight distribution and Texas demand. Atlanta provides Southeast coverage and labor depth. Charlotte and the Research Triangle attract advanced manufacturing talent. Southern California gives import access through Los Angeles and Long Beach, although cost pressure is high. Savannah and Houston can support port-driven supply chains. Louisville, Nashville, and Indianapolis often work well for central distribution. A feasibility study should model freight from the actual service radius, not from a generic national average. Real estate selection must go beyond square footage. Ceiling height, floor loading, sanitary drainage, truck court size, cold storage capability, room for wastewater pretreatment, utility service entrance size, and future tank farm placement all matter. Beverage facilities also benefit from clean process flow: raw material receipt to batching, thermal treatment, filling, packaging, warehousing, and shipping with minimal cross-traffic. From a service capabilities standpoint, DPS supports feasibility, capital planning, owner’s representation, project and program management, general contracting where licensed, and turnkey installation and integration. That makes site selection more actionable because the analysis does not stop at “good location” or “bad location.” It can extend into conceptual layout, utility routing, construction scope, local trade coordination, and implementation planning. For multi-state clients, this is valuable when comparing a retrofit in Ohio against a greenfield in North Carolina or Texas. The table above is especially helpful for buying or leasing advice. Many operators sign a lease based on rent alone and later discover sewer, drainage, or power issues that erase any apparent savings. Regulatory feasibility is often underestimated until late in the project. Beverage facilities in the United States may be governed by the FDA, the Alcohol and Tobacco Tax and Trade Bureau, state alcohol agencies, local building departments, fire marshals, environmental agencies, and municipal sewer authorities. Which rules apply depends on the product, processing method, and location. For non-alcoholic beverages, core federal obligations usually include FDA food facility registration, compliance with Current Good Manufacturing Practice requirements, preventive controls where applicable, traceability and records readiness, sanitary design, allergen management if relevant, and labeling compliance. Acidified or low-acid products can trigger additional process controls. Dairy beverages may face further state and industry requirements. Alcoholic beverages introduce another regulatory layer. Breweries, distilleries, wineries, and certain RTD operations may need TTB permits, formula approvals, label approvals, bonded space planning, excise tax systems, and state-level manufacturing or distribution permissions. States differ significantly. A project in California, North Carolina, Texas, Kentucky, or Florida can face different licensing timing, local interpretations, and distribution implications. This means regulatory feasibility should be built into the project timeline from the beginning, not treated as paperwork after engineering is complete. By 2026, manufacturers should also expect increased scrutiny around sustainability claims, water discharge, chemical handling, and digital recordkeeping. Facilities planning for long-term enterprise customers may need to align with SQF, BRCGS, or customer-specific audit expectations even if those are not legal requirements on day one. This table demonstrates why compliance should be part of the feasibility budget and schedule. It is not simply a legal task; it shapes layout, process, documentation, and launch timing. Water is both an ingredient and a utility backbone in beverage production. Because of that, water feasibility deserves its own section. Source water chemistry affects taste, consistency, scaling, membrane life, carbonation performance, microbial risk, and cleaning outcomes. Even when municipal water is available, treatment is often necessary to stabilize the process. Water quality evaluation should consider hardness, alkalinity, chloramines, dissolved solids, iron, manganese, silica, microbial load, and seasonal variation. A facility producing premium still beverages may require one treatment profile, while a brewery, distillery, dairy beverage plant, or aseptic line may require a different combination of filtration, RO, UV, ozone, deaeration, or mineral adjustment. Water recovery and reject management should also be included because sustainability and utility cost pressure are increasing across the U.S. Wastewater feasibility is equally critical. Beverage plants often generate high-strength effluent from sugars, organics, yeast, product loss, cleaning chemicals, and rinse water. Municipalities may assess surcharges based on BOD, COD, TSS, pH, and flow. In some regions, direct discharge without pretreatment is not realistic. In others, the economics may favor flow equalization, screening, pH adjustment, DAF, or biological treatment depending on plant size and product mix. Water and wastewater planning is one of the strongest indicators of whether a feasibility study is truly serious. Plants in drought-sensitive Western states, fast-growing Sun Belt municipalities, or older industrial sewer districts often face constraints that are easy to miss during early real estate evaluation. A site that looks ideal logistically can become a poor choice if water and sewer capacity are weak. This comparison chart shows a realistic way to evaluate suppliers or product families during feasibility. The best option is rarely the cheapest piece of equipment; it is the one that balances capital efficiency with room to scale. The table above helps explain why sustainable design is becoming a financial issue, not only an environmental one. By 2026, water reuse, lower chemical consumption, and more efficient CIP design will increasingly influence operating margin and customer perception. No beverage project should be approved based only on a base-case model. Risk assessment tests what happens when the project faces real-world pressure. In the U.S. beverage sector, common risks include demand volatility, ingredient inflation, aluminum and PET pricing swings, utility cost spikes, labor shortages, delayed permits, slower-than-expected startup, customer concentration, and quality failures during launch. Sensitivity analysis usually examines several variables: sales volume, line efficiency, gross margin, packaging cost, labor cost, utility cost, and capex overrun. A project that only works at 95% utilization and perfect margin assumptions is not robust. A more defensible project remains viable even when sales ramp more slowly or when startup scrap is higher than expected. Operational risk should also be considered by product type. Fermented beverages carry biological variability. Aseptic systems have validation and sterility risks. Dairy beverages require tight sanitation execution. Carbonated products may suffer from CO2 supply fluctuations or dissolved oxygen issues. Alcohol projects may face licensing delays or state route-to-market constraints. Regional weather risk matters too: hurricane exposure on the Gulf and Southeast coasts, freeze events in Texas, wildfire logistics disruption in the West, and winter freight interruptions in the Upper Midwest and Northeast. One reason companies bring in DPS for feasibility is that the firm combines engineering, project execution, and business-minded judgment. Its project philosophy emphasizes honest challenge, not passive approval. If a client is planning to spend heavily to solve the wrong bottleneck, the analysis is expected to say so. That type of radical transparency is essential in risk review because the most expensive error is often not a visible machine issue, but a flawed project assumption that nobody questioned early enough. The value of this table is simple: executives can see which variables matter most and build contingency plans before money is spent. In many cases, the right answer is phased investment, flexible equipment selection, or selecting a different site with lower utility or labor risk. As a practical case perspective, beverage projects that scale successfully in the United States usually share three traits. First, they align production capability with a realistic customer pipeline. Second, they build utility and sanitation systems with enough flexibility for future SKU changes. Third, they use experienced owner-side engineering or integrated project leadership to prevent late-stage surprises. Those principles are visible in advanced co-packing, brewing, distillation, soft drink, and aseptic projects across North America. How long does a beverage plant feasibility study usually take in the United States?A focused study may take four to eight weeks, while a complex greenfield or multi-line analysis can take several months depending on site options, process complexity, and permit research depth. What products benefit most from a full feasibility study?High-growth or technically demanding categories such as RTD beverages, dairy drinks, functional products, kombucha, canned cocktails, aseptic beverages, and high-volume carbonated products benefit the most because errors in design or utility planning are expensive. Can a feasibility study help decide between co-packing and owning a plant?Yes. It can compare tolling rates, margin retention, control over quality, volume thresholds, working capital needs, and strategic flexibility. Many brands should begin with co-packing, while others justify ownership once demand stabilizes. What is the biggest hidden cost in beverage plant projects?Utilities and infrastructure are common hidden costs. Water treatment, wastewater management, power upgrades, compressed air, glycol, drainage, and automation integration are frequently underestimated. Do small beverage brands need engineering input this early?Yes, especially if they plan to scale. Early engineering input prevents expensive site mistakes and helps define whether the business should build, retrofit, or outsource production first. How important is wastewater analysis for beverage manufacturing?Very important. Sugars, organics, and cleaning chemicals can create high-strength wastewater that leads to pretreatment requirements or municipal surcharges. Ignoring this can break an otherwise attractive project. What should buyers ask equipment suppliers during feasibility?Ask about actual throughput at your product type, changeover time, sanitation method, spare parts availability, controls compatibility, utility consumption, and whether the equipment can support future packaging formats. Why work with an integrated engineering and execution partner?Because feasibility becomes more accurate when the same team understands design, installation, controls, utilities, and startup. This reduces the gap between concept and real plant performance. What makes DPS relevant for beverage feasibility projects?DPS combines process engineering, capital planning, owner representation, project management, equipment integration, utility design, automation, and turnkey execution for beverage and food manufacturers across North America. Its practical focus is on profitable project outcomes rather than simply increasing project size. What should companies do next after a positive feasibility study?The next step is usually concept design, site control, capital approval, permit planning, equipment strategy, and phased execution scheduling. A strong feasibility study should provide a clear roadmap into that next stage. For U.S. beverage companies, a feasibility study is not a formality. It is the bridge between ambition and execution. Whether the goal is a new co-packing platform, a brewery expansion, an RTD launch, a dairy beverage facility, or an aseptic line, the project should be tested across market demand, technical fit, financial resilience, site readiness, compliance, water strategy, and operational risk. Done properly, the process creates more than a report. It creates a smarter investment path. -
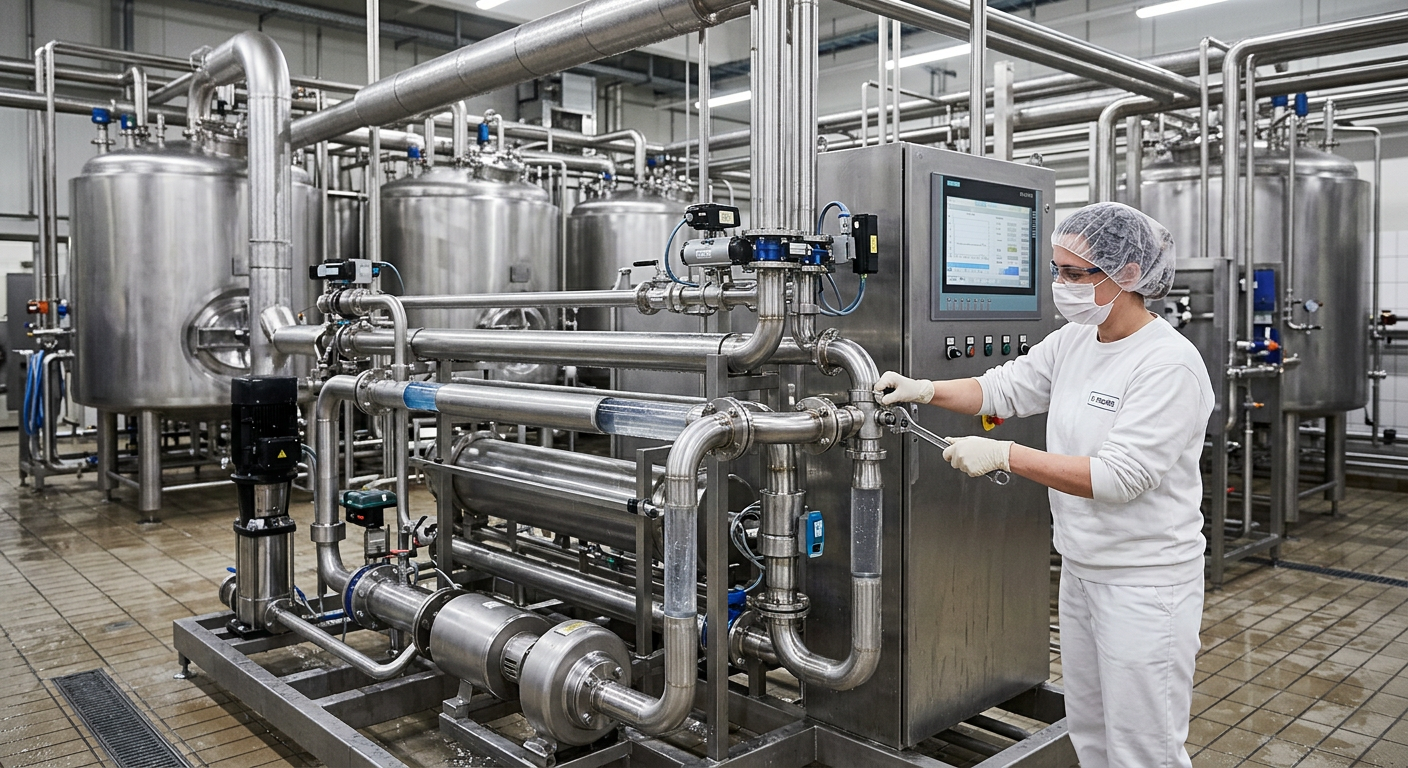
Food Plant Warranty Management: 4 Keys to Equipment Protection
In U.S. food and beverage manufacturing, warranty management is not an administrative afterthought. It is a practical profit protection system that can reduce emergency spend, shorten downtime, recover reimbursable repair costs, and improve supplier accountability. Whether a plant runs protein lines in the Midwest, dairy systems in Wisconsin, aseptic beverage assets in California, or retort operations along Gulf Coast trade routes, the same principle applies: every critical piece of equipment should be registered, tagged, documented, monitored for expiry, and tied to a disciplined claim process. Plants that do this well typically connect four operating disciplines: fast warranty registration at commissioning, a reliable equipment asset registry, clean claim filing procedures, and coordinated maintenance planning. When those pieces work together, procurement, maintenance, finance, operations, and vendors all see the same truth. That matters in large manufacturing corridors such as Chicago, Atlanta, Houston, Dallas-Fort Worth, Charlotte, Fresno, and the port-driven networks around Los Angeles, Long Beach, Savannah, and Newark, where replacement lead times and service responsiveness can vary sharply by supplier and region. For U.S. processors, warranty management also supports 2026 readiness. The next wave of plant investment is being shaped by stronger digital recordkeeping, condition monitoring, sustainability reporting, and stricter expectations around capital efficiency. If a site cannot prove installation dates, service intervals, parts changes, and root cause history, it risks losing legitimate reimbursement and making poor reinvestment decisions. A strong warranty program turns service records into usable business intelligence. The quickest answer is this: protect food plant equipment by treating warranty coverage as part of the asset lifecycle, not as paperwork stored in a drawer. Build a process that starts before startup and continues until coverage expires. Register every qualified asset, centralize serial numbers and commercial terms, store manuals and commissioning documents, assign owners for claims, align preventive maintenance with warranty requirements, and install expiry alerts at 180, 90, 30, and 7 days before end dates. For most U.S. plants, the highest-value assets to prioritize are pasteurizers, fillers, retorts, boilers, compressors, refrigeration systems, CIP skids, pumps, process controls, conveyors, cookers, chillers, and automation panels. Coverage value often depends on whether the site can prove proper installation, startup support, approved spare parts use, and routine service completion. Missing one document can erase thousands of dollars in recoverable costs. A mature equipment protection system delivers five measurable outcomes: For processors expanding capacity or modernizing multiple lines, this should be managed as part of capital planning and plant execution. Companies that combine engineering, installation, and startup oversight often reduce the handoff gaps that cause warranty disputes. That is especially important in complex projects involving utilities, controls, refrigeration, or aseptic systems, where responsibility may be shared across OEMs, installers, and local trades. A strong warranty registration process begins before equipment arrives on site. During procurement, the plant should require every vendor to provide warranty duration, covered exclusions, labor terms, response commitments, commissioning requirements, approved service conditions, and registration deadlines. Many U.S. manufacturers lose coverage simply because registration windows close 30 to 90 days after shipment or startup. The process should move through six stages: This table shows why speed and documentation matter. A plant may have full legal entitlement to coverage, but without clean records, the claim can still stall. The best U.S. operators standardize the process using a digital intake form, a commissioning checklist, and one document repository for vendor files, startup logs, and service instructions. For plants adding new lines or relocating equipment, project controls matter even more. An engineering-led partner can help close those gaps by managing specification review, installation verification, and turnover packages. Processors looking for this integrated support can review plant engineering and project services that connect commercial decisions with execution discipline. The equipment asset registry is the backbone of warranty protection. If your team cannot instantly locate model numbers, serial numbers, purchase dates, startup dates, vendor contacts, spare parts references, and covered components, claims become slow and inconsistent. In busy U.S. plants, this problem is common after expansions, acquisitions, and brownfield retrofits. Your registry should include every asset with meaningful downtime, food safety, utility, throughput, or compliance risk. That means not only major process systems but also drives, sensors, valves, VFDs, PLC cabinets, blowers, heat exchangers, and package handling equipment. For high-throughput facilities in regions such as the Central Valley, the Carolinas, Texas, and the upper Midwest, line stoppages tied to one smaller subcomponent can quickly outweigh the cost of the part itself. The table above explains which fields make the difference between a fast claim and a disputed one. A best-practice registry should connect to the plant CMMS, ERP, and document folders. It should also distinguish among OEM warranty, installer warranty, integrator warranty, and extended service coverage. That is essential for lines that combine multiple skids, controls, and utility tie-ins from different parties. Large U.S. sites often color-code registry criticality by downtime impact. For example, a boiler feed pump in Houston, an ammonia control panel in Omaha, or an aseptic filler valve block in Los Angeles may deserve higher visibility than lower-risk auxiliary equipment. This helps teams focus expiry reviews on assets with the greatest operational and financial exposure. Claim filing procedures should be simple enough for plant teams to use under pressure, yet disciplined enough to stand up in a vendor review. When a failure occurs, time matters. The best plants instruct teams to stop, preserve evidence, notify the right vendor contacts, and document what happened before unauthorized repairs complicate reimbursement. A practical U.S. claim workflow includes these steps: This table is useful because many claim losses come from process breakdown, not technical merit. Teams replace the part, throw away the evidence, and later discover the OEM required inspection. Or they call a local technician who is not approved under the original terms. A clean procedure prevents these avoidable errors. Plants should also classify claims by type: defective part, workmanship issue, startup deficiency, controls logic issue, utility interaction, consumable exclusion, or operator damage. This creates better vendor scorecards and improves future buying decisions. In regions with heavy seasonal production, such as fruit, dairy, and beverage peaks, fast diagnosis can protect throughput during narrow operating windows. Warranty value rises when vendor coordination is structured instead of reactive. Every plant should maintain a vendor responsibility matrix showing who owns equipment supply, field installation, controls integration, startup support, training, and local service. Without that clarity, suppliers may point at each other while the plant absorbs the cost. Vendor coordination is especially important on integrated systems such as CIP installations, retort rooms, aseptic skids, process water systems, blending rooms, compressed air networks, and utility distribution. A failed instrument may be covered by one party, while the enclosure or programming issue belongs to another. During complex expansions near logistics hubs like Kansas City, Memphis, or the Port of Savannah, these handoffs can affect schedule, throughput, and reimbursement. The explanation here is straightforward: the more interfaces a project has, the more important coordination becomes. One way to reduce friction is to work with a firm that can bridge engineering, installation management, and startup. That model is valuable when projects involve process, mechanical, electrical, controls, and utility scopes under one execution framework. For example, Disruptive Process Solutions supports manufacturers across the United States and Canada with engineering, capital planning, project leadership, integration, and turnkey installation support. Because projects often include both custom process systems and local trades, a coordinated delivery model can reduce the warranty ambiguity that appears after turnover. Readers can learn more about the company’s background on the company overview page. Preventive maintenance alignment is one of the most overlooked protections in warranty management. Many warranties require proof that the equipment was maintained according to OEM instructions. If lubrication intervals, seal inspections, calibration steps, or sanitation procedures are skipped, the supplier may argue that the failure was caused by site neglect rather than product defect. Maintenance planners should therefore map PM tasks directly to warranty obligations. This is particularly important in food environments where washdown, chemical exposure, thermal cycling, vibration, and aggressive production schedules can accelerate wear. In poultry plants across Arkansas and Georgia, dairy sites in Wisconsin, beverage lines in North Carolina, and protein processing operations in Texas, environmental conditions often influence whether a component fails inside or outside expected performance limits. An aligned PM program should include: Plants should also set rules for modification control. If a site rewires a panel, substitutes a motor, changes process temperatures, or alters controls logic without approval, warranty entitlement may change. A cross-functional review board can catch these issues before unauthorized changes undermine recovery rights. The line chart above illustrates a realistic market direction: more U.S. manufacturers are digitizing asset and warranty records as plants modernize controls, connect CMMS platforms, and tighten cost governance. The growth is driven not only by software adoption but also by pressure to preserve capital and reduce avoidable maintenance spend. An expiry alert system turns passive records into active protection. Coverage is most valuable in the final months before expiration, when hidden defects often become visible under sustained production. If the team sees the end date only after a failure, the plant may lose its last chance to document recurring issues or request remedial work. At minimum, every covered asset should trigger alerts at 180, 90, 30, and 7 days before expiry. High-risk assets should also trigger a review meeting at 120 days to evaluate service history, unresolved defects, chronic downtime patterns, and vendor follow-up needs. This is especially useful for refrigeration, thermal processing, automation, and utility infrastructure where latent issues can become major outages later. This table matters because alerts should do more than send emails. They should trigger a workflow, a responsibility, and a deliverable. Plants that automate reminders but do not assign accountability still miss recovery opportunities. The bar chart compares demand pressure by industry segment. Aseptic, protein, and beverage operations often rank highest because line complexity, sanitation intensity, and downtime cost amplify the value of disciplined warranty controls. Budget recovery optimization means turning warranty administration into a finance-supporting discipline. The objective is not only to get a replacement part, but to recover credits, reduce emergency labor costs, improve spare planning, and influence future sourcing decisions. In an era of volatile lead times and tight margins, this can materially affect the total cost of ownership. Plants should track warranty recovery as a measurable KPI set. Useful metrics include claim submission rate, approval rate, average settlement days, recovered dollars by vendor, labor reimbursement captured, repeat failures by asset class, and claims missed due to documentation gaps. Sites that analyze this quarterly can identify which suppliers consistently support the plant and which create hidden cost leakage. Budget recovery also improves capital planning. If repeated claims show chronic weakness in pump seals, controls enclosures, or heat transfer components, the next purchase can be respecified. That may justify spending more up front for stronger reliability. In U.S. markets with heavy logistics exposure, such as Gulf Coast beverage corridors or West Coast import-driven equipment sourcing, better specification discipline can prevent recurring post-installation pain. 2026 trends will make this even more important. Three shifts are becoming more visible: A site that already has clean warranty and asset records will be better positioned to respond to those changes. Plants that do not may struggle to justify replacements, defend supplier disputes, or optimize maintenance budgets. The area chart highlights the trend shift from paper-heavy recordkeeping to automated expiry tracking. That shift is being accelerated by labor constraints, remote support expectations, and the need for faster visibility across multi-site manufacturing portfolios. Disruptive Process Solutions serves food and beverage manufacturers across all 50 U.S. states and Canada with an operating approach built around profitable capital execution. Rather than acting only as a traditional contractor, the company supports clients as a business-minded engineering and project partner that focuses on long-term manufacturing performance, not just project closeout. From a technological capability standpoint, DPS works across process, mechanical, plumbing, electrical, and controls disciplines. That includes automation, PLC programming, SCADA, utility integration, and complex process systems such as pasteurization, aseptic processing, blending, carbonation, retort, fermentation, distillation, water treatment, refrigeration support, and CIP design. This matters for warranty management because technical clarity at design, installation, and startup reduces the gray areas that often create disputes later. From a manufacturing capability standpoint, DPS supports both beverage and food operations, including brewing, spirits, wine, RTD, soft drinks, juice, dairy beverages, proteins, prepared foods, sauces, ingredients, dairy processing, plant-based systems, and specialized clean-processing environments. The company also manufactures selected branded process equipment such as tanks, CIP systems, tumblers, and cooking vessels. Manufacturers evaluating integrated equipment solutions can review process equipment capabilities for examples of supplied systems. From a service capability standpoint, DPS provides engineering design, feasibility support, owner’s representation, project and program management, general contracting where licensed, installation coordination, and end-to-end system integration. For clients, that means fewer handoff failures between design intent, field execution, and operational turnover. This is particularly valuable in complex projects where warranty rights depend on documented startup conditions, local trade coordination, and clearly assigned responsibility. The company’s work spans greenfield and brownfield projects, rapid-response plant needs, and strategic portfolio planning. For manufacturers that want to see how integrated execution can perform in real operating environments, the project case studies section offers practical examples. 1. Which food plant assets should be registered first?Start with line-critical assets: fillers, pasteurizers, retorts, boilers, compressors, refrigeration systems, CIP skids, major pumps, control panels, and sanitation-sensitive equipment. If a failure can stop production or create compliance risk, it should be prioritized. 2. Is a spreadsheet enough for a small or mid-sized U.S. plant?A spreadsheet can work temporarily, but only if there is tight version control and assigned ownership. Once a plant has multiple lines, multiple vendors, or repeated capital projects, linking records to a CMMS or asset platform is usually safer and faster. 3. What is the most common reason claims are denied?Incomplete evidence is one of the most common issues. Missing startup records, PM logs, serial numbers, photos, or timely notice to the vendor can turn a valid claim into a disputed one. 4. How should plants handle relocated or used equipment?Assume nothing. Some warranties do not transfer after relocation or resale. Before moving assets between sites in states such as Texas, North Carolina, California, or Illinois, confirm written transfer terms and any re-commissioning requirements. 5. Should warranty data be reviewed with finance?Yes. Finance should track recovered credits, avoided spend, repeated failures, and supplier performance. Warranty data is not just a maintenance tool; it is part of capital stewardship and budget recovery. 6. How often should vendor performance be reviewed?Quarterly is a good baseline, with monthly review for line-critical suppliers. Include response time, claim approval rate, repeat failure history, parts availability, and field service quality. 7. What should plants do before coverage expires?Run a targeted inspection of high-value assets, review downtime history, submit unresolved claims, and document any recurring defects. The last 90 days before expiration are often the best chance to resolve latent issues. 8. How do sustainability trends affect warranty strategy for 2026?Plants are increasingly evaluating service life, repairability, utility efficiency, and digital documentation. Warranty records help prove whether equipment is meeting expected performance and support smarter replacement decisions. For U.S. manufacturers buying new equipment, warranty language should be negotiated as seriously as mechanical specifications. Ask whether labor is included, whether remote diagnostics count as response, whether local service is available near your plant, and whether replacement parts will be staged in regional hubs. This is important for plants far from major service centers, including some inland facilities in the Plains, Mountain West, and upper Midwest. Buyers should also review supplier footprints. Vendors with support near major freight and industrial corridors such as Houston, Chicago, Atlanta, Charlotte, Los Angeles, and Philadelphia may respond faster than suppliers who rely on distant dispatch. Plants operating near ports or intermodal hubs often benefit from better parts availability, but should still verify service SLAs in writing. The final buying advice is simple: tie the warranty program to the project turnover package. If the turnover package does not include asset IDs, serial records, startup reports, PM requirements, contact lists, and expiry dates, it is incomplete. That discipline protects both uptime and capital. The comparison chart shows why integrated supplier or project-delivery structures often produce stronger warranty outcomes. When documentation, startup, and technical accountability are coordinated, plants typically recover issues faster and reduce avoidable disputes. In summary, effective equipment protection in U.S. food and beverage plants depends on disciplined registration, a live asset registry, structured claim procedures, vendor coordination, maintenance alignment, expiry alerts, and budget recovery tracking. These are not abstract best practices. They are operational controls that influence downtime, supplier accountability, and plant profitability across every major manufacturing region in the country. -
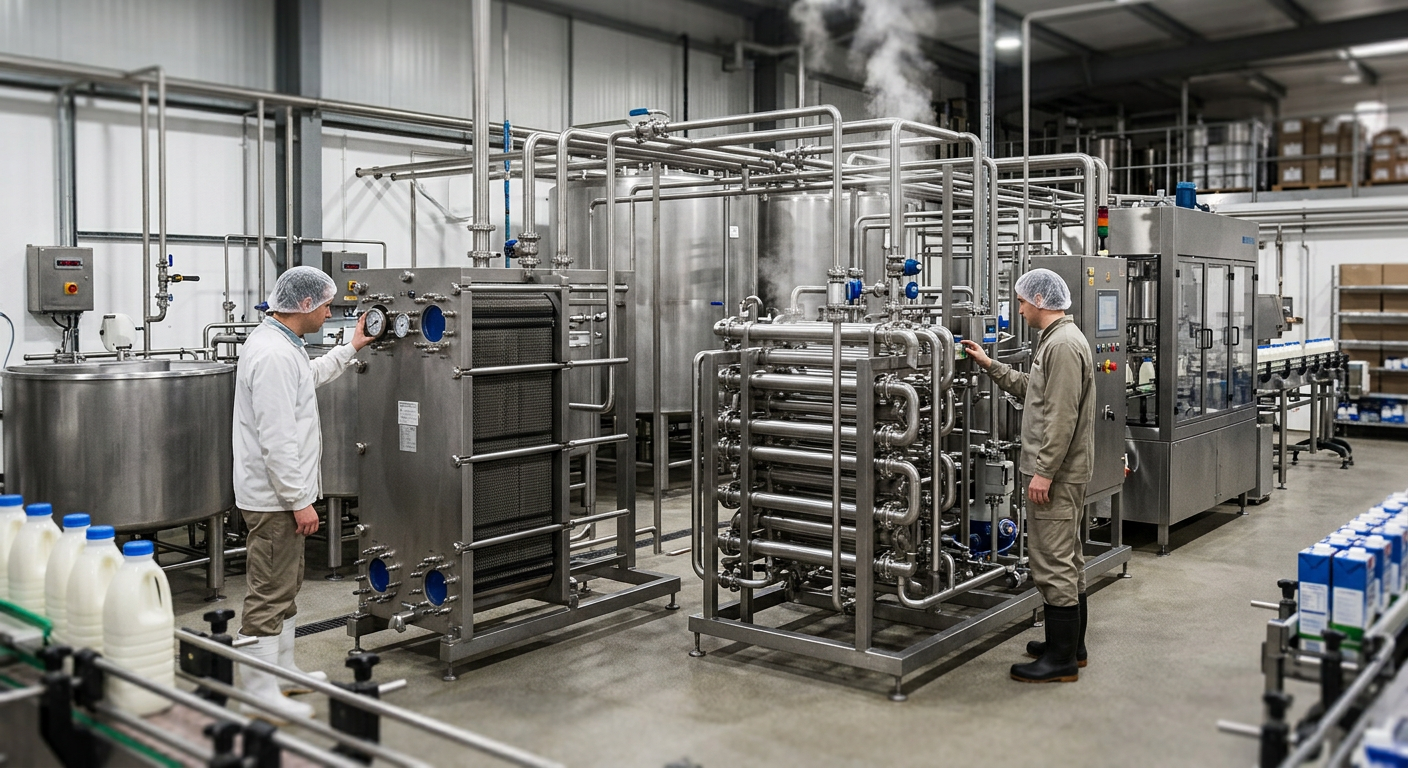
Food Plant Feasibility Study Services
Food manufacturers in the United States face a costly question before expanding, relocating, or building a new facility: will the project produce profitable, compliant, and scalable operations? A food plant feasibility study answers that question with evidence. It tests commercial demand, process fit, equipment needs, utility loads, workforce realities, capital cost, operating cost, regulatory exposure, and execution risk before major money is committed. For companies planning projects in markets such as Texas, California, the Midwest, the Southeast, or major logistics corridors tied to the ports of Los Angeles, Long Beach, Houston, Savannah, and Newark, a disciplined feasibility analysis can prevent expensive overbuilding, under-sizing, or compliance mistakes. This guide explains how a feasibility study works, what it should include, how buyers should compare service providers, and why an engineering-led approach matters when evaluating beverage, dairy, protein, prepared foods, sauces, aseptic, retort, and co-packing operations across the United States. A food plant feasibility study is a pre-project analysis used to determine whether a new plant, expansion, retrofit, equipment line, or facility relocation makes business sense in the United States. It typically covers market demand, product mix, process design, equipment selection, layout, utilities, labor, food safety compliance, environmental considerations, CAPEX, OPEX, schedule, and risk. For most manufacturers, the study should deliver a decision-ready roadmap rather than a generic report. The best outcome is not simply a “yes” to build. It may also identify that a lower-cost debottlenecking strategy, automation upgrade, controls reprogramming, or phased expansion will create better returns than a full capital project. The table above shows why feasibility work should be tied to practical business decisions. In the U.S. market, where food plants often face labor shortages, utility constraints, and rising construction costs, each row becomes a major source of either value or risk. A food plant feasibility study is a structured investigation completed before detailed engineering and construction begin. Its purpose is to confirm whether a planned processing operation is commercially viable, technically achievable, financially justified, and legally compliant. In the United States, this type of study is especially important because food and beverage projects often involve highly regulated processing environments, specialized sanitation requirements, utility-heavy equipment, and strict product integrity standards. A new ready-to-drink beverage line in North Carolina, a protein plant upgrade in Nebraska, a dairy expansion in Wisconsin, or a retort project in California may all require different assumptions, yet each needs the same disciplined front-end evaluation. A strong study usually applies to one of five common situations: It should also answer a more strategic question: is this the right project, in the right place, at the right scale, for the right products? That distinction matters. Many manufacturers assume feasibility means proving the project should move forward. In reality, the best studies may recommend resizing the scope, changing processing technology, selecting a different site, or delaying capital until demand stabilizes. For buyers comparing providers, one warning sign is a consultant who jumps straight to equipment lists without understanding product mix, cleaning strategy, SKU changeover frequency, utility redundancy, and long-term commercial goals. A plant that looks good on paper can still fail in execution if process assumptions are wrong. Choose a feasibility partner that understands both engineering and manufacturing economics. Owners should ask whether the provider can connect conceptual design with installable systems, local trade coordination, startup realities, and post-study execution. A study is more useful when it is written by people who know what actually happens in U.S. plants from Fresno to Charlotte and from Chicago to Dallas-Fort Worth. While every study should be customized, six core components appear in nearly all successful food plant feasibility analyses. The six components above work together. Market demand supports sizing. Technical design defines utility and labor requirements. Compliance standards affect layout and equipment selection. Financial models depend on all of them. When one section is weak, the entire study becomes less reliable. In the United States, feasibility studies frequently cover beverage processing, breweries, distilled spirits, wine, kombucha, juices, dairy beverages, RTD products, meat and poultry, seafood, plant-based proteins, prepared foods, sauces, dressings, dairy foods, retort products, aseptic products, and co-packing operations. Each category has unique hygienic design, heating, cooling, filling, traceability, and cleaning requirements. Market feasibility tests whether the planned plant has enough demand to justify investment. This is more than a top-line category growth check. It should assess regional distribution access, freight economics, customer concentration, competitive intensity, margin structure, channel mix, and how quickly the facility can ramp. For example, a beverage plant near Southern California may benefit from population density, port access through Los Angeles and Long Beach, and reduced inbound lead times for some packaging materials. A protein facility in Kansas or Nebraska may be closer to raw material supply. A co-packer in Georgia may gain from Southeast distribution reach through Atlanta and the port of Savannah. These geographic differences influence both plant economics and market risk. In 2026, market feasibility work is expected to place greater weight on resilience factors such as domestic ingredient sourcing, flexible packaging lines, retailer pressure for shorter lead times, and sustainability expectations from national brands. This market table shows why feasibility should not rely on national demand averages alone. A plant serving refrigerated foods in the Northeast behaves differently from a shelf-stable sauce line serving the Southwest. Recent U.S. demand has been especially active in co-packing, functional beverages, aseptic lines, automation upgrades, prepared foods, and protein processing. That is partly due to labor constraints, category diversification, and retailer demand for agile supply bases. These data points are illustrative but realistic for strategic planning. They reflect the fact that high-growth product categories often demand greater front-end feasibility work because scale, sanitation, utilities, and packaging flexibility all become more complex. Technical feasibility determines whether the plant can actually produce the intended products safely, efficiently, and at the required volume. This section should convert commercial goals into operating reality. Core questions include: Technical feasibility is where an engineering-led team adds significant value. For U.S. manufacturers, this often means balancing process performance with real-world building constraints, local permitting, utility company requirements, refrigeration loads, wastewater limitations, and labor skill levels. When evaluating providers, buyers should prefer teams that understand process engineering, controls, automation, utility systems, and installation integration together. A concept drawing without execution knowledge can create severe downstream cost growth. The technical table demonstrates how each area of the plant ties directly to utility demand and operational reliability. For instance, beverage or dairy projects may hinge on CIP design and precise thermal control, while protein and prepared foods rely heavily on sanitation zoning, drainage, and environmental separation. Across U.S. food and beverage projects, advanced feasibility studies increasingly evaluate fermentation systems, distillation, pasteurization, UHT, tunnel pasteurization, retort, HPP interfaces, carbonation, inline Brix control, filtration, water treatment, grinding, mixing, emulsification, cooking, smoking, slicing, dairy processing, aseptic design, refrigeration, and integrated SCADA. These technologies must be assessed as a connected system, not as isolated equipment purchases. A capable engineering partner should also review whether a simple automation change could unlock capacity. In some facilities, the real bottleneck is not a missing piece of stainless equipment but recipe logic, conveyor timing, CIP sequencing, or utility distribution. Financial feasibility translates the concept into investment logic. U.S. project sponsors typically need a realistic estimate of total installed cost, operating cost, working capital impact, and payback timing before approving a project. A thorough model should include direct process equipment, utility systems, controls, structural modifications, MEP work, site work, GC and construction management costs, contingency, startup support, training, permitting, and owner-side costs. OPEX should capture labor, maintenance, utilities, sanitation, packaging loss, waste, ingredients, freight, and quality-related costs. One of the most common mistakes in U.S. food manufacturing projects is focusing on equipment price while underestimating installation complexity, electrical upgrades, wastewater treatment, HVAC, ammonia or glycol infrastructure, and schedule-related cost growth. The explanation above highlights why total installed cost matters more than isolated equipment pricing. In many projects, hidden utility and integration work can materially change the return profile. These comparison scores reflect a frequent U.S. reality: debottlenecking and automation projects often produce faster returns than full greenfield builds, especially when commercial demand is still maturing. Ask whether the study includes phased build options, downside scenarios, utility escalation sensitivity, and startup ramp assumptions. The best advisors do not simply estimate cost; they help owners avoid spending capital where it is not needed. Regulatory feasibility examines whether the planned facility can meet all applicable U.S. food safety and compliance obligations. Depending on product type, that may involve FDA oversight, USDA inspection, FSMA preventive controls, sanitation design standards, labeling considerations, environmental controls, and third-party audit requirements such as SQF or BRC. This section should not be treated as a late-stage checklist. Compliance directly affects plant layout, personnel flow, air handling, equipment design, hygienic zoning, allergen segregation, cleaning systems, documentation practices, and startup readiness. For example, a USDA-inspected protein plant requires a different design and operating structure than an FDA-regulated beverage plant. An aseptic line introduces additional validation and control requirements. A co-manufacturing site handling multiple allergens needs stronger segregation logic than a single-product line. For 2026 and beyond, regulatory feasibility will increasingly include traceability expectations, digital records, water stewardship scrutiny, energy reporting pressure from large customers, and more robust supplier verification frameworks. Aseptic processing, dairy, ready-to-eat protein, plant-based products, infant-adjacent nutrition systems, acidified foods, and co-packing facilities with multiple customers tend to require deeper regulatory planning. This is where early design discipline prevents expensive rework during commissioning. Every food plant project carries risk. A feasibility study should identify it early, quantify likely impact, and assign mitigation actions. Good risk analysis covers both project delivery and operating performance. Typical U.S. risks include long equipment lead times, utility service delays, permitting uncertainty, wastewater discharge limits, labor shortages, site drainage deficiencies, refrigeration complexity, contractor availability, owner decision lag, packaging supply volatility, and slower-than-expected customer ramp. Risk assessment is especially important in national logistics hubs. For instance, projects around Houston, Chicago, or Southern California may benefit from supply access but still face labor competition, permit queues, and construction resource pressure. Rural sites may gain space and lower land cost but struggle with skilled labor and utility redundancy. This table is valuable because it turns uncertainty into decisions. Risk is not reduced by optimism; it is reduced by visibility, ownership, and contingency planning. Strong feasibility providers often bring practical examples of how early analysis changed project direction. In some cases, owners were preparing to spend millions on new capacity when controls changes or targeted equipment replacement could deliver higher throughput for far less capital. That kind of honest recommendation usually signals a partner focused on long-term client profitability rather than short-term project revenue. To review relevant project experience, many buyers also examine a firm’s food and beverage project case studies to see how studies translate into execution outcomes. A typical food plant feasibility study in the United States takes four to twelve weeks depending on project complexity, available data, and how many alternatives are being analyzed. Greenfield projects, multi-line plants, and regulated processing environments usually take longer than focused debottlenecking studies. The timeline should be structured around clear decision gates. Owners should expect more than a final slide deck. Deliverables should include practical design and business outputs that can guide budgeting, approvals, and next-phase engineering. The timeline table helps owners understand what should happen and when. If a provider promises a highly technical, multi-variable feasibility study in just a few days, that usually means assumptions will be shallow. Feasibility work in the United States should account for local supplier ecosystems and trade conditions. A project in North Carolina may have different mechanical contractor availability than one in California. Refrigeration support in the Midwest may be easier to source than specialized aseptic trades in a smaller market. Ports, intermodal hubs, and trucking lanes also influence equipment delivery and installation planning. Owners should ask feasibility partners how they account for regional construction conditions, local code interpretation, utility provider responsiveness, and trusted vendor networks. This matters in markets such as Raleigh-Durham, Charlotte, Atlanta, Nashville, Minneapolis, Omaha, Houston, and the Inland Empire. Disruptive Process Solutions supports food and beverage manufacturers across the United States and Canada with an approach centered on profitable capital planning and executable engineering. Rather than treating feasibility as an isolated document, the firm connects front-end strategy to design, procurement, field execution, and startup support. On the service side, DPS provides capital planning, feasibility studies, owner’s representative support, project and program management, general contracting functions where licensed, and turnkey installation and system integration. Companies evaluating expansion concepts can review broader engineering and project delivery services to understand how early planning carries through to execution. On the manufacturing side, DPS also develops branded process equipment such as tanks, custom CIP systems, marination tumblers, and cooking vessels. That gives the team practical insight into fabrication realities, sanitary design details, and integration requirements that directly affect feasibility quality. Additional information on available process equipment capabilities can help buyers understand product fit. On the technology side, DPS works across process, mechanical, plumbing, structural, electrical, and controls scopes, including PLC programming, automation, SCADA, thermal processes, water treatment, batching, fermentation, aseptic systems, retort, dairy processing, protein systems, and utility infrastructure. This matters because most food plant feasibility failures begin when process, utilities, controls, and building constraints are reviewed in silos rather than as one operating system. For companies seeking a partner profile and operating philosophy, the company overview provides additional background on its design-build-manage model and national project reach. If these elements are missing, the study may be too superficial to guide real investment decisions. Costs vary widely by scope. A focused debottlenecking study may be modest, while a multi-line greenfield analysis with layouts, utilities, and financial modeling will be more substantial. The right comparison is not study price alone but the value of avoided capital mistakes. Start as soon as strategic intent is clear and before equipment is committed. The ideal time is before site purchase, lease execution, or long-lead procurement. Operations, engineering, maintenance, quality, food safety, finance, supply chain, and executive leadership should all participate. Commercial teams are also important when demand assumptions drive plant size. Yes. In many cases, the best answer is to debottleneck an existing line, automate a bottleneck, relocate selected assets, or phase investment over time instead of building a larger facility immediately. Many U.S. projects take four to twelve weeks depending on data quality, facility complexity, and number of options considered. Beverage, dairy, protein, prepared foods, sauces, aseptic, retort, fermentation, and co-packing operations benefit heavily because process performance, compliance, and utilities are tightly linked. Yes. Freight, labor, raw material access, utility reliability, wastewater rules, and permitting timelines can materially change project economics between regions such as California, Texas, the Midwest, and the Southeast. Expect greater focus on automation-led capacity gains, digital traceability, flexible multi-SKU lines, energy management, water reuse, workforce efficiency, and stronger customer expectations around compliance and sustainability reporting. A food plant feasibility study is not just an early planning exercise. In the United States, it is the tool that connects market demand, engineering truth, compliance reality, and financial discipline before major capital is committed. For owners who want profitable projects rather than expensive assumptions, feasibility is where smart capital truly meets smart manufacturing. -
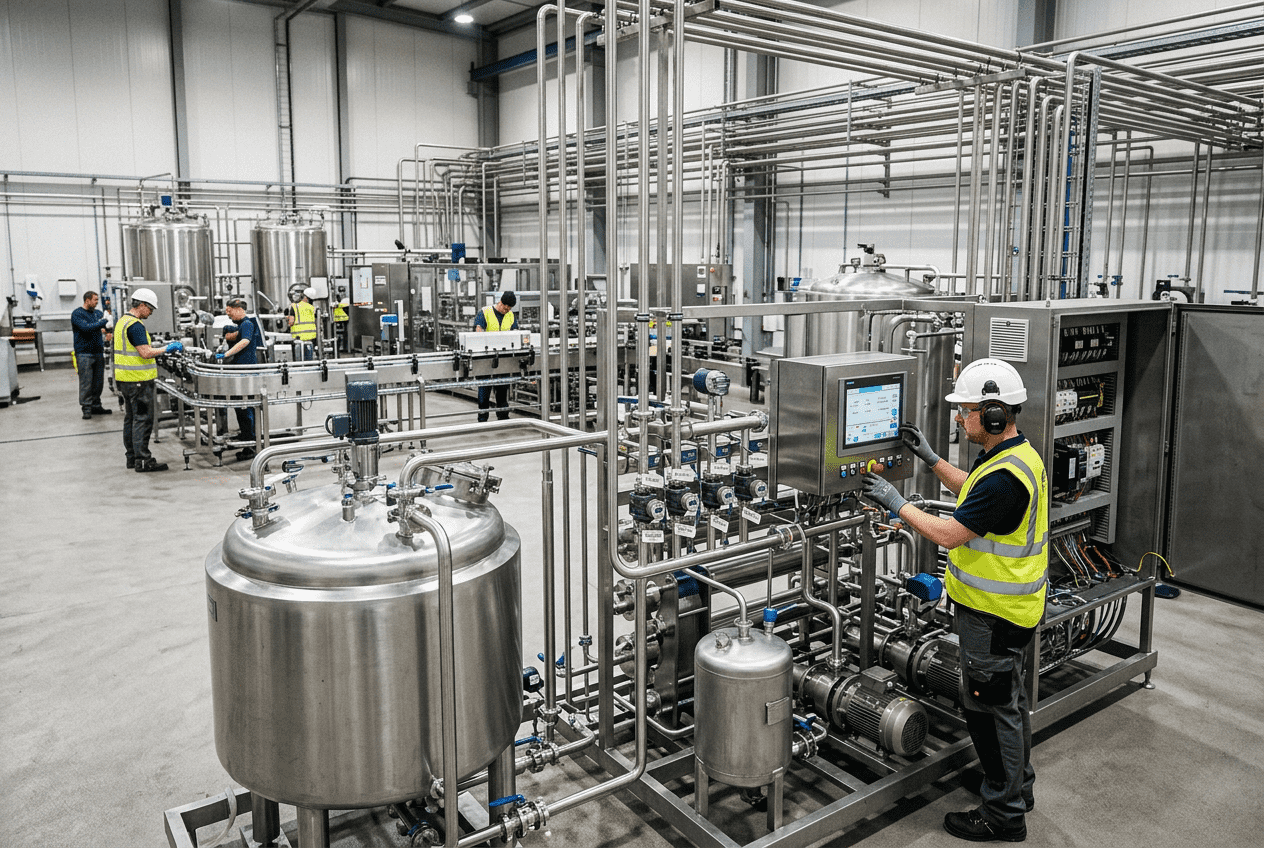
2026 Food Plant Construction Quality Assurance Framework
Food and beverage capital projects in the United States must do more than meet schedule and budget targets. They must also prove that equipment, utilities, installation methods, and startup practices are safe, sanitary, traceable, and fit for long-term production. A strong quality assurance framework helps owners, engineers, contractors, integrators, and regulators align around measurable standards before construction starts and before final turnover occurs. This guide explains how a modern quality program should work for new builds, expansions, retrofits, line relocations, utility upgrades, sanitary piping projects, aseptic rooms, packaging halls, dairy systems, protein processing plants, beverage syrup rooms, and co-packing facilities across the United States. It is written for plant owners, operations leaders, project managers, maintenance teams, investors, and procurement groups looking for practical acceptance criteria that support FDA, USDA, SQF, and BRC expectations. The quick answer is this: a food plant construction quality assurance framework in the United States should combine documented inspection and testing protocols, material verification, workmanship standards, sanitary installation requirements, non-conformance management, corrective action procedures, and final acceptance criteria into one controlled project system. In practice, that means every weld, slope, support, valve, instrument, cable tray, floor penetration, clean utility line, and commissioned asset must be checked against approved drawings, specifications, hygienic design rules, and owner performance requirements before handover. For most projects, the strongest framework includes seven layers of control: In the U.S. market, project quality is also shaped by geography and supply chain realities. A dairy expansion in Wisconsin, a beverage line in North Carolina, a meat facility in Kansas City, a port-adjacent processing plant near Houston, or an aseptic packaging project in California may face different labor pools, inspectors, utility conditions, and material lead times. That is why the quality system must be standardized at the policy level but flexible at the field execution level. Owners should also evaluate whether the delivery partner can integrate design intent, construction oversight, and startup accountability. Firms that manage engineering, installation, and execution under one coordinated model typically reduce rework, shorten decision cycles, and improve final acceptance outcomes because fewer handoff gaps exist between design, fabrication, field installation, and commissioning. The table above shows why quality assurance should not be treated as a single final walkthrough. Each element supports the next, and weak control at an early step usually creates more expensive problems during startup. This line chart reflects a realistic market view: U.S. manufacturers are increasing spending on validation, documentation, traceability, and hygienic construction oversight as capacity expands and audit pressure rises. Inspection and testing protocols are the backbone of project control. In a food plant environment, they should be based on approved drawings, equipment submittals, code requirements, owner specifications, process risk, and sanitation sensitivity. The protocols must define what gets inspected, who performs the inspection, what acceptance limits apply, what documentation is required, and what happens if results fall outside tolerance. In the United States, an effective protocol commonly covers structural steel, concrete, floor flatness and drainage, utility rough-in, sanitary process piping, clean-in-place circuits, steam systems, compressed air, glycol, refrigeration interfaces, electrical distribution, controls panels, PLC inputs and outputs, network communication, equipment anchoring, washdown protection, and commissioning tests. The stricter the hygiene or uptime requirement, the more formal the test plan should be. Inspection should happen at three levels: Projects in major processing corridors such as Chicago, Minneapolis, Fresno, Atlanta, Charlotte, Dallas-Fort Worth, and the I-95 corridor often face aggressive schedules. That creates pressure to push work forward before checks are complete. The best quality teams resist that pressure by using hold points, witness points, and release checkpoints that must be cleared before the next activity begins. The table shows that different systems require different test methods. A sanitary piping line cannot be accepted using the same criteria as a motor control center or drainage slab. The protocol must be system-specific and risk-based. Where possible, project teams should also link inspection data to digital turnover packages. That speeds owner review, supports audit readiness, and helps maintenance teams years later when they need to troubleshoot a utility branch or confirm the metallurgy of a replacement spool. Manufacturers planning a capital project can review integrated project and field execution options through food and beverage engineering services that connect design, construction, and startup under one coordinated delivery approach. This bar chart highlights where formal inspection and testing requirements are strongest. Aseptic, beverage, and co-packing projects often need tighter documentation because product mix, changeover frequency, and customer audits are more intensive. The material verification process protects the plant from one of the most common and expensive causes of rework: installing the wrong material in the right place. In food and beverage projects, correct metallurgy, surface finish, gasket composition, elastomer compatibility, pressure class, and cleanability are not optional details. They are core compliance and performance requirements. A disciplined process begins before material arrives on site. Purchase orders should clearly identify required grades such as 304 or 316 stainless steel, sanitary finish expectations, elastomer standards, utility service limits, and any owner-approved manufacturer lists. Once components reach the facility, the receiving team should verify tags, certificates of conformance, mill test reports, dimensional condition, packaging integrity, and shipping damage. Critical materials that often require elevated scrutiny include: U.S. projects with imported components moving through ports such as Los Angeles, Long Beach, Savannah, Newark, or Houston especially benefit from stronger incoming controls. Long transit chains increase the risk of substitution, shipping damage, missing documentation, and packaging failures. The explanation is straightforward: verification creates traceability, and traceability creates defensible acceptance. If an owner later faces an audit question or corrosion issue, the project record should show exactly what was installed and why it was accepted. Technology also improves this step. Many high-performing projects now use QR-coded receiving logs, digital certificates, photo-based condition capture, and linked NCR workflows. These tools are valuable for multi-state programs where plants may have similar standards but different local storage and handling conditions. Workmanship standards translate design intent into field reality. In a food plant, good workmanship is not merely neat appearance. It is measurable installation quality that protects hygiene, reliability, maintainability, and safety. The standard should define what acceptable work looks like across every discipline and how supervisors verify it. For mechanical installation, this includes alignment, support spacing, sanitary orientation, drainability, weld quality, torque control, insulation finish, and access for maintenance. For electrical and controls work, it includes labeling, routing, washdown suitability, panel cleanliness, grounding, strain relief, and termination quality. For building and architectural work, it includes sealed penetrations, smooth transitions, durable hygienic finishes, and proper moisture management. One of the biggest workmanship failures in U.S. food plants is installing correct equipment in a way that makes cleaning or maintenance harder. Examples include blocking access to pump seals, creating water traps in support legs, routing conduit over high-hygiene zones without proper shielding, or leaving rough floor-to-wall transitions in washdown rooms. Workmanship standards should therefore be written with operational usability in mind, not just contractor convenience. A project that technically matches the drawing but creates a sanitation burden should not be treated as fully conforming. The table demonstrates that workmanship drives plant performance long after turnover. Small defects during installation often become chronic sanitation issues, hidden corrosion points, or maintenance bottlenecks later. By 2026, workmanship standards are expected to become more technology-enabled. Contractors are increasingly using laser layout, digital punch lists, weld traceability systems, mobile QA checklists, and cloud-based turnover packages. Sustainability is also influencing workmanship expectations, especially where owners want energy-efficient utility routing, reduced water loss, and durable low-maintenance finishes. The area chart shows the realistic trend shift in the U.S. market: quality is moving from paper-only inspection toward digital validation, traceable workmanship records, and hygienic proof of execution. Sanitary installation requirements deserve their own section because food-safe construction has rules beyond general industrial work. A sanitary system must be easy to clean, resistant to contamination, free of unnecessary dead legs, properly drained, protected from foreign material ingress, and installed in a way that supports routine sanitation, inspection, and maintenance. These requirements vary by product category. Beverage systems often prioritize flow control, carbonation integrity, syrup segregation, and high-speed packaging sanitation. Dairy systems may need strict thermal control, allergen separation, and highly reliable CIP coverage. Protein and prepared foods facilities often demand more aggressive washdown durability, floor resilience, and wastewater coordination. Aseptic and retort projects require even tighter hygienic and validation discipline. Core sanitary installation expectations in the United States usually include: Projects near humid Gulf Coast markets, cold Upper Midwest regions, or high-throughput Southeast co-packing corridors should also consider local operating conditions. Condensation control, insulation detailing, and thermal movement can directly affect sanitary performance. For owners comparing equipment and integration readiness, custom process assets and plant systems can be reviewed through process equipment solutions designed for food and beverage environments where cleanability and utility integration are critical. The explanation is simple: sanitation-friendly installation lowers cleaning time, reduces contamination risk, and improves audit outcomes. It also protects uptime because fewer poorly designed areas need repeated maintenance intervention. Even strong projects encounter deviations. The issue is not whether non-conformances occur, but whether they are identified quickly, contained, analyzed correctly, and closed with evidence. A mature non-conformance management system prevents one small defect from becoming a systemic project failure. A non-conformance may involve wrong material, bad workmanship, damaged equipment, undocumented field changes, failed testing, incomplete labeling, unsafe installation, or any condition that does not meet drawings, specification, code, or owner standard. Once identified, the team should log it, assign responsibility, define containment, evaluate impact, and decide whether the item must be repaired, replaced, reworked, accepted by concession, or redesign-reviewed. High-performing U.S. capital projects use a clear NCR workflow with status visibility for the owner. This is especially important on multi-contractor sites where sanitary mechanical, electrical, controls, insulation, flooring, and building trades all interact. If NCRs are handled informally, the same issue often appears in multiple areas. Useful NCR categories include quality, hygiene, safety, documentation, material, schedule impact, and startup impact. Categorization helps leadership see whether problems stem from procurement, supervision, fabrication, design detail, or field coordination. For plants managing expansions or relocations, prior project lessons are valuable. Real-world execution examples and integrated delivery outcomes can be explored through food and beverage project case studies showing how complex scopes are controlled from planning through startup. Corrective action procedures should go beyond fixing visible defects. They should address root causes so the issue does not return in the same project or in future programs. In food plant construction, that means distinguishing between symptom correction and system correction. For example, if a sanitary spool fails inspection because the wrong gasket material was installed, replacing the gasket is only immediate correction. A true corrective action might include supplier review, revised receiving checks, updated stores labeling, and retraining for installers. If repeated floor ponding appears in a packaging hall, the fix may require not just local topping but also drainage survey review, specification clarification, and updated slab inspection hold points. An effective corrective action process usually includes: As the 2026 market evolves, corrective action will increasingly be tied to predictive analytics, supplier performance dashboards, and more standardized lessons-learned libraries. Sustainability factors will also matter more. For instance, owners will expect corrective actions to reduce water loss, energy waste, and avoidable material scrap instead of simply patching defects and moving on. This table shows why corrective action should be systematic. The real value is not the repair itself, but the prevention of recurrence and the stronger confidence it creates for owners, operators, and auditors. Final acceptance criteria define when a project is truly ready for owner turnover. In the United States, this should never depend only on substantial completion or contractor opinion. Acceptance should rely on documented proof that the plant, system, or line meets safety, code, sanitary, performance, training, and documentation requirements. For a food or beverage facility, final acceptance commonly includes: Owners should also define commercial acceptance thresholds. A line that runs for ten minutes is not necessarily accepted if the production goal requires stable eight-hour operation at nameplate rate with acceptable changeover, waste, utility usage, and cleaning performance. For that reason, performance acceptance often includes throughput, yield, temperature control, pressure stability, utility consumption, alarm response, recipe execution, and CIP cycle effectiveness. These criteria should be agreed before installation starts, not debated during startup. The explanation here is critical: final acceptance is the point where project risk transfers into operations. That transfer should be supported by evidence, not optimism. This comparison chart reflects a common buying insight in the U.S. market: suppliers that integrate engineering, field execution, documentation, and startup oversight generally outperform fragmented delivery models on quality closeout. When buying services, owners should ask direct questions about sanitary field supervision, traceability methods, commissioning leadership, documentation standards, and how disputes between design and installation are resolved. A lower bid often becomes more expensive if the provider cannot control quality across disciplines. Disruptive Process Solutions supports food and beverage manufacturers across the United States and Canada with a practical, profit-minded approach to capital execution. Rather than operating as a narrow trade contractor, the company is structured to help manufacturers make better decisions from concept through commissioning, particularly on projects where quality assurance, speed, and operational outcomes must all align. From a technological capabilities standpoint, DPS works across structural, mechanical, plumbing, electrical, process, and controls disciplines. The team supports processing systems that include fermentation, distillation, pasteurization, retort, aseptic processing, carbonation, blending, filtration, water treatment, dairy systems, protein processing lines, and utility infrastructure such as CIP, boilers, compressed air, cooling towers, refrigeration, wastewater, and HVAC. PLC programming, automation, and SCADA integration are also key strengths, which matters when final acceptance depends on both physical installation quality and stable control logic. From a manufacturing capabilities standpoint, DPS also brings proprietary equipment expertise to projects. The company designs and manufactures selected process assets such as tanks, CIP systems, marination tumblers, and cooking vessels, allowing tighter alignment between custom equipment requirements and field installation quality. That manufacturing perspective helps owners reduce mismatch between shop fabrication, sanitary design intent, and site execution. From a service capabilities standpoint, DPS delivers process engineering and design, capital planning, owner’s representation, project and program management, general contracting or GC-equivalent coordination, equipment supply, installation, and full system integration. Its Design Build Manage model is especially relevant for clients that want fewer handoff gaps and stronger accountability from planning to turnover. More detail about the company’s background and project philosophy is available on the about our team page. This integrated approach is useful for manufacturers in major U.S. processing regions such as North Carolina, Texas, California, the Midwest dairy belt, and the Southeast beverage corridor, where project speed and sanitation quality often need to move together without sacrificing startup readiness. The most important document is usually the project quality plan because it defines standards, responsibilities, inspection points, test requirements, documentation formats, and acceptance rules. Without it, teams inspect inconsistently and owners struggle to enforce quality expectations. Food plant QA places much greater emphasis on sanitary design, cleanability, corrosion resistance, material traceability, washdown durability, allergen segregation, and process performance. General industrial quality controls are not enough on their own. It should begin as soon as procurement and receiving start. Many costly issues appear before installation, such as wrong metallurgy, missing documentation, damaged components, or submittal mismatches. Projects commonly align with FDA expectations, USDA requirements where applicable, local building and electrical codes, fire protection rules, and customer-driven standards such as SQF and BRC. Owner specifications often add another layer of acceptance criteria. Enough testing means proving the installed system is safe, sanitary, functional, documented, and able to meet agreed operating performance. That usually includes pre-functional checks, functional testing, startup runs, and operator verification. Ask how they handle sanitary inspections, weld traceability, receiving controls, NCR management, turnover documentation, startup support, and multi-discipline coordination. Also ask who is accountable when a drawing detail conflicts with field reality. Not always. Local suppliers may bring faster site access and regional code familiarity, but national or integrated partners may provide stronger QA systems, broader sanitary expertise, and better documentation discipline. The best choice depends on project complexity. The biggest trends are digital QA records, stronger supply chain traceability, greater automation validation, sustainability-linked corrective actions, more formal hygienic design review, and tighter owner demand for first-pass startup success. A reliable quality assurance framework protects more than compliance. It protects uptime, labor efficiency, product safety, expansion flexibility, and the financial return of the entire project. In the United States, where food and beverage manufacturers face rising throughput expectations, workforce pressure, and stricter customer audits, disciplined inspection and testing protocols are no longer a nice extra. They are a core capital strategy. -
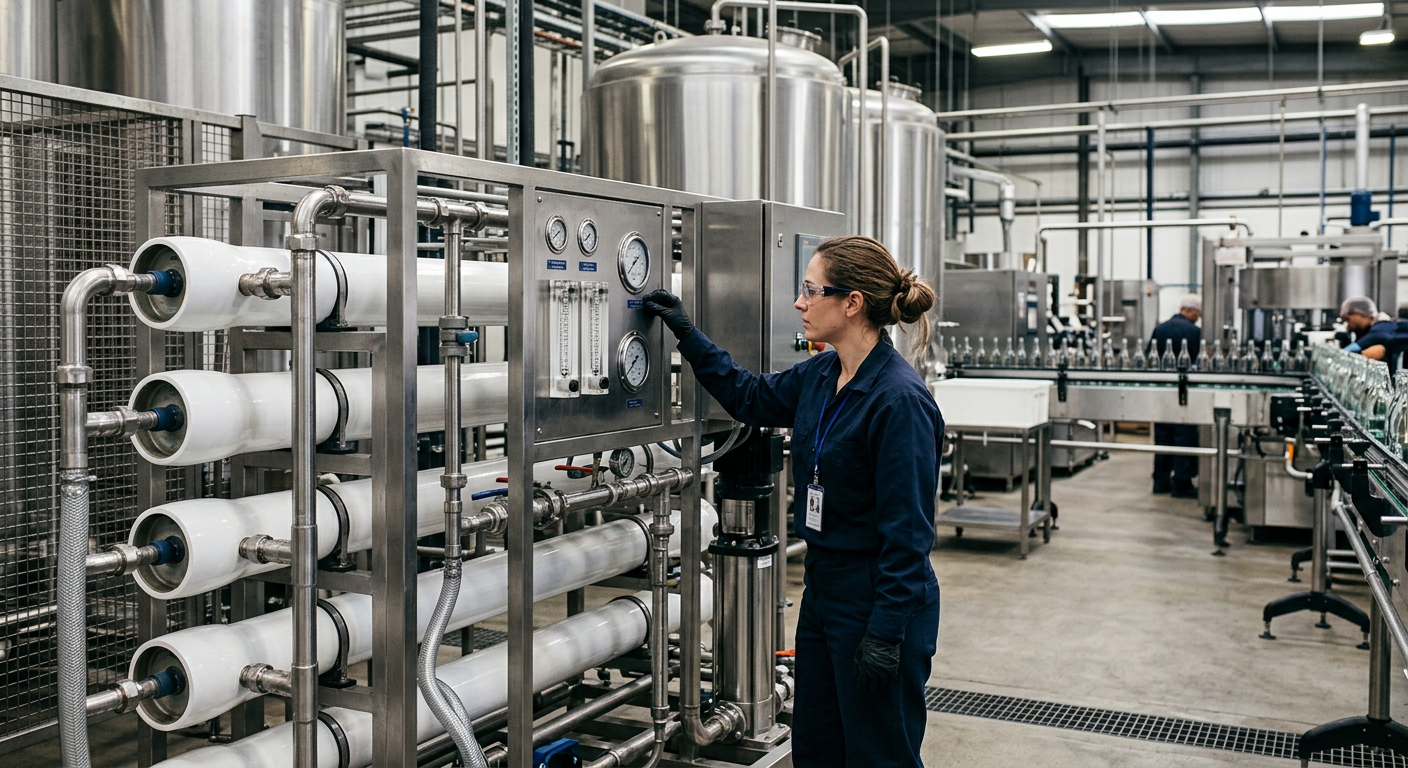
Food Facility Construction Management
Food facility construction management is the specialized planning, coordination, and control of capital projects inside food and beverage plants. In the United States, it goes far beyond ordinary commercial construction because the work must protect product integrity, maintain sanitation, support FDA and USDA expectations, and often proceed without shutting down production. Whether a company is expanding a dairy line in Wisconsin, upgrading a protein plant in Arkansas, adding aseptic filling in California, or building a co-packing facility near Charlotte, the construction manager aligns engineering, field trades, budget, schedule, startup, and risk controls so the investment delivers profitable output rather than expensive disruption. For manufacturers, this discipline matters most when projects involve live operations, sensitive utilities, hygienic process equipment, cold storage, wastewater upgrades, packaging rooms, or high-speed filling and cooking systems. The best construction managers do not simply track subcontractors. They connect business goals with technical execution: throughput, utility load, labor efficiency, sanitation design, zoning, permitting, line integration, commissioning, and future scalability. That is why owners across the United States increasingly look for partners with both plant-floor knowledge and capital project discipline. Companies such as Disruptive Process Solutions have built their reputation on that intersection. Rather than treating a plant expansion as a generic build, they approach it as a manufacturing investment that must support profitability, speed to market, and long-term operational performance. This perspective is especially valuable in major production corridors such as Chicago, Dallas-Fort Worth, Los Angeles, Atlanta, the Research Triangle, the Pacific Northwest, and port-linked markets like Houston, Savannah, Long Beach, and New Jersey, where labor, logistics, utilities, and permitting pressures can change project strategy quickly. Food facility construction management is the end-to-end oversight of construction and installation work for food and beverage plants. It includes planning, bidding, scheduling, subcontractor control, cost tracking, safety management, sanitary risk mitigation, inspections, startup coordination, and closeout. In active facilities, it also manages dust containment, negative air, personnel separation, washdown compatibility, allergen control, shutdown windows, and phased turnover to operations. In practice, the process works like this: the owner defines production and business goals; engineers translate those goals into layouts, utilities, and equipment needs; the construction manager organizes bid packages and field sequencing; qualified trades execute the work under strict quality and food safety controls; and the team validates systems through startup, commissioning, punch list completion, and operator handoff. The result should be a facility or line that meets capacity targets, code requirements, and food safety expectations without unnecessary cost growth. The table above shows why this niche is different from standard industrial building work. In food manufacturing, every decision about layout, materials, drainage, airflow, and sequence can influence product quality, labor productivity, and inspection readiness. Food facility construction management is a structured delivery method that guides a project from early concept through turnover. The construction manager serves as the operating hub between the owner, design team, equipment suppliers, inspectors, and trade partners. Unlike a simple site superintendent role, this function blends preconstruction strategy with field execution and operational planning. The process usually begins in preconstruction. At this stage, the team establishes the scope, budget ranges, utility demand, sanitary zoning, equipment lead times, shutdown assumptions, and construction constraints. For example, a beverage producer near Sacramento might need to add a syrup room, compressors, cooling towers, and packaging support without interrupting summer production. The construction manager helps break the project into bid packages, align procurement with fabrication schedules, and identify critical utility tie-ins long before tools arrive on-site. During design coordination, the construction manager reviews constructability. This includes slab penetrations, process piping routes, trenching, roof curbs, washdown-rated electrical installation, maintenance clearances, hygienic wall transitions, and operator access. In food and beverage work, design intent must be buildable, cleanable, and serviceable. A layout that looks efficient on paper may create sanitation dead zones or block forklift circulation in reality. Once field work begins, the construction manager controls schedule logic, daily sequencing, quality checks, safety, permits, and documentation. They coordinate general trades and specialty scopes such as process piping, controls, refrigeration, sanitary stainless fabrication, clean utilities, wastewater, and equipment rigging. In many United States projects, that also means aligning local code requirements with owner standards and third-party food safety expectations such as SQF or BRC. Finally, the process ends with testing, startup, commissioning, and turnover. The most successful managers plan this phase early. They organize pressure tests, loop checks, utility balancing, equipment verification, spare parts turnover, training documentation, and closeout records. This prevents a common industry problem: a project that is mechanically complete but not operationally ready. For owners seeking integrated support, a firm with combined engineering, build, and management capabilities can reduce handoff friction. DPS, for example, applies a design-build-manage approach that connects process intent, field execution, and operational performance rather than leaving the owner to mediate between disconnected parties. More detail on these integrated offerings is available through their food and beverage project services. The construction manager’s role can be summarized in three words: oversight, coordination, and quality. But inside a food facility, each of those responsibilities is unusually technical. Oversight means protecting the owner’s business case. The construction manager monitors whether the project remains aligned with throughput goals, startup dates, budget assumptions, and risk controls. If an owner expects a 20 percent output increase from a line extension, the manager should understand whether bottlenecks may actually sit in controls logic, CIP capacity, compressed air, packaging accumulation, or changeover time. Strong managers ask those questions early because they know capital spending must support profitability, not just physical completion. Coordination is the daily discipline that keeps all moving parts aligned. Process equipment fabricators, electricians, controls programmers, plumbers, stainless welders, concrete crews, HVAC contractors, and sanitation stakeholders all operate on different timelines. If a floor drain location shifts after slab work, or if a filler arrives late through the Port of Long Beach, the schedule impact can spread through multiple trades. The construction manager resolves these conflicts by updating look-ahead plans, sequencing tasks around access constraints, and keeping communication fast and documented. Quality control in food plants has two dimensions: construction quality and sanitary suitability. Construction quality covers tolerance, finish, testing, code compliance, and functional installation. Sanitary suitability covers washdown durability, cleanable joints, proper slope, segregation of dirty and clean areas, and the right selection of materials for wet, cold, chemical, or high-humidity zones. A project can pass general building inspection and still create sanitation headaches if details are poorly executed. The table above illustrates that the construction manager’s role is operational, not administrative. In projects involving boilers, glycol systems, process water, CIP skids, carbonation systems, retort, aseptic rooms, protein handling lines, or dairy processing, field decisions directly affect long-term maintenance and product quality. This is also where technology capabilities matter. A capable partner should understand structural, mechanical, plumbing, electrical, process, and controls integration rather than viewing the building shell and the process line as separate worlds. That multidisciplinary view is one reason many manufacturers seek partners with process engineering depth and automation fluency, especially when SCADA, recipe control, or PLC modifications can unlock more capacity than a larger footprint alone. In the United States, food manufacturers commonly compare two management structures: CM at Risk and Agency CM. The right choice depends on internal staffing, speed requirements, risk tolerance, and how much pricing certainty the owner wants during execution. CM at Risk means the construction manager typically provides preconstruction support and later acts in a role closer to the builder, often with a guaranteed maximum price or a similar cost commitment structure. This model can be attractive when schedule compression matters, scope is sufficiently defined, and the owner wants tighter accountability for field execution. It is often used for greenfield beverage projects, major utility expansions, or full facility conversions where rapid coordination between design and construction is essential. Agency CM means the manager advises and represents the owner but does not hold the same construction cost risk as the builder. This can work well when the owner wants independent oversight, intends to contract directly with trades, or has a sophisticated internal capital team. It is also useful when scope remains fluid and the owner values transparent decision support over early price locking. For food facility projects, the decision should not be based on contract jargon alone. Owners should compare how each model handles hygienic scope changes, utility tie-ins, live-plant risk, vendor coordination, and startup responsibility. In a highly active plant in New Jersey or Illinois, the practical question is not only “who owns cost overrun risk?” but also “who makes fast, technically sound decisions when production protection is on the line?” The table shows there is no universal winner. A processor adding new retort capacity in the Carolinas may prefer integrated delivery and faster accountability. A national brand managing a portfolio of plant upgrades may prefer an agency model supported by an owner’s representative. In either structure, success depends on whether the manager understands food manufacturing realities, not just construction process. Many of the hardest projects in this sector happen inside operating plants. This is where food facility construction management becomes a specialized risk-control discipline. Containment is the first priority. Temporary walls, sealed penetrations, tacky mats, debris routing plans, dedicated contractor access, sanitation checkpoints, and controlled material staging reduce the chance that dust or fragments enter production. In dry-food environments, airborne particulate can be especially disruptive. In wet environments, traffic and water migration can create microbial risk. The construction manager must tailor containment to the product and the zone. Negative air is often used when demolition, cutting, trenching, or overhead work occurs near active operations. By maintaining pressure relationships, the team can direct airborne contaminants away from production. This approach is common during renovations in bakeries, snack plants, dairy facilities, and beverage packaging halls. However, it must be coordinated with existing HVAC balance and sanitary zoning so that temporary controls do not unintentionally compromise adjacent spaces. Phasing is the strategy that makes live-plant work possible. Instead of one disruptive shutdown, the project is divided into manageable stages: off-shift prep, weekend tie-ins, area isolation, temporary utilities, equipment relocation, partial turnover, and final startup. In major logistics hubs such as Dallas, Chicago, or Atlanta, where customer service levels are tight, phasing can be the difference between a successful upgrade and lost shelf space. Experienced managers map phasing against production calendars, seasonal demand, sanitation schedules, labor availability, and material delivery windows. For example, a cold brew line installation in California may avoid peak summer output months, while a protein facility in the Midwest may tie work to planned maintenance outages. The phasing plan should be visual, approved by operations, and tied to contingency actions if work slips. The line chart above reflects a realistic growth pattern in food and beverage capital activity across the United States, driven by reshoring, automation, cold-chain expansion, packaging modernization, and demand for flexible manufacturing. It also underscores why more brownfield work is happening in active facilities rather than only in new greenfield sites. Subcontractor strategy can make or break a food plant project. A low bid is rarely the best value if the trade partner lacks hygienic installation experience, cannot work within a live production environment, or fails to document quality properly. Selection should begin with prequalification. Owners and construction managers should examine food and beverage references, safety performance, staffing depth, schedule reliability, stainless and washdown experience, cleanroom or sanitary area familiarity, and ability to work nights or weekends when needed. Local knowledge matters too. A mechanical contractor familiar with Phoenix utility permitting may not be the best choice for a sanitary retrofit in upstate New York unless the manager can support that transition. Management after award is equally important. Clear scopes of work, submittal schedules, access rules, contamination controls, permit requirements, and turnover expectations should be defined before mobilization. In food plants, ambiguity is expensive. If process piping insulation, hygienic supports, floor repairs, or drain tie-ins are not clearly assigned, gaps appear fast. A strong national network of vetted partners is a competitive advantage. Companies that manage projects across all 50 states often succeed because they combine local labor resources with centralized technical oversight. This is particularly useful when owners operate multiple sites and want repeatable quality. DPS supports this model by managing local trades while aligning them with broader engineering and execution standards, a practical approach for clients scaling programs across North America. The table above highlights why subcontractor management is both a technical and operational function. Reliable local suppliers can be excellent assets, but only when their work is tied to strong oversight, schedule logic, and food-specific quality expectations. Manufacturing capabilities also influence subcontractor strategy. When a project includes custom tanks, CIP skids, cooking vessels, or marination equipment, coordination between field trades and equipment fabrication becomes critical. An integrated provider that understands both equipment and installation can reduce interface risk, especially where process connections, structural loading, utility demand, and automation all intersect. For owners evaluating this kind of fit, DPS also shares examples through its equipment capabilities page. Cost and schedule control in food facility construction are inseparable. In many projects, the most serious cost risk is not material inflation alone but lost production, overtime escalation, utility outage extensions, or startup delay that pushes a launch into the wrong selling season. Effective cost control starts with realistic estimating. Budgets should include sanitary finishes, temporary barriers, off-shift labor, shutdown premiums, testing, startup support, and documentation. Too many early budgets underestimate the operational burden of working in active plants. A cheap estimate that ignores containment and phased access is not accurate; it is incomplete. Schedule management should be built on critical path logic and short-interval planning. Procurement of long-lead items such as boilers, compressors, switchgear, stainless tanks, fillers, retort vessels, refrigeration equipment, and control panels must be aligned with site readiness. If the equipment arrives before the pad, utilities, and access are ready, storage and damage risk increase. If it arrives too late, the entire turnover date moves. Look-ahead meetings, milestone dashboards, and daily field reports are basic tools, but in food plants they should also track sanitation impacts, access constraints, testing hold points, and utility outage approvals. For example, a dairy project in Minnesota may need a narrow overnight tie-in window between CIP cycles, while a beverage project in Florida may face weather-sensitive roofing and condenser installation milestones during hurricane season. The bar chart illustrates relative project demand across key U.S. food and beverage sectors. Beverage, protein, and cold-chain related work remain especially active, while aseptic and dairy continue to attract strategic investment because of shelf-life, product diversification, and margin opportunities. The explanation behind this table is simple: the most profitable projects are usually the most disciplined, not the ones with the lowest initial estimate. Buying advice for U.S. manufacturers is to choose a construction management partner that understands capital efficiency, not just physical execution. Ask how they control change, how they protect production, how they validate utility capacity, and how they define operational readiness. Food safety compliance during construction is not a side topic. It is a central project requirement. Every renovation or expansion inside an active facility must be evaluated for contamination risk, personnel movement, allergen separation, drainage impacts, water intrusion, and sanitation restoration. Construction managers should work with plant quality teams to create a food safety construction plan. This usually includes zone mapping, traffic routes, temporary barriers, negative air strategy, tool control, debris removal timing, cleaning frequency, contractor hygiene rules, and pre-start inspections before any area returns to production. In USDA-regulated environments, documentation and coordination may be even tighter, especially where exposed product is nearby. Material selection matters as well. Surfaces should suit the sanitation regime, humidity level, temperature swing, and chemical exposure of the area. Improper panel systems, sealants, coatings, or floor transitions can become microbial harborage points or maintenance headaches. The construction manager should ensure that the design intent for cleanability survives through procurement and installation. This is where service capabilities matter most. An effective project partner should be comfortable with owner’s representation, project management, general contracting functions, installation oversight, commissioning support, and compliance-sensitive execution. Food safety during construction is strongest when these services are coordinated rather than fragmented among unrelated parties. The area chart shows the ongoing shift toward phased upgrades in existing U.S. plants. This trend is expected to continue into 2026 as manufacturers expand within existing footprints, modernize utilities, automate lines, and respond to labor and logistics pressures without waiting for entirely new campuses. The practical meaning of this table is that food safety compliance must be managed with the same rigor as schedule and cost. The best firms integrate quality and operations into the construction workflow instead of treating them as late-stage reviewers. Technology has become a major differentiator in food facility construction management. BIM and VDC tools help teams visualize congestion, detect clashes, validate maintenance access, and align process equipment with building systems before fabrication and field installation. This is especially valuable in retrofit work where ceiling space is crowded with existing utilities, refrigeration piping, cable tray, HVAC, and sanitary process lines. Project management software supports RFIs, submittals, punch lists, budget tracking, meeting logs, inspection records, and closeout. When a project spans multiple sites or states, digital tools improve transparency for owners and speed decision-making. Dashboards can show procurement risk, open quality items, pending change orders, and milestone confidence in real time. For food and beverage projects, the most useful digital workflows connect design data to field execution. Examples include 3D utility coordination for CIP and process piping, virtual layout reviews for operator access, digital issue tracking for startup, and cloud-based as-built documentation for maintenance teams. Technology should reduce surprises, not simply create more reports. There is also a growing role for controls and operational data in project planning. A smart construction management team will look beyond the walls and ask how automation, SCADA visibility, and PLC programming affect capacity. That business-minded mindset is increasingly important as manufacturers seek better return on capital. Sometimes the right answer is a new line; other times it is better integration of existing assets. Manufacturers reviewing real execution examples can explore selected project case studies to see how engineering and field management combine in practice. The comparison chart suggests why integrated delivery models often perform well in food and beverage environments: they tend to reduce handoff delays, improve technical coordination, and strengthen accountability across engineering, construction, and startup. That advantage becomes more important as projects become more automated and more compliance-sensitive. Looking toward 2026, three trends are likely to shape this field in the United States. First, more projects will use digital coordination earlier, especially for brownfield utility and sanitary routing. Second, policy and compliance pressure around worker safety, energy efficiency, water use, refrigerants, and traceability will influence project design and construction methods. Third, sustainability will move from branding language to practical capital planning, with more interest in heat recovery, water reuse, efficient CIP, smart controls, and utility right-sizing. Construction managers who understand these shifts will help owners avoid stranded decisions and build facilities that stay competitive longer. What types of facilities use food facility construction management?Dairy plants, protein processing sites, breweries, distilleries, beverage co-packers, sauce and dressing plants, prepared foods operations, cold storage sites, aseptic facilities, and co-manufacturing operations all use it. When should an owner bring in a construction manager?Ideally during concept or preconstruction. Early involvement improves estimating, phasing, procurement planning, utility review, and constructability before expensive design assumptions become fixed. Is construction management only for large greenfield plants?No. It is often even more valuable in brownfield projects, where live production, utility tie-ins, shutdown planning, and contamination control make the work more complex than a new shell build. How do owners choose between local suppliers and national partners?Use both where appropriate. Local trades can provide labor availability and jurisdiction familiarity, while national oversight or integrated specialists can deliver repeatable food-grade quality, process coordination, and program consistency across multiple sites. What product types most often require specialized management?High-acid beverages, aseptic products, dairy, meat and poultry, seafood, plant-based proteins, fermented beverages, sauces, shelf-stable retort foods, and washdown-intensive packaging environments all benefit from specialized oversight. What should owners ask during contractor interviews?Ask about food plant experience, active facility protocols, subcontractor vetting, shutdown planning, startup support, utility integration, schedule control, documentation practices, and examples where the team improved the business outcome rather than merely built the scope. How does an integrated partner add value?An integrated partner can combine process engineering, equipment understanding, field coordination, and commissioning support. That reduces gaps between design, procurement, installation, and operational handoff. What makes DPS relevant for U.S. food and beverage manufacturers?DPS brings engineering, construction management, owner-focused oversight, equipment integration, and practical manufacturing knowledge together. Its experience spans food and beverage applications across North America, with capabilities supporting process systems, utilities, controls, installation, and project execution in a way designed to improve long-term client profitability. For United States manufacturers evaluating food facility construction management, the central buying advice is straightforward: choose a partner that understands manufacturing performance as deeply as construction sequence. The best projects are not just completed on time; they start up cleanly, scale efficiently, satisfy compliance expectations, and support profit from day one.


