-
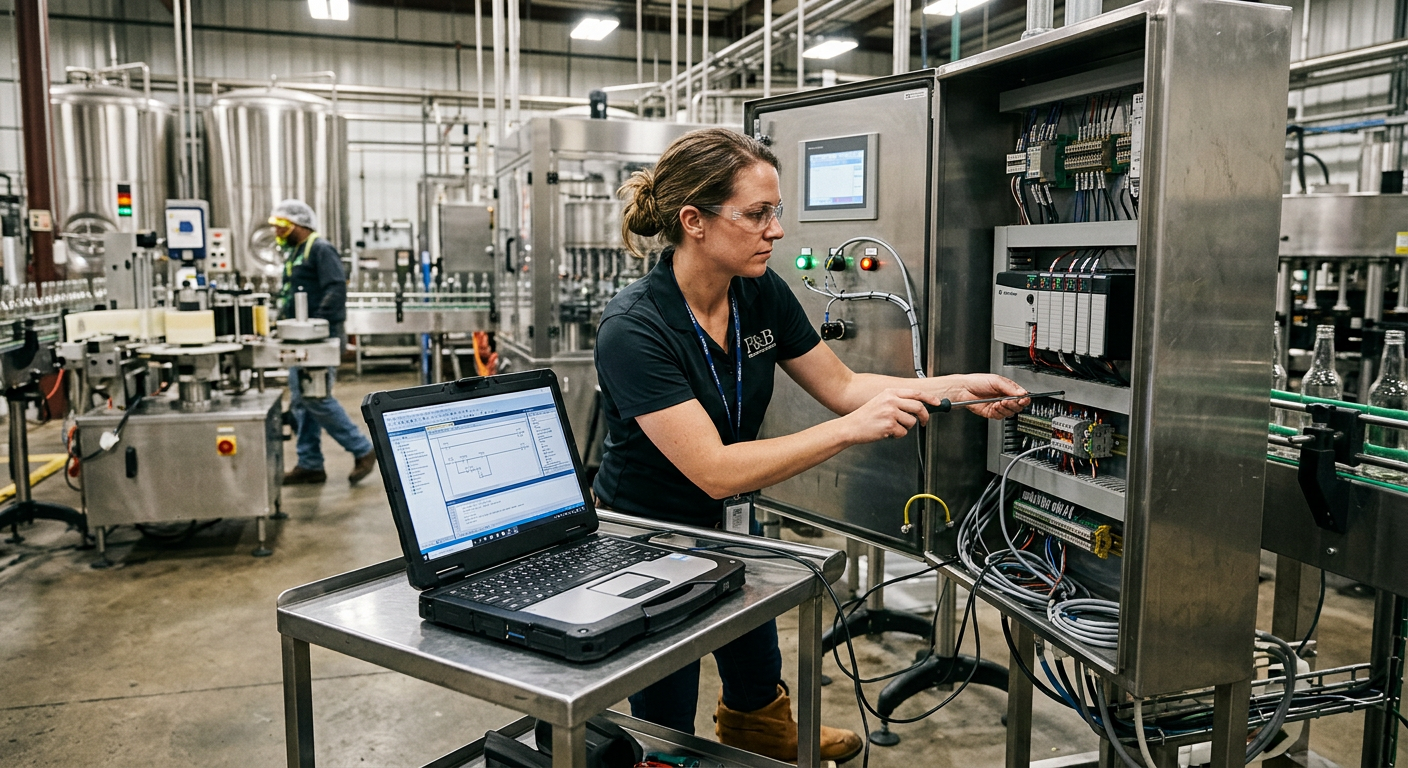
Food Grade Process Design Services
Food grade process design is the discipline of engineering equipment, piping, utilities, surfaces, and documentation so a food or beverage plant can produce safe products, clean effectively, satisfy regulators, and operate profitably. In the United States, that means aligning design decisions with FDA food contact requirements, FSMA preventive controls, sanitary construction principles, and practical operating realities such as CIP performance, allergen changeovers, wastewater loads, and maintenance access. For processors in markets such as Chicago, Dallas, Los Angeles, Charlotte, Atlanta, Fresno, and the I-95 corridor, good food grade design is not just about passing an inspection. It is about reducing contamination risk, shortening downtime, protecting brand equity, and supporting long-term capacity growth. Manufacturers expanding near the Port of Los Angeles, the Port of Savannah, Houston, Newark, or inland distribution hubs such as Kansas City and Memphis often face the same question: what should be specified at the design stage so the plant is cleanable, auditable, and scalable from day one? The answer includes material selection, surface finish, gasket and seal compatibility, hygienic drainage, dead-leg control, utility segregation, documentation, and validation of how the system will actually be operated. This is where an engineering partner with process, automation, installation, and compliance experience becomes essential. Disruptive Process Solutions supports food and beverage manufacturers across the United States and Canada with a design-build-manage model focused on profitable execution, not just drawings. The company works across brewing, dairy, protein, prepared foods, sauces, aseptic systems, spirits, RTD beverages, and co-packing environments where compliance and throughput must coexist. Food grade process design covers the sanitary engineering choices that allow food and beverage systems to be safely manufactured, cleaned, inspected, and documented. In the United States, it typically includes selecting compliant food contact materials, choosing the correct stainless steel grade, specifying cleanable surface finishes, preventing product harborage points, selecting food safe seals and lubricants, designing CIP and COP strategies, and building records that support FDA, USDA, SQF, BRC, and customer audits. A strong design also accounts for zoning, allergen separation, temperature control, drainage, automation, and maintenance access so that the plant is both compliant and commercially efficient. For most processors, the best approach is to evaluate food grade design across three layers: If those layers are engineered together, the result is a facility that is easier to clean, easier to validate, and more likely to generate repeatable margins. The table above shows why food grade process design should be approached as a system rather than a purchasing checklist. A processor can buy premium tanks and still fail if drains, gaskets, or CIP velocities are wrong. At its core, food grade process design covers everything that touches product directly and everything that can indirectly affect product safety. That includes tanks, piping, pumps, valves, heat exchangers, fillers, blenders, conveyors, utility interfaces, compressed air, process water, drains, and operator contact zones. For processors in the United States, the design basis should also reflect whether the line is under FDA or USDA oversight and whether the site must satisfy SQF, BRCGS, retailer standards, or customer-specific hygienic requirements. Materials are one of the first decisions. A design engineer must determine where 304 stainless steel is acceptable, where 316 is necessary, where polymers are suitable, and where mixed materials may create corrosion or cleanability issues. Surfaces must then be specified with an appropriate finish so residues are removed effectively during cleaning. Compliance documentation ties those decisions together by showing what materials were installed, where they are used, and whether they are appropriate for product contact. In many U.S. projects, especially retrofit work in older manufacturing regions such as Ohio, Wisconsin, Pennsylvania, and New Jersey, food grade design also means correcting inherited sanitary problems: threaded fittings in product zones, slope failures, hard-to-reach valve clusters, hollow members in wet areas, poorly designed hose stations, and inadequate separation between raw and ready-to-eat flows. DPS approaches these issues from a full system perspective. Its technological capabilities include process engineering, structural, mechanical, plumbing, electrical, and controls integration, including PLC programming and SCADA support. That matters because sanitary performance depends on more than mechanical layout. It also depends on recipe logic, sequencing, interlocks, temperature recording, and CIP proof points. Processors evaluating plant upgrades can also review engineering and project services to understand how food grade design fits within broader capital planning, integration, and commissioning decisions. In U.S. food and beverage plants, 304 stainless steel is common because it balances cost, corrosion resistance, and availability. It is often suitable for dry foods, many standard beverage systems, water-like products, and general process framing in non-aggressive environments. However, 316 stainless steel is often preferred when chloride exposure, acidic formulations, salt-heavy products, aggressive CIP chemistry, or repeated caustic and acid cycles increase corrosion risk. For example, a Midwest dairy facility using acidic wash cycles and chloride-bearing water may justify 316 in product-contact piping and vessels. A Gulf Coast seafood processor dealing with saline conditions may also benefit from 316. Distilleries, kombucha plants, sauce processors, and brine-based protein operations often need a more selective material review because product chemistry can vary widely. The decision is not purely about corrosion tables. It should consider cleaning chemistry, water quality, ambient humidity, weld quality, expected service life, and replacement cost. A lower-cost 304 installation can become expensive if pitting develops around welds, under gaskets, or in spray shadow areas. Conversely, over-specifying 316 everywhere can tie up capital unnecessarily. As a buying rule, use 304 where product chemistry and wash conditions are mild, and move to 316 where chloride, acid, salt, or repeated aggressive sanitation increase risk. The final call should be made by a qualified process engineer who also reviews weld maps, fabrication quality, and maintenance strategy. This comparison chart reflects why stainless selection should be based on total lifecycle conditions rather than up-front cost alone. Food grade process design in the United States must be supported by documentation that demonstrates food contact suitability. For FDA-regulated operations, this often includes material certifications, statements of compliance for polymers and elastomers, supplier declarations, traceability records, and equipment documentation showing where each material is used. These records are especially important during equipment qualification, customer approval, or third-party audits. Design teams should maintain a material matrix that links each product-contact component to its material of construction, intended service, and supporting compliance records. This may include tubing, valve seats, pump seals, O-rings, hoses, adhesives, lubricants, and instrumentation interfaces. Documentation should also show that the material is suitable for actual use conditions, including temperature, cleaning chemicals, pressure, and contact duration. For many manufacturers, especially co-packers and multi-SKU facilities near hubs like Chicago, Inland Empire, Nashville, and Philadelphia, the issue is not whether records exist somewhere. The issue is whether they can be retrieved quickly during an audit or customer onboarding process. Good food grade design includes document control from the start. DPS frequently supports compliance-heavy environments involving FDA, USDA, SQF, and BRC expectations, which is particularly useful in sectors such as aseptic processing, dairy, protein, and beverage co-packing where proof of sanitary suitability often affects launch timelines. The key takeaway is that compliance documentation should be engineered into the project closeout package, not chased after startup. Surface finish has a direct effect on cleanability, product release, and biofilm risk. Ra, or roughness average, is commonly used to describe surface texture. Lower Ra values generally indicate a smoother surface, which tends to support easier cleaning and fewer retention sites. In food and beverage applications, the required finish depends on product type, sanitary risk, and cleaning method. Wet dairy, aseptic, and high-viscosity systems often require tighter finish control than dry ingredient transfer or utility-adjacent surfaces. However, finish alone does not guarantee hygiene. A polished surface can still fail if welds are poor, if product pools at low points, or if hardware creates dead spaces. Engineers should therefore specify finish in combination with weld quality, slope, drainability, gasket compression, and CIP coverage. Plants processing yogurt, sauces, nut-based beverages, cream liqueurs, or marinades often see the biggest operational benefit from proper finish control because sticky or protein-rich residues are difficult to remove. In these systems, a smoother finish can shorten wash cycles and reduce manual intervention. In practical terms, many U.S. food and beverage projects perform well with 32 Ra in standard product-contact zones, while higher-risk or harder-to-clean applications justify smoother finishes. The right choice depends on residue behavior, not marketing language. The area chart shows a realistic shift toward smoother contact finishes as U.S. processors pursue stronger cleanability and shorter sanitation windows. Food grade design often fails at the smallest components. Seals, gaskets, valve seats, hose liners, and lubricants are frequent sources of contamination, leakage, chemical incompatibility, and downtime. A gasket that swells in oil, hardens under caustic, or cracks under thermal cycling can turn a well-designed system into a chronic sanitation risk. Selection criteria should include product chemistry, CIP and SIP temperatures, mechanical wear, pressure, compression set, allergen exposure, and cleanability. Common materials may include EPDM, silicone, PTFE, FKM, and other specialty elastomers, but there is no universal best choice. The right material depends on actual service conditions. Lubricants require equal attention. Where incidental food contact is possible, maintenance teams should use appropriate food-grade lubricants and maintain documented control over usage, storage, and change intervals. This is especially important in fillers, conveyors, pumps, homogenizers, and packaging systems. Manufacturing capability also matters here. DPS not only engineers systems but also designs and supplies selected process equipment such as tanks, CIP systems, marination tumblers, and cooking vessels. That vertical involvement can help standardize component selection across equipment packages and reduce mismatches between OEM assumptions and plant sanitation reality. For buyers, the rule is simple: never approve gasket and lubricant selections as an afterthought. They should be reviewed during design, procurement, startup, and preventive maintenance planning. FSMA shifted the U.S. food industry from reaction to prevention. Food grade process design should therefore support hazard analysis, risk-based preventive controls, sanitation control, allergen management, environmental monitoring, and traceability. The design is not the food safety plan itself, but it strongly influences whether preventive controls can work in practice. Examples include providing hygienic zoning between raw and ready-to-eat areas, ensuring drains do not move contamination toward high-care rooms, separating allergen storage and transfer routes, designing validated thermal processes, enabling complete CIP verification, and automating critical parameters such as temperature, flow, Brix, conductivity, and hold time. In co-packing and multi-product operations, especially in large logistics regions such as Dallas-Fort Worth, Southern California, and central Pennsylvania, FSMA-ready design should also account for changeover frequency, line clearance, and label reconciliation. Plants with high SKU counts need process layouts that reduce human error. DPS brings service capability across feasibility studies, owner’s representation, capital planning, project management, installation, and system integration. That broad involvement is important because FSMA-minded design decisions often affect facility layout, utility capacity, controls, and operating procedures at the same time. The bar chart reflects where demand for advanced food grade process design is currently strongest in the U.S. market, with co-packing, RTD, dairy, and protein leading due to audit pressure and changeover complexity. Many sanitary failures do not come from dramatic design errors. They come from small compromises made during value engineering, installation, or startup. One common mistake is specifying good equipment but poor interconnections. Another is assuming a standard OEM skid will fit the plant’s chemistry, cleaning regime, and audit expectations without modification. Other frequent mistakes include inadequate pipe slope, oversized valves that create low-velocity cleaning conditions, poor instrument placement, inaccessible welds, utility lines routed over exposed product zones, wrong gasket materials, and controls that do not log sanitation-critical events. Facilities also often underestimate operator access. If a component cannot be safely inspected or maintained, it becomes a hidden sanitation risk. The most expensive error, however, is treating compliance and profitability as separate goals. A poorly planned expansion can add capital cost while failing to solve the true bottleneck. One reason many U.S. manufacturers engage DPS is that the firm evaluates projects through both operational and financial lenses. Instead of simply expanding hardware, it often examines automation logic, utility limitations, line balance, and asset utilization to avoid unnecessary capital spending. Plants considering a retrofit or expansion can also review recent project examples and case studies to understand how engineering, installation, and operational problem-solving intersect in real facilities. Food grade process design is stronger when claims can be verified. In the United States, third-party review may include sanitary design assessments, weld inspections, material documentation audits, FAT and SAT protocols, calibration checks, passivation records where relevant, and verification that installed conditions match approved drawings. Certification may also be tied to customer requirements, insurance expectations, lender diligence, or retailer-driven quality programs. Processors should distinguish between component certification and system verification. A certified valve or compliant gasket does not mean the system as installed is hygienic. Likewise, a polished tank is not enough if no one verifies spray coverage, conductivity endpoints, temperature hold, and drain-down performance. Third-party verification is especially useful for new builds near major growth markets such as Phoenix, Raleigh, Austin, Sacramento, and Salt Lake City where fast schedules can increase installation risk. Independent review helps catch issues before startup. It can also strengthen buyer confidence when a facility plans to serve major national accounts. For equipment-related scope, manufacturers may explore process equipment solutions when selecting tanks, CIP systems, and custom process assemblies that must align with sanitary and operational requirements. The line chart shows a realistic growth trajectory for the U.S. market as processors invest in sanitation, automation, and compliance-driven upgrades through 2026. What industries need food grade process design most?Dairy, protein, sauces, RTD beverages, alcoholic beverages, aseptic processing, co-packing, nutraceutical liquids, and prepared foods are among the most common. Any facility with product-contact equipment, sanitation obligations, or regulatory scrutiny benefits from proper sanitary design. Is food grade the same as sanitary design?Not exactly. Food grade usually refers to materials and suitability for food contact. Sanitary design is broader and includes geometry, drainability, cleanability, zoning, inspection access, and operational control. When should a processor choose 316 stainless instead of 304?Usually when product chemistry, chloride exposure, acid cleaning, salt content, or corrosion risk is elevated. The choice should be based on lifecycle conditions, not purchase price alone. What Ra finish should be specified?It depends on product and process risk. Many food-contact systems perform well at 32 Ra, while dairy, aseptic, sticky, or harder-to-clean applications may justify 25 Ra or smoother. Do FDA rules approve equipment systems?Typically, compliance is demonstrated through material suitability, intended use, and supporting documentation rather than a simple blanket approval of the complete installed system. System verification is still necessary. Are food grade lubricants required everywhere?No, but where incidental food contact is possible or where quality programs require it, the correct lubricant class and documented control are essential. How does food grade design support FSMA?It supports preventive controls by reducing contamination risks, improving sanitation effectiveness, enabling monitoring of critical parameters, and making verification more reliable. What should be included in a project turnover package?Material records, compliance declarations, as-built P&IDs, manuals, calibration data, surface finish records where applicable, startup documentation, and sanitation-related verification files. Can an older U.S. plant be upgraded to meet current expectations?Yes. Many facilities in legacy manufacturing corridors can be retrofitted successfully through targeted piping redesign, equipment replacement, drain correction, zoning improvements, CIP optimization, and better controls. What trends will matter most in 2026?Expect stronger demand for automation-backed sanitation verification, water and energy optimization, hygienic design for flexible co-packing, more scrutiny on documentation readiness, and sustainability-driven material and utility decisions. Plants will increasingly pair food grade process design with digital monitoring, recipe control, utility metering, and predictive maintenance to reduce both compliance risk and operating cost. By 2026, the strongest U.S. projects will combine food grade materials and sanitary geometry with smarter automation, sustainability metrics, and better audit evidence. That is especially relevant for facilities handling high growth categories such as functional beverages, plant proteins, premium dairy, aseptic products, and regional co-packing programs. For manufacturers planning a new build, expansion, relocation, or retrofit, food grade process design should be treated as a strategic investment rather than a compliance checkbox. The right engineering approach improves cleanability, protects product quality, supports regulatory confidence, and preserves capital efficiency. In an increasingly competitive U.S. market, that combination is what turns sanitary design into a business advantage. -
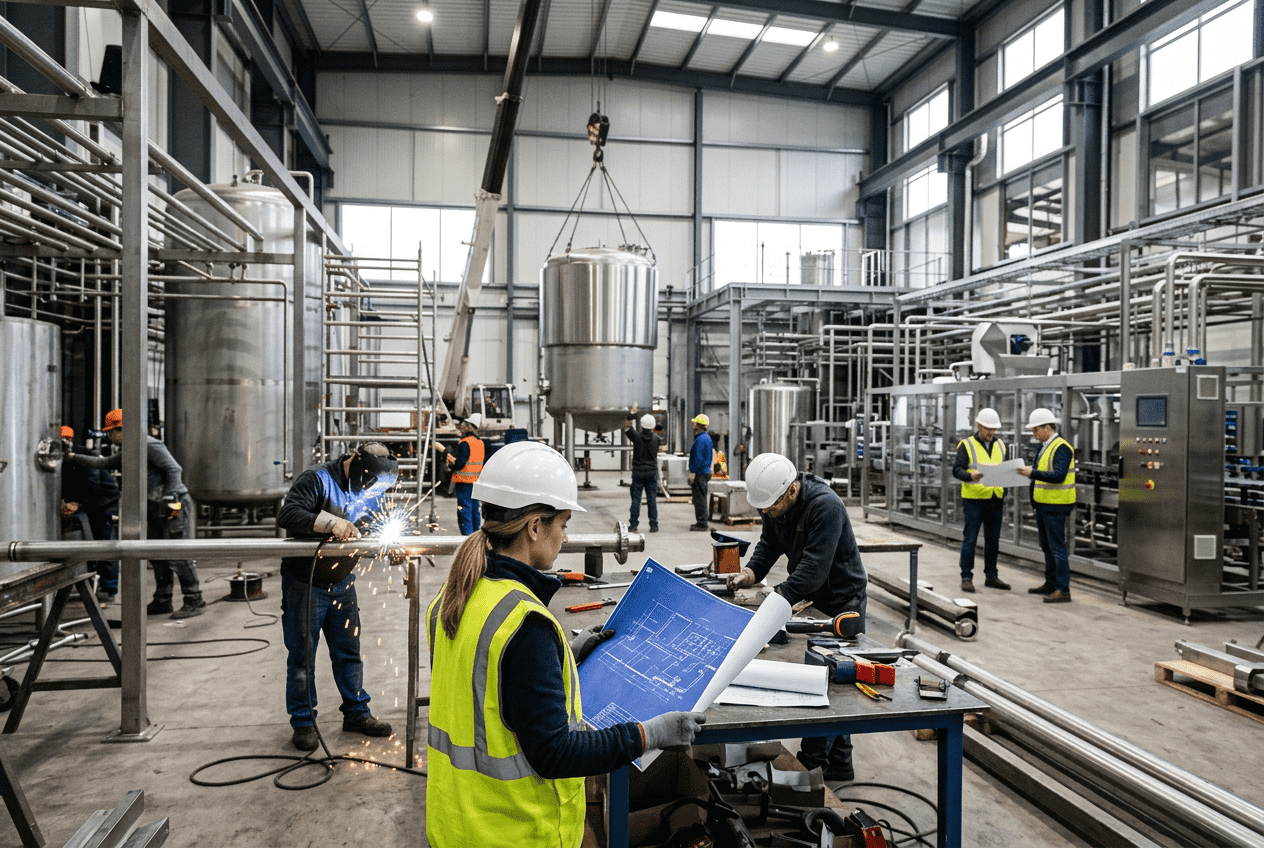
Food Facility Investment Due Diligence: A 10-Point Checklist for Acquirers
Acquiring a food or beverage plant in the United States is not just a real estate decision. It is a combined assessment of processing capability, utility resilience, regulatory exposure, labor stability, and the plant’s ability to generate margin after capital improvements. Buyers looking at facilities in major production corridors such as the Midwest, Texas, California’s Central Valley, the Carolinas, or logistics gateways near Chicago, Dallas, Atlanta, Los Angeles, Savannah, and the Port of Houston need a disciplined diligence framework. Investment due diligence for food facilities is the process of verifying whether a plant can safely, legally, and profitably support production goals after acquisition. In the United States, buyers should examine ten core areas: building and utility condition, processing assets, environmental and regulatory status, operating efficiency, food safety systems, quality certifications, financial performance, automation maturity, workforce risk, and expansion feasibility. A good diligence review does more than identify defects. It shows what to fix first, how much it will cost, and whether the asset can support the buyer’s target throughput, margin, and compliance obligations. For private equity firms, strategic acquirers, family offices, and operators pursuing add-on acquisitions, the most common mistake is focusing on headline EBITDA while underestimating deferred maintenance, utility constraints, wastewater exposure, or packaging line bottlenecks. In food manufacturing, small technical issues can become major valuation issues once they affect USDA, FDA, SQF, or BRC compliance, customer audits, or retail service levels. The table above summarizes why investment due diligence for food facilities must go beyond a basic property inspection. In practice, each row should be tied to a costed risk register and a post-close action plan. Food facility due diligence is a multidisciplinary review performed before acquisition, recapitalization, refinancing, or major expansion. It combines engineering, operations, food safety, finance, and compliance analysis to determine whether an asset can meet commercial expectations. In the United States market, diligence requirements vary by product type. A frozen prepared foods site in Illinois, a dairy beverage plant in Wisconsin, a protein processing facility in Arkansas, a co-packer in New Jersey, and an aseptic beverage operation in California do not face identical risks. Product category changes everything: allergen segregation, thermal process validation, clean-in-place design, cold chain storage, wastewater load, packaging complexity, and regulatory oversight. Buyers should also align diligence with intended applications. If the target will serve national retail, club, foodservice, e-commerce fulfillment, export, or contract manufacturing, the facility must satisfy different customer and logistical demands. Plants shipping through Savannah, Long Beach, Newark, or Houston may need stronger packaging durability, export paperwork discipline, and inventory staging capacity than regional plants serving only local distribution centers. At a minimum, diligence should answer these questions: For many acquirers, the best buying advice is simple: underwrite the asset on normalized future capability, not on seller narratives. A plant that appears underutilized may in fact be constrained by packaging speed, PLC logic, wastewater permits, or labor scheduling rather than by demand. Conversely, a busy plant may be one major boiler failure away from severe disruption. The line chart shows a realistic growth pattern for modernization spending across U.S. food and beverage plants. This matters because buyers increasingly inherit assets that require automation, utility, sustainability, and compliance upgrades immediately after close. Physical infrastructure review is often the foundation of the entire diligence process. Many food plants in the United States were adapted over time rather than designed for current product mix. That means the building may not support sanitary zoning, modern traffic flow, allergen separation, or efficient utility distribution. Start with the envelope and site conditions: roof integrity, wall panels, floor slopes, trench drainage, dock condition, truck circulation, employee entry points, pest control vulnerabilities, and expansion space. Then move into production and utility systems: boilers, air compressors, refrigeration, cooling towers, glycol loops, water treatment, wastewater handling, electrical service, backup power, HVAC, and CIP systems. Asset condition should be documented by age, OEM support status, spare parts availability, maintenance history, downtime records, and cleanability. If a buyer is evaluating a brewery in Colorado, a sauce plant in Georgia, a dairy processor in upstate New York, or a protein line near Kansas City, the same rule applies: utility sufficiency matters as much as line speed. The explanation behind this table is practical: hidden infrastructure weakness is one of the fastest ways to turn a “cheap” acquisition into an expensive turnaround. Buyers should convert every observed issue into timing, cost, and production impact. Product types affect the priority list. Protein processing facilities depend heavily on cold rooms, sanitation systems, and wastewater handling. Beverage sites depend on blending accuracy, carbonation or aseptic integrity, water treatment, and packaging speed. Retort and shelf-stable foods need validated thermal systems and strong container handling. Dairy sites require hygienic design, separation capability, and temperature-sensitive storage. When local suppliers and contractors are part of the operating model, their availability should be reviewed as well. Plants in remote areas of Idaho, Nebraska, or West Texas can face slower OEM response, longer lead times for stainless fabrication, and higher mobilization costs than sites near Charlotte, Chicago, Minneapolis, or Southern California. Environmental and regulatory diligence can materially affect deal structure. In the United States, food plants may fall under FDA, USDA, state agriculture departments, local building authorities, wastewater agencies, air permitting bodies, and fire marshal requirements. The exact mix depends on product category and process design. Review all permits, inspection histories, notices of violation, consent orders, wastewater surcharges, stormwater obligations, hazardous material handling, and ammonia or refrigerant management where applicable. If the facility is near a sensitive watershed or urban wastewater district, discharge costs and future permit limits can sharply affect margins. Facilities near the Port of Los Angeles, the New Jersey Turnpike corridor, South Florida, the Memphis logistics hub, or the Houston ship channel may face different municipal and environmental constraints than rural processing campuses. Local policy matters. So do community relations and odor, truck traffic, or noise complaints. This table matters because environmental and regulatory liabilities are not abstract. They influence working capital needs, indemnity language, integration timing, and customer confidence. A smart buyer will ask not only whether the plant is compliant today, but whether it will remain compliant after product mix changes or throughput increases. Looking toward 2026, diligence teams should pay closer attention to sustainability policy trends, water intensity, energy reporting, refrigerant transition planning, and waste reduction targets demanded by major retailers and brand owners. These may not always be legal requirements at close, but they increasingly shape commercial access and capital allocation. Operational diligence should verify what the plant can truly produce, not what the nameplate suggests. In food manufacturing, bottlenecks often hide in changeovers, sanitation windows, packaging, rework loops, ingredient staging, or utility reset times. A line advertised at 300 units per minute may deliver far less once SKU complexity, labor absenteeism, or allergen cleaning is factored in. Acquirers should map capacity at each step: receiving, storage, prep, blending, cook, thermal treatment, fill, package, palletize, cold storage, and shipping. Compare current OEE, yield loss, downtime causes, scrap rates, and labor productivity against realistic industry benchmarks for that product category. For example, a facility near Indianapolis may have excellent highway access but weak freezer staging. A plant in Fresno may have strong raw material access for produce processing but seasonal throughput volatility. A Dallas-Fort Worth beverage site may have expansion room yet limited municipal water pressure during peak demand periods. The bar chart illustrates a realistic demand mix for sectors drawing strong diligence interest. Ready-to-drink beverages, protein, and aseptic processing continue to attract buyers because they align with premiumization, convenience, and contract manufacturing growth. For buyers, the explanation is straightforward: capacity should be modeled as constrained output under real operating conditions, not theoretical maximum throughput. This is where experienced engineering and operations review creates outsized value. No diligence process is complete without a deep review of food safety systems. HACCP, HARPC, allergen controls, environmental monitoring, supplier approval, traceability, recall readiness, sanitation standard operating procedures, and document discipline should all be tested against actual plant behavior, not just manual language. Quality certifications can influence customer concentration and future sales. SQF, BRCGS, FSSC-related expectations from customers, organic status, kosher, halal, animal welfare commitments, and customer-specific audit requirements all matter depending on the end market. Buyers should sample deviation logs, complaint trends, hold-and-release practices, retained sample management, metal detection or X-ray verification, thermal validation records, and foreign material controls. They should also verify whether line design supports hygienic zoning and whether traffic patterns expose finished goods to raw-side risks. The explanation here is critical for acquirers: food safety maturity is an enterprise value issue. Weak systems can reduce customer retention, delay integration, increase insurance cost, and create severe downside in a branded environment. Financial diligence for food facilities should connect plant economics to operating reality. Review revenue by product, customer, SKU, and channel, but also test cost drivers such as labor, packaging, ingredients, utilities, wastewater, maintenance, freight, and quality-related loss. Many underperforming plants appear profitable until hidden cost structure issues are surfaced. Common examples include underpriced co-packing contracts, obsolete packaging formats, high overtime dependence, excessive chemical usage, poor yield control, or expensive emergency maintenance. Conversely, some plants appear weak only because current ownership has underinvested in controls, line balancing, or utility optimization. Buyers should build a bridge from historical EBITDA to post-close normalized EBITDA with clear assumptions on capex, ramp timing, customer retention, and savings opportunities. This area chart reflects a realistic trend in capital priorities. Across the United States, buyers are shifting spending from reactive maintenance toward automation, data visibility, and energy efficiency because those improvements support both labor resilience and margin expansion. This table should be read as a valuation tool. Each cost line can hide structural issues that directly alter purchase price logic and post-close cash flow. Technology diligence is increasingly central to food facility acquisitions. Automation maturity affects labor dependence, batch consistency, traceability, utility efficiency, and growth potential. Review PLC architecture, HMI standards, SCADA visibility, historian use, recipe management, batch controls, alarm strategy, cybersecurity, remote support, and integration with ERP or MES platforms. Plants that have grown through patchwork changes often contain several generations of controls. That can create spare parts risk, inconsistent data, and difficulty scaling lines or introducing new SKUs. An acquirer should know whether the plant is digitally manageable or whether it will require a phased controls modernization after close. In this area, specialist engineering support can significantly improve diligence quality. Companies like food and beverage engineering partners that understand process systems, utilities, controls, and field execution can distinguish between a minor programming bottleneck and a full equipment replacement need. That difference can save millions in unnecessary capex. Technological capabilities worth evaluating include PLC programming, automation architecture, SCADA systems, batch and recipe control, in-line Brix monitoring, energy management, and integrated utility controls. For beverage operations, automation should support blending accuracy, carbonation control, pasteurization or aseptic processes, and filling synchronization. For food operations, it should support cook controls, batching, retort systems, slicing or forming coordination, and robust CIP validation. The comparison chart helps buyers frame relative readiness across candidate assets or suppliers. A lower score does not always kill a deal, but it should alter integration timing, labor planning, and capex assumptions. By 2026, expected trends include broader use of machine vision, predictive maintenance, digital sanitation verification, utility optimization platforms, and stronger cybersecurity standards for operational technology. Buyers that invest early in scalable automation infrastructure are likely to outperform peers in labor cost control and customer reporting capability. Labor diligence should assess more than current headcount. Review turnover, absenteeism, wage competitiveness, shift coverage, supervisor depth, training maturity, union status where applicable, immigration sensitivity, safety performance, and local talent availability. In U.S. food manufacturing, labor conditions vary sharply by region. Plants near major distribution hubs such as Atlanta, Phoenix, Columbus, and Inland Empire may compete with warehousing and e-commerce employers for the same hourly workforce. Rural protein and dairy facilities may face housing and commuting constraints. Coastal markets may carry higher wages and stricter scheduling expectations. All of this affects throughput and margin. Good buying advice is to evaluate labor by role criticality. A site can survive slower hiring for general packaging labor if automation is strong, but it may struggle if maintenance technicians, sanitation leaders, controls staff, or QA supervisors are thin. Also assess cultural resilience after the deal. If the business relies heavily on a few long-tenured managers, post-close execution risk rises materially. This explanation is important for investors: labor risk is often the difference between a smooth scale-up and a prolonged underperformance period. Workforce diligence should therefore feed directly into the 100-day operating plan. Disruptive Process Solutions supports food and beverage manufacturers across the United States and Canada with engineering-led capital project execution. The company’s role in acquisition and expansion settings is especially relevant when buyers need a practical view of what a plant can become after close, not just what it is today. On the technology side, DPS brings capabilities in process, mechanical, plumbing, structural, electrical, and controls engineering, including PLC programming, automation integration, SCADA, recipe systems, and utility coordination. That makes it useful for identifying whether a bottleneck is caused by equipment, logic, utilities, or layout. Buyers exploring modernization paths can learn more about these capabilities through the company’s service approach. On the manufacturing side, DPS works across both beverage and food applications. Beverage experience includes brewing, spirits, wine, kombucha, ready-to-drink products, carbonated and non-carbonated beverages, juices, dairy-based beverages, and aseptic systems. Food capabilities extend across proteins, prepared foods, sauces, dairy processing, retort and shelf-stable applications, and plant-based products. The firm also supports equipment solutions such as tanks, CIP systems, tumblers, and cooking vessels, which can be explored through its process equipment offering. On the service side, DPS operates through an end-to-end model covering capital planning, feasibility, owner’s representation, project management, general contracting where licensed, installation, integration, and commissioning. That combination is particularly useful for acquirers that need a realistic post-close capex roadmap, supplier coordination, and execution accountability. Buyers wanting a broader picture of experience and leadership can review the company background, while those interested in practical outcomes can see selected project examples and case results. For diligence-driven investors, the value is not just technical depth. It is the ability to connect engineering decisions to profitability, throughput, and timing. That is especially important in the United States market, where local permitting, contractor availability, utility constraints, and customer expectations vary widely by region and product segment. What is the first step in food facility acquisition diligence?Start with a combined operational and engineering screening. Confirm product fit, customer fit, utility sufficiency, and obvious compliance risks before spending heavily on detailed modeling. How long does due diligence for a U.S. food plant usually take?A focused review can take two to six weeks, depending on data quality, site complexity, and whether environmental and technical specialists need additional testing. Which industries need the deepest diligence?High-risk categories include protein, dairy, aseptic beverages, retort foods, allergen-heavy prepared foods, and co-packing operations with many SKUs or customer audit requirements. What product types most often hide capital risk?Facilities handling thermal processing, refrigeration-intensive products, high-acid filling, clean-label formulations, or multi-allergen production often carry higher hidden capex and compliance complexity. How important are local suppliers in the diligence process?Very important. Availability of electricians, stainless fabricators, refrigeration contractors, controls integrators, and wastewater support can affect both deal timing and integration cost, especially outside major metro areas. Should buyers prioritize expansion potential or current profitability?They should underwrite both. A profitable plant with no utility or layout headroom may underperform after growth, while an average current performer with low-cost expansion potential can become highly valuable. What are the biggest mistakes acquirers make?Relying on nameplate capacity, ignoring utility bottlenecks, underestimating labor pressure, accepting old controls architecture without review, and failing to model compliance-driven capex. What trends will matter most in 2026?Water efficiency, energy management, refrigerant planning, digital traceability, stronger automation, cyber protection for controls systems, and sustainability expectations from retail and foodservice customers. Can a weak plant still be a good investment?Yes, if the issues are understood, costed, and fixable within the investment thesis. The key is separating reversible operational weakness from structural site limitations. What does a strong diligence outcome look like?A strong outcome includes a risk-ranked issue list, 12-to-36-month capex plan, normalized capacity model, compliance action plan, labor strategy, and a clear thesis for margin improvement after close. -
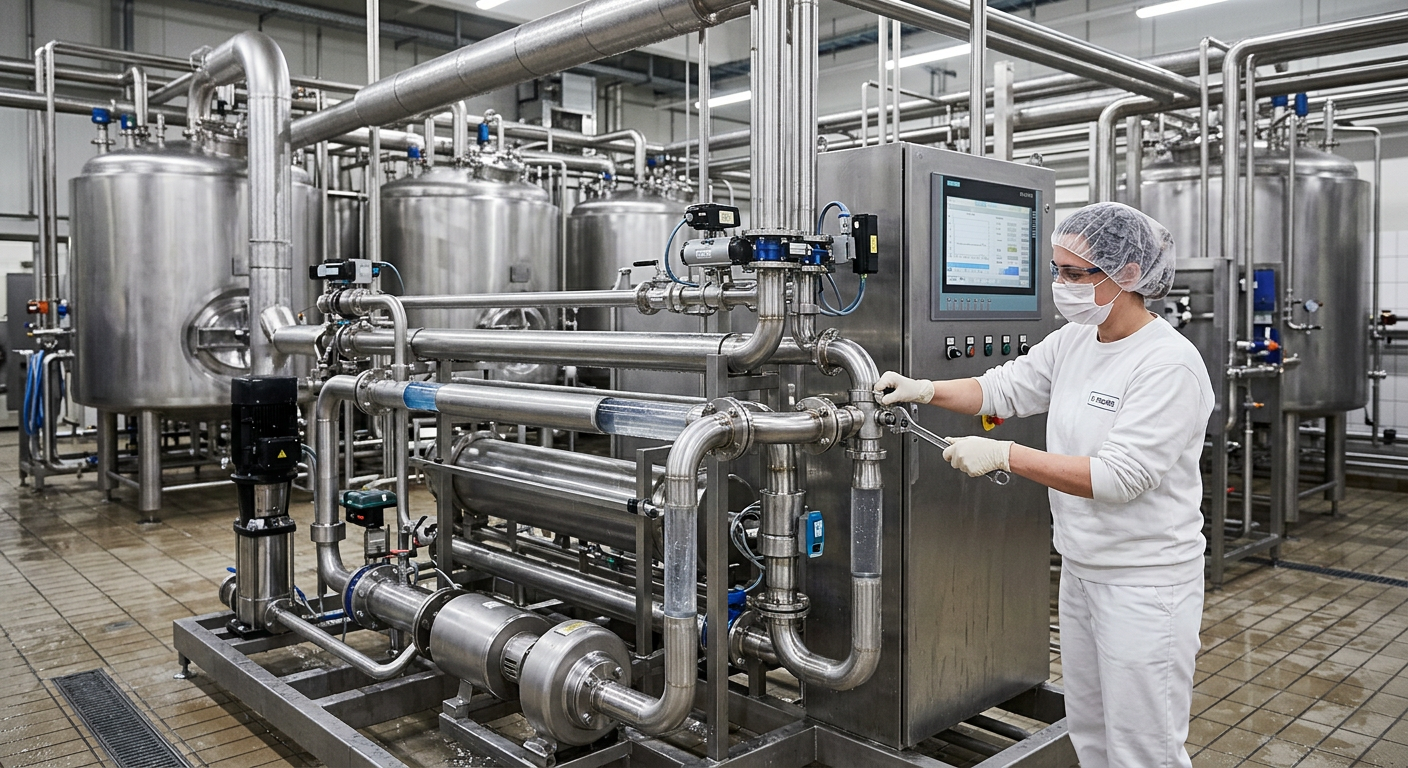
Hygienic Process Design for Food and Beverage
Food and beverage manufacturers in the United States are under constant pressure to improve food safety, reduce downtime, accelerate sanitation, and protect margins. Hygienic process design sits at the center of all four goals. It is not only about choosing stainless steel equipment; it is about shaping entire systems so they can be cleaned effectively, inspected easily, drained fully, and operated consistently under real production conditions. In high-volume markets such as dairy in Wisconsin, protein processing in Texas and Arkansas, beverage production in California, and co-packing near logistics hubs like Chicago, Atlanta, Houston, Savannah, and the Ports of Los Angeles and Long Beach, design errors can quickly become recurring sanitation costs or serious recall risks. For manufacturers evaluating a retrofit, line expansion, or greenfield build, hygienic design decisions affect piping, tank geometry, utility routing, CIP strategy, zoning, automation, and maintenance access. They also affect capital efficiency. A properly designed process line can shorten wash cycles, reduce chemical use, improve changeover time, and support regulatory readiness for FDA, USDA, SQF, and BRC expectations. Companies seeking an engineering-led partner often prioritize firms that can connect plant design to operations and profitability. That is why many operators reviewing food and beverage engineering services now look beyond basic installation and toward integrated execution models that unite design, build, and project management. Hygienic process design is the practice of engineering food and beverage equipment, piping, utilities, and production spaces so that product contact and nearby non-product-contact surfaces resist contamination, drain completely, can be cleaned and sanitized reliably, and do not create hidden microbial growth points. In the United States, effective hygienic design usually combines sanitary equipment selection, cleanable welds, proper slope, minimized dead legs, appropriate zoning, washdown-ready enclosures, and layout decisions that separate raw, RTE, allergen, and packaging risk. The fastest way to evaluate whether a process system is hygienically designed is to ask six practical questions. Can every product-contact surface be reached by CIP or COP? Will water drain instead of pool? Are there threads, lap joints, pits, hollow members, or cracked gaskets in exposed areas? Can operators visually inspect the critical surfaces? Does the line prevent cross-traffic between raw and finished goods? Can sanitation verify a repeatable clean every time? If the answer is no to any of these, the system probably needs redesign. For U.S. buyers, hygienic process design is not a luxury upgrade. It is increasingly a baseline requirement in dairy, beverages, proteins, sauces, aseptic operations, and high-risk ready-to-eat environments. Facilities shipping nationwide from regions like the Carolinas, the Midwest, California’s Central Valley, or the Gulf Coast need designs that hold up under aggressive production schedules and strict retailer expectations. The table above shows why hygienic design should be viewed as a plant performance strategy, not just a sanitation preference. Every item links directly to uptime, labor, compliance, and customer protection. The fundamentals begin with material selection, geometry, and cleanability. Most U.S. food and beverage manufacturers rely on stainless steel for product-contact surfaces, with 304 common in many applications and 316 or 316L selected where corrosion resistance is more demanding, such as salty brines, aggressive cleaning chemistries, or acidic products. However, material alone does not make a system sanitary. A perfectly good alloy can still fail hygienically if the equipment includes trapped volumes, poor slope, or inaccessible internals. Geometry matters because microbes exploit complexity. Tanks, valves, pump casings, and transfer lines should favor smooth transitions, radiused corners, self-draining orientation, and limited horizontal ledges. Gaskets and elastomers must be compatible with both product and cleaning chemicals. Instrumentation should be installed with sanitary fittings rather than ad hoc adapters. Structural supports near wet processing lines should avoid hollow bodies or exposed crevices. In older U.S. plants, especially converted warehouses or acquired facilities, legacy add-ons often create these problems over time. The layout of the process matters as much as the equipment itself. Hygienic process design must connect raw receiving, batching, thermal processing, filling, packaging, and utility systems into a cleanable flow. Plants near busy manufacturing corridors such as Dallas-Fort Worth, Charlotte, Indianapolis, or Southern California often operate under expansion pressure, which increases the temptation to shoehorn new lines into poor footprints. That is where disciplined process engineering prevents long-term sanitation penalties. Technology plays a growing role. Modern hygienic design increasingly integrates automation, PLC programming, SCADA visibility, recipe control, and CIP sequence management so that sanitation becomes measurable rather than assumed. This is where a technically broad partner can make a difference. Disruptive Process Solutions brings process, mechanical, electrical, controls, and utility engineering together, helping manufacturers align piping design, automation logic, and operating procedures rather than treating them as disconnected tasks. That technical integration is especially valuable when adding HTST, UHT, retort, aseptic, carbonation, blending, or water treatment systems into existing U.S. plants. For buyers, the key advice is to review hygienic design at the concept phase, not after fabrication begins. Late corrections are expensive. Early engineering can right-size slope, valve selection, CIP skids, routing, and clean utilities before stainless is cut. The market trend above reflects what many U.S. plants are already seeing: continued investment in hygienic upgrades, driven by labor efficiency, automation, retailer requirements, and risk reduction. Looking toward 2026 and beyond, the fastest growth is likely in automated CIP verification, digital maintenance records, hygienic robotics in packaging, and water- and energy-efficient washdown design. Microbial harborage points are the hidden spaces where moisture, product residue, and biofilms survive cleaning. In food and beverage manufacturing, three of the most common design failures are crevices, dead legs, and non-draining surfaces. These may appear small on drawings but become major sanitation liabilities once exposed to sugars, proteins, fats, starches, or frequent thermal cycling. Crevices often form at bolted overlaps, gasket misfits, poorly sealed supports, cracked weld repairs, and hollow framework ends. Dead legs typically occur when piping branches are too long relative to flow-through diameter, creating stagnant pockets during CIP or production. Non-draining surfaces appear on flat-top supports, level pipe runs, vessel jackets with poor outlet orientation, and enclosures that catch spray. In meat, dairy, RTD beverage, and sauce plants, these zones can sustain persistent environmental positives and repeated sanitation interventions. In the United States, harborage prevention is especially important in older facilities where repeated line changes have created “temporary” modifications that became permanent. Plants in legacy industrial areas such as the Midwest or Northeast often inherit these problems through acquisitions. A hygienic audit should map all likely trap points and classify them by product exposure, cleaning frequency, and contamination consequence. The table highlights how small geometric details become repeat sanitation failures. Corrective action should be prioritized based on risk to finished product, not just visual appearance. Product type also affects harborage severity. Protein slurries, dairy solids, nut-based drinks, fruit purees, marinades, and viscous syrups cling more aggressively than thin water-like products. Buyers should therefore ask equipment suppliers for cleanability evidence under their actual product conditions, not idealized water tests. Biofilms form when microorganisms attach to a surface, produce protective extracellular material, and become harder to remove through normal cleaning. Once established, they can seed recurring contamination events and increase chemical demand, water use, and sanitation labor. Geometry and surface finish are two of the strongest design controls against biofilm formation. Optimized geometry means reducing niches where residue stays behind after production. Smooth internal transitions, flush-mounted instruments, drainable pump orientation, and properly pitched piping reduce the retention time of soils. Surface finish matters because rougher surfaces give microbes and residues more footholds. While exact finish requirements vary by application, the practical goal is a smooth, defect-free, cleanable surface without pitting, undercut, inclusions, or mechanical damage from poor fabrication. For beverage plants producing kombucha, spirits, juice, dairy beverages, or carbonated soft drinks, biofilm prevention is especially important at fillers, blend manifolds, transfer panels, carbonation skids, and bright tank connections. For food plants, the same principle applies to scrape-surface systems, jacketed kettles, dairy lines, sauce manifolds, and aseptic transfer points. Facilities operating around humid climates such as the Southeast or Gulf Coast should also pay attention to external moisture management, since environmental wetness can support non-product-contact biofilms around drains and equipment bases. DPS supports this area not only through engineering but also through manufacturing insight. Its equipment capabilities include custom tanks, CIP systems, marination tumblers, and cooking vessels built to integrate cleanability into the mechanical design. That matters because true hygienic performance comes from how nozzles, internals, access points, and outlet geometry work together in real operation, not from surface finish alone. As 2026 approaches, expect greater use of computational flow modeling, spray coverage verification, and digital sanitation monitoring to support biofilm prevention. U.S. processors with complex SKUs and shorter runs will increasingly need these tools because more frequent changeovers mean more opportunities for cleaning variance. IP69K is commonly associated with protection against close-range, high-pressure, high-temperature washdown. In wet food and beverage environments, this rating matters for enclosures, sensors, junction boxes, HMIs, motors, and selected controls hardware exposed to aggressive sanitation. However, plant buyers should understand that an IP69K rating alone does not guarantee hygienic design. A component may resist water ingress yet still create external ledges, poorly cleanable housings, or cable routing issues that trap soil and moisture. High-pressure washdown design should be evaluated as a system. Cable glands, mounting brackets, seals, venting, and orientation all influence real performance. If a washdown-rated component is mounted beneath a flat plate where debris accumulates, the line still has a hygienic problem. Likewise, electrical survival after washdown is not the same as easy sanitation around the equipment. In U.S. protein plants, fresh-cut operations, dairy facilities, and high-moisture co-packing rooms, IP69K-rated hardware is often beneficial where intensive foam-and-rinse programs are used. In dry or low-moisture zones, over-specifying washdown hardware may add unnecessary cost. Buying advice should therefore tie enclosure and equipment ratings to the actual hygiene regime of each room. Manufacturers should also think about utility impact. Heavy washdown increases water use, drainage load, and humidity, affecting floors, HVAC, compressed air reliability, and maintenance workload. Plants near water-sensitive regions such as California are increasingly pairing hygienic design with water efficiency goals. By 2026, sustainability pressure will push more processors to optimize spray devices, recover rinse stages where possible, and use data to reduce excess wash time without compromising food safety. Hygienic zoning is the disciplined separation of plant spaces based on contamination risk. The principle is simple: do not allow people, tools, air, water, materials, or equipment to move in ways that carry contamination from dirtier zones to cleaner ones. In practice, zoning affects walls, doors, drains, pressure regimes, traffic paths, gowning, forklifts, utensil color coding, sanitation sequencing, and maintenance access. In the United States, zoning is critical for ready-to-eat products, dairy, aseptic beverage filling, protein slicing and packaging, and allergen-sensitive operations. A raw receiving area and an RTE packaging room should never function as if they are part of the same hygiene environment. Even when space is limited, risk can be reduced through room segregation, directional process flow, air handling strategy, and controlled personnel transitions. Facilities near major logistics nodes like Memphis, Chicago, Newark, Houston, or Atlanta often prioritize throughput, but speed cannot come at the expense of zone discipline. High-volume traffic is exactly why physical and procedural separation must be engineered in from the start. The table shows that zoning is not only a floorplan issue; it is an operating system. Good zoning reduces environmental positives, allergen incidents, and sanitation confusion while improving audit readiness. When redesigning a facility, it helps to partner with teams that understand both process and construction realities. A design-only plan can fail during installation if utilities, structural interferences, or contractor sequencing are ignored. DPS approaches projects through an integrated design-build-manage method that aligns engineering intent with field execution, which is especially useful in active plants where phased construction must preserve production continuity. U.S. manufacturers often encounter both EHEDG and 3-A when evaluating hygienic equipment, especially global brands, export-oriented processors, and multinational project teams. While both frameworks support hygienic design, they differ in origin, scope emphasis, and how users commonly apply them. 3-A Sanitary Standards are highly familiar in the United States, particularly in dairy and related sanitary processing applications. They are often used to assess equipment materials, fabrication, and cleanability expectations for specific equipment categories. EHEDG, which is influential in Europe and internationally, is widely recognized for broader hygienic design guidance and equipment evaluation methods focused on cleanability and contamination control principles. For U.S. buyers, the practical question is not which system is “better” in the abstract. The right question is whether the equipment and line design satisfy the plant’s product risk, regulatory environment, and sanitation regime. Many projects combine design lessons from both, especially in beverage, aseptic, and export-facing operations. The explanation is straightforward: standards are useful, but plant performance depends on real design execution. A “compliant” component installed in a poor layout can still create contamination risk. During procurement, ask for cleanability details, fabrication methods, gasket materials, slope assumptions, inspection access, and CIP coverage logic. Welding quality is one of the most underestimated drivers of hygienic performance. Even a well-designed line can become difficult to clean if welds contain pits, burn-through, undercut, sugaring, excessive reinforcement, or rough internal transitions. In sanitary piping, welds should support smooth product flow and effective cleaning without creating micro-niches for residue. Best practice starts with qualified procedures, controlled fit-up, correct purge technique, and material handling that prevents contamination prior to welding. Fabricators should protect tubing and fittings from shop debris, segregate carbon steel tools from stainless work where appropriate, and maintain traceability for critical materials. After welding, visual inspection, borescope review where needed, and appropriate finishing practices help confirm cleanability. In high-purity beverage, dairy, and aseptic applications, buyers should be especially careful about orbital welding strategy, documentation discipline, and passivation considerations where relevant. In protein and prepared foods, the same principle applies even if process complexity differs: poor welds create recurring sanitation pain regardless of product category. This is also where manufacturing capability matters. DPS supports clients with proprietary process equipment and integrated fabrication thinking, which helps ensure that tanks, CIP skids, and process assemblies are designed for installation reality rather than just shop appearance. The link between fabrication and field integration is critical in active plants where tie-ins, utility reroutes, and commissioning schedules are tight. For buying advice, request examples of sanitary fabrication work, weld quality expectations, inspection methods, and who is responsible for final field acceptance. The lowest initial fabrication quote often becomes the highest lifecycle cost if rework or contamination issues follow. The strongest business case for hygienic process design is that it improves profitability while reducing operational risk. Better geometry, cleaner welds, effective zoning, and validated CIP design can lower sanitation labor, water use, chemical consumption, changeover time, and lost production hours. At the same time, they reduce the likelihood of environmental positives, product quality failures, and expensive recalls. In U.S. manufacturing economics, small time savings matter. If a beverage line in North Carolina or California cuts 30 minutes from each CIP cycle, the annual capacity gain can be significant. If a protein line in the Midwest avoids recurring teardown because a harborage point was removed, maintenance and sanitation labor fall while OEE improves. If a dairy processor prevents one contamination incident, the savings in avoided product loss, customer claims, and reputational damage may dwarf the original design investment. Manufacturers often make the mistake of evaluating hygienic upgrades only by capital cost. A better framework is total cost of ownership. That includes labor, water, energy, chemicals, downtime, quality losses, audit disruption, and recall exposure. Companies with a long-term operating view usually find that hygienic design pays for itself faster than expected. The table above explains why finance, operations, QA, and engineering should all be involved in hygienic design decisions. This is not merely a sanitation expense; it is a margin protection strategy. Supplier selection matters because hygienic outcomes are shaped by how design, equipment, controls, and installation come together. U.S. manufacturers should evaluate whether a partner can support capital planning, engineering, equipment integration, utility design, construction coordination, and startup as one accountable workflow rather than as fragmented scopes. For those assessing partners, it is useful to review project case studies and verify whether the team has executed across both food and beverage environments. Plants with growth plans should also look for firms that can support expansions in multiple states, not just single-site work. What products benefit most from hygienic process design?Dairy products, RTD beverages, juices, sauces, dressings, fermented drinks, proteins, prepared foods, aseptic products, and allergen-sensitive items all benefit significantly. The higher the moisture, nutrient load, or contamination sensitivity, the greater the payoff. Is hygienic design only for new plants?No. Many U.S. manufacturers gain value from retrofits such as replacing dead-leg branches, upgrading CIP circuits, improving drainage, re-zoning traffic, or swapping non-sanitary instruments and fittings. How should buyers compare equipment suppliers?Compare cleanability, fabrication quality, drainability, washdown suitability, documentation, field support, and integration capability. Do not compare only purchase price. Also review the supplier’s process equipment portfolio to see whether they understand application-specific sanitary needs. Are EHEDG and 3-A enough to guarantee food safety?No. They are valuable frameworks, but execution, installation, maintenance, and sanitation discipline determine real performance. What are the most common hygienic design mistakes in the United States?Poor drainage, rushed retrofits, inaccessible equipment placement, inconsistent welding, zone crossover, and overreliance on washdown pressure instead of good geometry are all common issues. What should companies do first?Start with a hygienic risk assessment of process flow, equipment geometry, piping, utilities, and sanitation procedures. Then prioritize fixes by product risk and business impact. How does DPS fit into these projects?DPS supports food and beverage manufacturers across North America with process engineering, capital planning, equipment integration, installation, controls, and project management. The company is especially valuable for clients who want technically strong execution tied to measurable business outcomes. You can learn more about the DPS team and how it approaches profitable project delivery. What trends should plants prepare for in 2026?Expect tighter sanitation verification, greater automation in CIP and batch control, stronger sustainability pressure around water and energy use, more digital traceability, and broader demand for hygienic designs that support labor efficiency in a constrained workforce market. In summary, hygienic process design in the United States is no longer a niche engineering topic. It is a strategic requirement across food and beverage manufacturing, from brewing and spirits to dairy, proteins, aseptic lines, sauces, and co-packing. The best results come from combining sanitary principles, fabrication discipline, smart automation, and practical field execution. Manufacturers that invest early in cleanable design usually gain back the value through faster sanitation, stronger compliance, better uptime, and lower recall risk. -
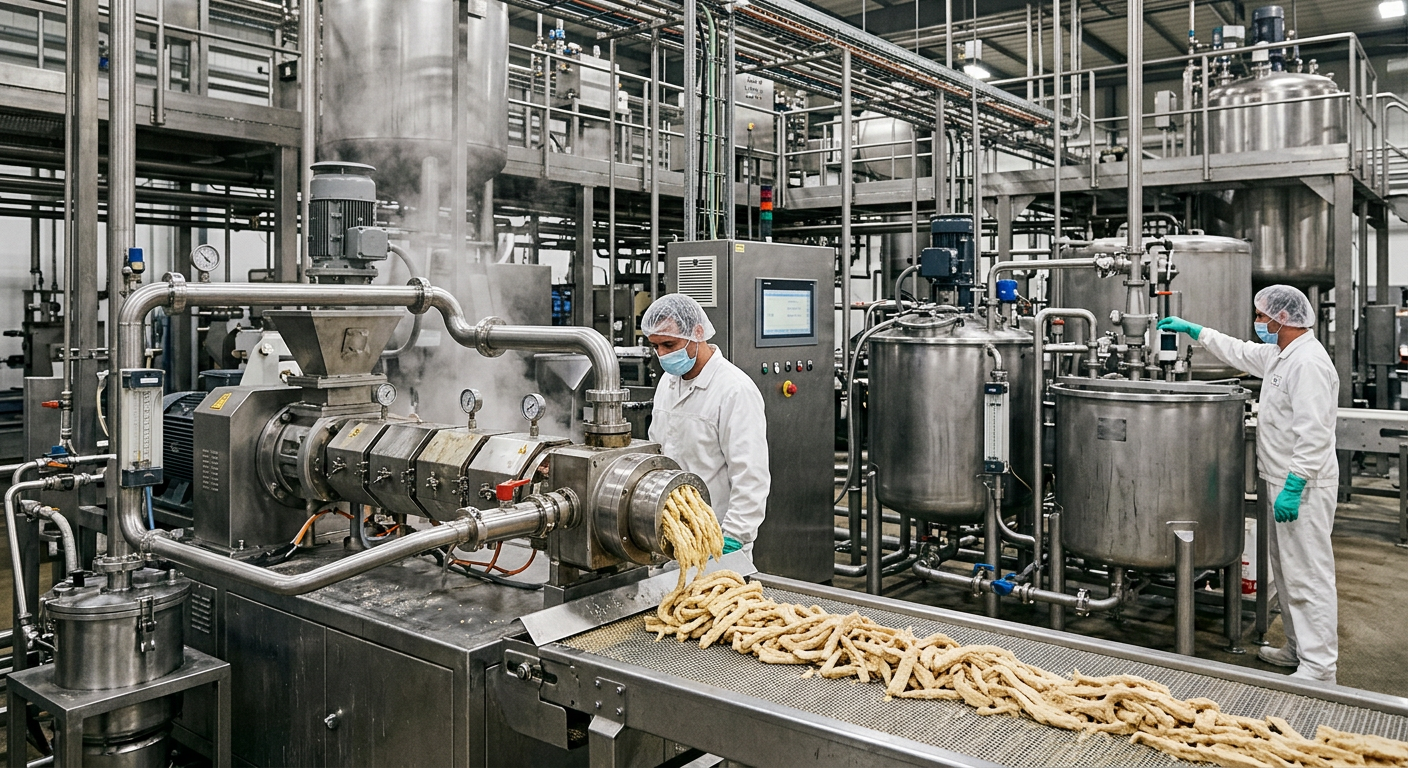
Food Plant IRR Calculation Methods: From Excel to Advanced Modeling
Capital spending in food and beverage manufacturing is rarely just about equipment cost. A new aseptic line in California, a protein expansion in Texas, a dairy retrofit in Wisconsin, or a beverage utility upgrade near Atlanta all require one core financial question: will this project create enough return to justify the risk? Internal rate of return, or IRR, is one of the most widely used metrics for answering that question. For plant owners, operations leaders, private investors, and procurement teams, understanding IRR helps turn engineering decisions into business decisions. This guide explains how IRR is calculated, where Excel works well, when XIRR or modified IRR is more useful, how IRR compares with net present value, and what benchmark return ranges are common in U.S. food and beverage projects. It also covers practical issues unique to manufacturing, such as staggered construction draws, startup losses, utility infrastructure, seasonal demand, co-packing contracts, and regulatory compliance timing. IRR is the discount rate at which a project’s net present value equals zero. In practical terms, it is the annualized return a food plant investment is expected to generate based on projected cash outflows and inflows. In the United States, food and beverage manufacturers often use IRR to compare projects such as line additions, process upgrades, automation retrofits, cold storage expansion, wastewater systems, and full greenfield facilities. For simple annual cash flow models, Excel’s IRR() function is usually enough. For real food plant projects with uneven spending dates, phased installations, delayed commissioning, and seasonally uneven receipts, XIRR() is typically more accurate. If management is concerned that conventional IRR overstates returns by assuming interim cash flows can be reinvested at the same rate, MIRR() provides a more conservative alternative. As a rule of thumb, IRR is useful for screening projects quickly, but it should not be the only metric. Food manufacturers in the U.S. should pair IRR with NPV, payback, debt service coverage, throughput analysis, utility loading, and operational risk review before approving capital. The table above is useful as a first filter. In food manufacturing, no single return metric captures every operational variable, so the best practice is to use the right tool for the cash flow pattern and then validate with at least one additional metric. IRR matters because food plants are capital intensive and margins can be thin. A project may look attractive on paper because it adds capacity, reduces labor, or improves compliance, but if the timing and reliability of future cash benefits are weak, the investment may not actually create value. IRR helps decision-makers compare expected return against their cost of capital, lender requirements, investor expectations, and opportunity cost. In U.S. food and beverage markets, projects often fall into several categories: capacity expansion, efficiency improvement, risk reduction, quality and compliance, product diversification, and market access. A cold-fill beverage line near Los Angeles may target retail growth through West Coast distribution. A ready-to-eat protein line in Chicago may be justified by labor savings and yield improvement. A wastewater pretreatment system in the Midwest may not generate direct revenue, but it can protect permits, avoid penalties, and enable future expansion. IRR forces teams to translate each of those operational outcomes into cash flow. Unlike simple ROI, IRR incorporates the timing of money. That is critical in food manufacturing because construction may start months before revenue begins. Long lead equipment, utility tie-ins, factory acceptance testing, site acceptance testing, seasonal launch windows, and staged commercialization all affect when value is realized. A project with the same total profit but a slower ramp will usually have a lower IRR. IRR also matters because U.S. food companies increasingly compete for capital internally. A multi-plant operator may need to choose between a new freezer tunnel in Arkansas, a dairy CIP upgrade in Idaho, a co-packer buildout in North Carolina, and automation in New Jersey. If leadership applies consistent return methods, projects can be ranked more objectively. This table shows why IRR must be interpreted in context. A high IRR on a narrow project may not be more important than a lower IRR on an infrastructure project that unlocks multiple future lines. Financial screening works best when combined with a plant-wide operating view. The line chart illustrates a realistic pattern of continued capital spending growth in the U.S. food and beverage sector into 2026, driven by automation, resilience, reshoring, food safety requirements, and energy efficiency investments. As capital demand rises, disciplined project selection through IRR and related metrics becomes even more important. For many teams, Excel remains the most practical place to start. The standard IRR function assumes cash flows occur at regular intervals, such as monthly or annually. The syntax is simple: =IRR(values, [guess]). The “values” range must include at least one negative number and one positive number. The negative value is usually the initial investment, and the positives are expected future net cash inflows. Suppose a snack manufacturer in Ohio spends $2,500,000 on a line expansion. Expected annual net cash flows after operating expenses are $650,000, $760,000, $840,000, $900,000, and $950,000 over five years. The Excel formula would calculate the discount rate that sets the project’s NPV to zero. If that result is, for example, 18.7%, management can compare it with the company’s hurdle rate. In food plant analysis, the key word is net. Cash inflows should reflect realistic production assumptions, yield losses, maintenance, labor, sanitation, ingredients, packaging, freight impacts where relevant, and working capital changes. Too many models use gross contribution or EBITDA shortcuts and overstate IRR. Another common issue is terminal value. If a project still has usable equipment value at the end of the model horizon, that can be included as salvage value. But it should be conservative, especially for specialized processing assets. A used retort system, evaporator, or custom CIP skid may not resell at the value managers hope for. The table demonstrates the structure of a simple model. It works well for screening projects at the feasibility stage, especially when management wants a fast answer. Still, before final approval, many U.S. food projects should move beyond annual bucket assumptions. When a project reaches engineering and execution planning, details matter. Utility upgrades may occur before process equipment arrives. Refrigeration loads may hit before production. Inventory buildup may happen before invoices are collected. Those timing shifts can materially change IRR. Teams that need stronger engineering-to-finance alignment often benefit from tying the spreadsheet model to capital planning, equipment selection, and execution sequencing. A well-defined delivery structure can improve forecast accuracy because process design, install complexity, and commissioning paths are clearer. Companies evaluating turnkey support can review food and beverage engineering services to understand how better scope definition supports more reliable return modeling. In real projects, cash rarely arrives on neat annual boundaries. That is why XIRR is often the better choice for food plants. The syntax is =XIRR(values, dates, [guess]). Instead of assuming equal intervals, it calculates annualized return using actual dates for each inflow and outflow. This is especially important when a project includes design fees in January, a utility package payment in March, tank fabrication progress billing in June, installation labor in September, startup costs in November, and customer receipts beginning the following April. These date differences affect the time value of money and therefore the return calculation. XIRR is often the right method for projects in major U.S. manufacturing corridors where construction windows, permitting cycles, or customer launch dates are tight. Consider a beverage facility near Dallas that must be operational before summer demand, or a seafood processing line tied to seasonal throughput in the Pacific Northwest. Schedule slippage may push meaningful revenue by several months, lowering return even if lifetime cash generation remains similar. XIRR also handles phased investment better. A company may spend $1.2 million this quarter, pause, then release another $2 million after customer approval. With regular IRR, those timing details are blurred. With XIRR, they are visible. The explanation is straightforward: XIRR makes the return calculation more realistic by matching the actual construction and commercialization calendar. In food manufacturing, where project execution is often uneven, that realism can materially improve decision quality. For teams building advanced models, date-level cash flows can also be linked to milestones such as FAT completion, mechanical completion, startup, first sellable production, and customer onboarding. This is particularly valuable for co-packers, branded manufacturers entering new channels, and plants with seasonal order patterns. Traditional IRR assumes that all interim positive cash flows can be reinvested at the same IRR. In large capital projects, that assumption may be unrealistic. Modified internal rate of return, or MIRR, improves the model by separating the finance rate for negative cash flows from the reinvestment rate for positive cash flows. In Excel, the syntax is =MIRR(values, finance_rate, reinvest_rate). For example, a manufacturer may finance its project at 8.5% and assume interim positive cash flows can only be reinvested at 6%. In that case, MIRR often produces a lower and more conservative return than standard IRR. This matters in food plants because many projects do not produce large free cash surpluses early in life. Some benefits are absorbed by working capital, training, changeovers, or customer qualification costs. MIRR can be a better decision tool when finance leadership wants assumptions aligned with real treasury conditions rather than purely mathematical return logic. MIRR is especially useful for long-duration U.S. projects such as greenfield beverage facilities, multi-phase protein expansions, or major aseptic and retort investments. It is also helpful when comparing debt-funded projects against internally funded ones, because the cost of capital structure is more explicit. The practical lesson is that MIRR does not replace IRR, but it can sharpen judgment. If a project only looks attractive under a generous reinvestment assumption, management should be cautious. IRR and NPV are best seen as complementary rather than competing tools. IRR tells you the percentage return. NPV tells you the dollar value created after discounting future cash flows at the required rate of return. If the question is “Which project has the highest annualized return?” IRR is helpful. If the question is “Which project creates the most value for the company?” NPV is often stronger. Suppose a plant in Tennessee is comparing two options. Project A is a $1 million automation upgrade with a 24% IRR and a modest NPV. Project B is a $6 million integrated process expansion with a 17% IRR but much larger NPV. If capital is not severely constrained and execution risk is acceptable, Project B may be the better strategic choice because it creates more absolute value. In food manufacturing, NPV is especially useful when comparing mutually exclusive projects, projects of different scale, or projects with long residual benefit. It is also valuable for infrastructure decisions such as wastewater treatment, boiler plants, refrigeration systems, and electrical backbone upgrades, where the return is tied to enabling future production rather than only near-term cash gain. When teams use both metrics together, they reduce the chance of approving a small but flashy return project while ignoring a bigger, more value-creating opportunity. The bar chart highlights where capital demand is currently strongest across major food and beverage segments in the United States. This matters because return expectations often vary by sector. Beverage and protein investments may attract stronger volume-based growth assumptions, while dairy or utility projects may depend more on efficiency and compliance benefits. Engineering detail can materially improve both IRR and NPV accuracy. Well-developed process layouts, utility balances, automation scope, and commissioning plans reduce surprises. For businesses evaluating complex projects, reviewing real project case examples can help benchmark what good planning looks like across different production environments. IRR is powerful, but in food manufacturing it is frequently misused. The most common mistake is overstating future cash inflows. Teams may assume perfect uptime, immediate customer demand, no changeover losses, no ingredient variability, and no startup waste. In reality, new lines often require debugging, operator training, recipe tuning, sanitation validation, and customer approval runs before they reach steady-state output. Another pitfall is incomplete CapEx scope. A model may include the filler and ignore the glycol upgrade, compressed air expansion, wastewater impacts, floor drains, steam capacity, structural supports, controls integration, or electrical service. That happens often in retrofits where hidden infrastructure constraints are discovered late. Many models also ignore downtime during installation. If a plant in New Jersey must shut down an existing line for tie-ins, the lost contribution margin should be part of the cash flow model. Likewise, working capital is often missed. Increased throughput usually requires more inventory, more packaging on hand, and sometimes longer receivables exposure. Multiple IRR issues can arise when cash flow signs change more than once. For instance, a project may begin with a large outflow, generate positive returns for several years, and then require a major compliance reinvestment. In those cases, standard IRR can become misleading or produce multiple answers. Inflation is another frequent blind spot. Labor, ingredients, utilities, and maintenance rates in the U.S. have not moved uniformly. Plants near high-cost labor markets like Southern California or the Northeast may need different assumptions than facilities in lower-cost regions. This table is a practical checklist. Most bad capital decisions are not caused by bad math but by poor assumptions. In food and beverage plants, the quality of the operational assumptions usually matters more than the elegance of the spreadsheet. The area chart shows a realistic trend shift toward efficiency-driven projects through 2026. Rising labor costs, energy management, automation, and sustainability goals are pushing more manufacturers to prioritize projects justified by operating savings, not just top-line growth. That changes how IRR models should be built because cost avoidance and utility performance become more important. There is no universal “good” IRR, but many U.S. food and beverage companies use hurdle rates that reflect weighted average cost of capital, project risk, customer concentration, strategic relevance, and execution complexity. Smaller privately held manufacturers may require higher returns because capital is scarcer and risk tolerance is lower. Large enterprise operators may accept lower IRRs on strategic infrastructure or network optimization projects. As a broad market reference, replacement projects may be approved in the low-to-mid teens if they reduce risk or sustain essential operations. Automation and debottlenecking projects often target the mid-teens to mid-20s. New product platforms, greenfield facilities, and projects dependent on aggressive sales assumptions may need even higher thresholds unless they are strategically necessary. Geography can matter too. Projects near major logistics hubs such as Chicago, Houston, Savannah, the Inland Empire, or the I-95 corridor may justify lower risk assumptions if labor, supplier access, and distribution economics are favorable. On the other hand, remote plants or projects dependent on limited utilities may need stronger return buffers. These are not fixed rules, but they offer useful orientation. The explanation behind the table is that return targets should align with controllable risk, not just investor preference. A low-risk utility backbone project can be strategically attractive below the IRR of a speculative new SKU launch. The comparison chart illustrates a realistic market view: supplier or delivery model selection can change planning accuracy and execution coordination, which in turn affects actual project IRR. A cheaper procurement path is not always the better financial path if integration, schedule control, and startup performance suffer. For buyers evaluating installed assets, utility skids, tanks, CIP systems, or custom process equipment, procurement strategy should be linked to the return model. Reviewing available food processing equipment solutions alongside installation and startup requirements can improve both budgeting and schedule assumptions. Disruptive Process Solutions supports food and beverage manufacturers across the United States and Canada with a business-first approach to capital execution. Rather than treating engineering as an isolated design task, the company focuses on profitable outcomes: aligning process scope, installed cost, ramp timing, and operating performance so manufacturers can make better capital decisions before the first purchase order is issued. On the technology side, DPS works across structural, mechanical, plumbing, electrical, process, and controls engineering, including PLC programming, automation, SCADA, recipe control, and system integration. That technical depth matters when IRR models rely on assumptions about uptime, throughput, utility consumption, sanitation cycles, and debottlenecking potential. If those operating assumptions are not grounded in real process engineering, return forecasts become guesswork. On the manufacturing side, DPS supports a broad mix of food and beverage applications, from brewing, spirits, wine, RTD, juice, dairy beverages, and aseptic systems to protein processing, prepared foods, sauces, ingredients, dairy processing, retort, and plant-based lines. The company also manufactures selected proprietary equipment such as tanks, CIP systems, marination tumblers, and cooking vessels. For clients, that mix can improve coordination between design intent and fabricated reality, reducing scope gaps that often erode project returns. On the service side, DPS operates through a Design Build Manage model that covers capital planning, feasibility, owner’s representation, process design, project and program management, general contracting where licensed, installation, integration, commissioning, and execution oversight. For manufacturers evaluating whether a project’s modeled IRR is actually achievable in the field, that end-to-end structure can be valuable because schedule, cost, and startup accountability are better connected. The company is headquartered in Cary, North Carolina, with a West Coast office in Lake Forest, California, and serves clients throughout all 50 states. Manufacturers looking to understand the team, operating philosophy, and project approach can visit the about page for Disruptive Process Solutions. For companies weighing line upgrades, expansions, or greenfield programs, the real advantage is not only engineering capability but the willingness to challenge weak assumptions before capital is committed. That matters for IRR. A project can appear strong in Excel and fail in execution if process constraints were misunderstood. The reverse is also true: a smart redesign can unlock far higher returns than initially expected by fixing the true bottleneck instead of overspending on unnecessary capacity. In a market where capital discipline is increasingly tied to resilience, energy performance, labor strategy, and 2026 sustainability targets, manufacturers need partners who understand both spreadsheets and stainless steel. A good IRR depends on project type and risk. Many manufacturers look for mid-teens or better on standard operating projects, while higher-risk greenfield or new product investments may need higher thresholds. Essential compliance or infrastructure projects may be approved at lower IRRs if they protect operations or unlock future capacity. If the project has uneven spending dates, phased billing, or delayed revenue ramp, XIRR is usually better. Most real-world food and beverage expansions have irregular cash flow timing, so XIRR often produces a more accurate annualized return. IRR can be misleading if the model ignores downtime, startup losses, utility upgrades, working capital, or realistic production ramp. It can also give confusing results when cash flows switch from negative to positive and back again. For value creation, NPV is often more important because it shows how many dollars a project adds after discounting. IRR is still useful for comparing return efficiency, but NPV is usually the better guide when choosing between projects of different sizes. Many models use five to ten years depending on equipment life, contract visibility, and strategic importance. Shorter horizons may miss real value, but longer horizons should be modeled conservatively, especially when product demand is uncertain. The most important assumptions are installed project cost, production ramp timing, line efficiency, labor savings, utility costs, working capital, maintenance, and demand certainty. For regulated environments, compliance timing and validation readiness can also be critical. By 2026, many U.S. manufacturers are expected to place greater emphasis on automation, energy efficiency, water use reduction, digital controls, traceability, and resilient domestic supply chains. That means IRR models should increasingly include sustainability savings, energy management impacts, carbon-related operating pressure, and policy-driven compliance investments alongside traditional throughput gains. Yes. Some projects are justified by strategic necessity, customer retention, food safety, permit protection, utility resilience, or labor risk reduction. In those cases, IRR should be evaluated alongside NPV, risk avoidance, and long-term operating strategy. In summary, IRR is a valuable tool for evaluating food plant investments in the United States, but it is only as good as the assumptions behind it. Use basic IRR for quick screening, XIRR for real project timing, MIRR for conservative reinvestment logic, and NPV to confirm value creation. When engineering scope, market demand, and execution planning are tightly integrated, return analysis becomes much more than a finance exercise. It becomes a smarter way to build profitable manufacturing projects. -
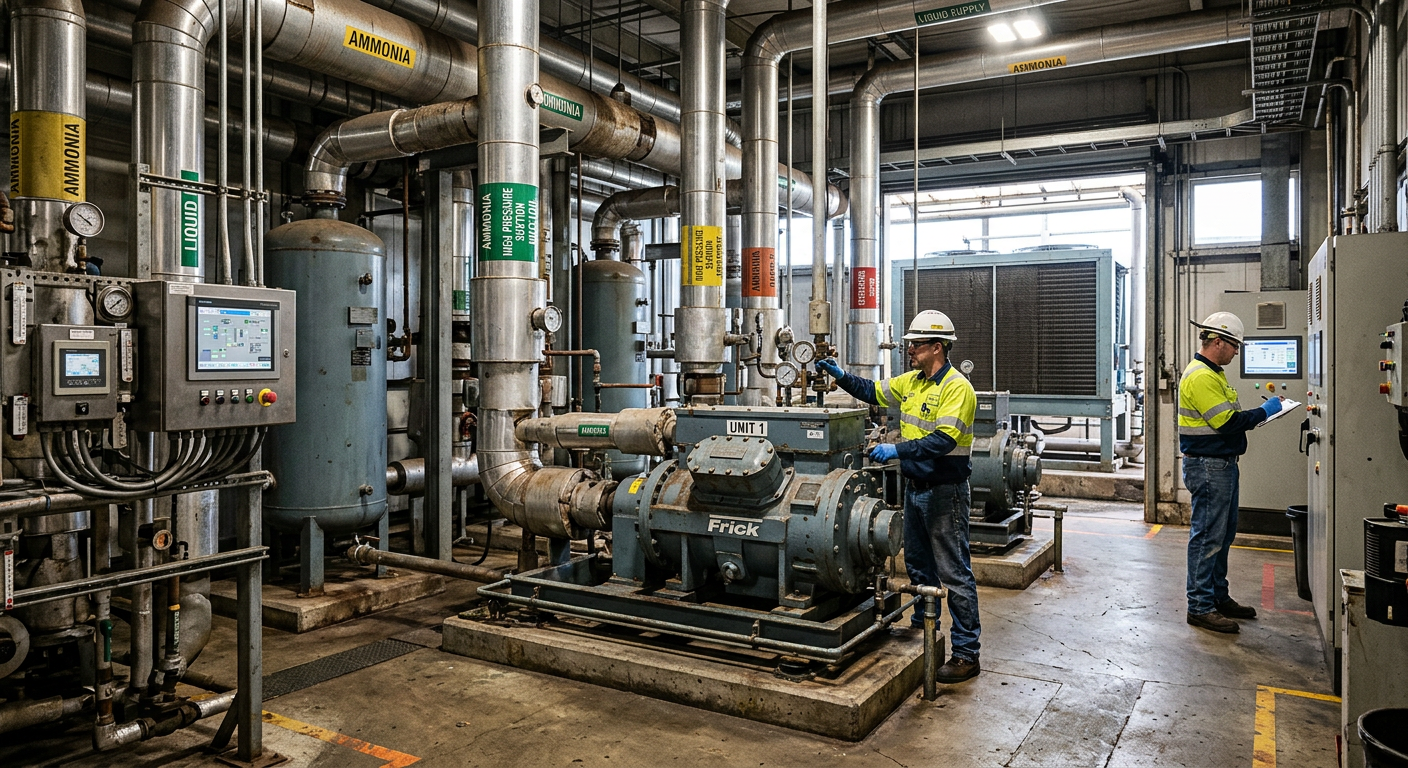
Food Manufacturing CapEx Planning: A Strategic Approach
Food manufacturing capital planning is no longer just an annual budgeting exercise. In the United States, it has become a strategic discipline that connects plant capacity, labor productivity, food safety compliance, energy performance, and long-term profitability. Whether a processor is adding a new high-speed packaging line in Chicago, expanding cold storage near Dallas-Fort Worth, modernizing a dairy system in Wisconsin, or upgrading aseptic capabilities on the West Coast, CapEx planning determines whether capital dollars create durable value or simply solve short-term pain. For food and beverage operators, the challenge is especially complex because capital projects touch multiple constraints at once: sanitation standards, utility loads, product changeovers, labor shortages, retailer service expectations, and volatile ingredient demand. Good planning therefore requires more than selecting equipment. It requires aligning process engineering, utilities, controls, construction, commissioning, and governance. It also requires realistic assumptions about downtime, startup curves, working capital, and the total cost of ownership over the life of the asset. Across the United States, manufacturers are increasingly prioritizing investments in automation, flexibility, wastewater treatment, energy reduction, and plant resilience. Facilities near ports such as Los Angeles, Long Beach, Savannah, Houston, and Newark are making different capital choices than processors in the Midwest protein belt or the Southeast beverage corridor. Yet the same basic principle applies everywhere: capital must be deployed where it improves throughput, reduces risk, and supports profitable growth. CapEx planning in food manufacturing is the structured process of deciding where, when, and how to invest in long-term assets such as processing equipment, utilities, buildings, controls, and digital systems. In the United States, an effective CapEx plan usually covers a 1-year budget, a 3-year project pipeline, and a 5-year strategic roadmap. It ranks projects by safety, compliance, reliability, cost savings, capacity growth, and return on invested capital. For most food plants, strong CapEx planning answers five questions quickly: The best plans are cross-functional, data-backed, and phased. They combine maintenance spend for aging assets with growth investments for new products, line extensions, or market expansion. They also account for permitting, procurement lead times, utility upgrades, and startup support. In practice, many of the most successful projects are not the biggest projects. They are the ones that solve the real bottleneck with the least wasted capital. A useful example is when a processor believes it needs a new multi-million-dollar line to increase output, but the true constraint turns out to be controls logic, utility instability, or CIP cycle time. In those cases, disciplined planning prevents overbuilding and protects cash flow. That is why many U.S. operators now bring engineering and project management partners into the process earlier rather than treating engineering as a post-approval step. Capital expenditure planning in food manufacturing is the process of evaluating, prioritizing, approving, and executing investments in long-life physical and digital assets. These investments often include process equipment, packaging machinery, refrigeration, boilers, compressed air, wastewater systems, clean utilities, electrical distribution, automation, warehouse infrastructure, and facility expansions. In food and beverage, CapEx planning differs from many other industries because operating conditions are tightly regulated and operationally interdependent. A new filler may require floor reinforcement, more compressed air, higher sanitary water capacity, modified CIP logic, additional glycol load, upgraded electrical service, and revised traffic flow in the packaging hall. If any of those dependencies are overlooked, the asset can underperform even if the equipment itself is high quality. At a strategic level, CapEx planning usually serves one or more of these business goals: It is also important to distinguish CapEx from operating expense. Capital spending generally creates or extends the life of an asset beyond the current period, while operating expense covers recurring costs such as routine maintenance, consumables, and utilities. In reality, many food manufacturers operate in a gray zone, especially around controls retrofits, sanitary improvements, or line modifications. Clear accounting rules and governance are therefore essential. In the U.S. market, CapEx planning is also shaped by labor availability, regional power cost, freight patterns, and customer service requirements. A beverage plant shipping to the Northeast from Pennsylvania may optimize differently than a protein processor supplying national distribution from Kansas or Nebraska. Facilities serving club stores and large grocery chains often prioritize uptime and SKU flexibility, while co-packers may emphasize fast changeover and scalable utilities for future customer wins. From an execution standpoint, effective planning usually starts with a current-state assessment of process flow, reliability issues, quality losses, utility constraints, staffing, and growth demand. That assessment should be followed by alternatives analysis, preliminary design, budget validation, ROI modeling, and implementation sequencing. Manufacturers that skip the front-end definition phase often face budget drift and late-stage rework. For companies that need outside support, an engineering partner should contribute more than drawings. It should bring process understanding, construction practicality, startup discipline, and the ability to connect manufacturing economics to project scope. This is especially important for food plants where a poorly scoped shutdown can disrupt production windows tied to harvest cycles, holiday peaks, or retailer promotions. Most food manufacturing CapEx plans can be organized into three major categories: equipment, infrastructure, and technology. This structure helps executive teams compare unlike projects using a common framework. Equipment projects include core process assets and packaging systems: mixers, kettles, fermenters, fillers, pasteurizers, cookers, retorts, slicers, pumps, conveyors, case packers, palletizers, and storage tanks. These projects usually tie directly to capacity, labor savings, quality, or product expansion. In beverage, examples include bright tanks, blending systems, carbonation skids, tunnel pasteurizers, and aseptic fillers. In food, common projects include marination systems, smokehouses, thermal processing lines, portioning equipment, high-shear mixers, and dairy processing skids. Infrastructure includes the enabling systems around production: boilers, steam distribution, glycol, refrigeration, HVAC, compressed air, electrical service, water treatment, wastewater, CIP, fire protection, drains, floors, and buildings. These projects are often less visible than production machinery but can be the difference between a successful expansion and a stalled one. For example, a new retort system without enough steam capacity or condensate return performance will never reach target throughput. Technology projects include PLC upgrades, SCADA, recipe management, batch controls, line monitoring, traceability, energy management, vision inspection, cybersecurity, and plant data systems. In many U.S. plants, technology projects now compete directly with equipment projects because software and controls improvements can unlock significant capacity with lower capital intensity. A well-executed controls upgrade may reduce changeover time, improve batching accuracy, and stabilize CIP, producing benefits across multiple lines at once. Below is a practical table that shows how many plants categorize capital requests. This table matters because food plants often underfund infrastructure and technology while overfocusing on visible production equipment. The result is a line that looks modern but runs below design rate. A balanced CapEx portfolio recognizes that equipment creates output, infrastructure protects uptime, and technology improves control and repeatability. When evaluating assets, manufacturers should also consider product type. A protein facility may prioritize sanitary conveyors, deboning automation, cook-chill capacity, and ammonia or Freon alternatives in refrigeration. A beverage co-packer may prioritize syrup rooms, blending accuracy, canning or bottling flexibility, carbonated product handling, and utility redundancy. A dairy plant may place more weight on homogenization, separation, UHT, aseptic fill, and wash cycle validation. In many projects, the most value comes from integrated scope. Companies that explore custom process equipment solutions together with utilities and controls planning often avoid expensive field modifications later. That integrated approach is especially useful when plants need tanks, CIP systems, cooking vessels, or other sanitary process assets sized to specific operating conditions rather than generic catalog assumptions. Technology has become central to CapEx decisions in the United States. More processors are investing in PLC programming, automation, SCADA visibility, recipe management, and energy monitoring because these tools can improve throughput without adding square footage. Advanced controls are especially relevant in fermentation, distillation, blending, dairy processing, aseptic systems, and retort operations where repeatability directly affects yield and compliance. In many cases, the smartest capital is not more steel; it is better logic, better data, and better line integration. Most successful food manufacturers use a recurring CapEx cycle rather than treating projects as isolated requests. A typical cycle includes strategy setting, project identification, concept development, cost estimating, prioritization, approval, procurement, execution, startup, and post-audit review. The exact calendar varies by company, but many U.S. operators start building the next year’s capital list in the second quarter so that preliminary budgets can be tested before annual planning season. A practical timeline often works like this: Long-lead equipment can stretch this cycle. Electrical gear, refrigeration systems, sanitary tanks, automated packaging lines, and specialized thermal systems may require procurement decisions months before installation. Facilities near crowded trade corridors such as Southern California, Houston, or the New York-New Jersey region may also face schedule risk from freight congestion or local contractor availability. This planning sequence is important because food plants cannot afford endless revisions once contractors, operators, and production schedules are committed. A strong front-end loading process reduces field changes, protects sanitation standards, and minimizes downtime during tie-ins. The chart below shows a realistic index of planned food and beverage capital growth in the United States, reflecting the shift toward modernization, resilience, and automation through 2028. The upward trend reflects more than simple inflation. It also reflects rising interest in automation, utility resilience, sustainability projects, nearshoring support, and capacity additions for high-growth categories such as RTD beverages, prepared foods, value-added protein, and shelf-stable products. One of the biggest mistakes in food manufacturing capital planning is selecting projects based on purchase price rather than total cost of ownership. The cheapest asset upfront may be the most expensive asset over ten years if it consumes more labor, more water, more chemicals, more energy, or more maintenance time. TCO is especially important in sanitary environments where downtime, cleaning, and product loss can quickly exceed the original equipment cost. A solid TCO analysis should include: For example, a low-cost filler may appear attractive until the team calculates sanitation labor, filler valve wear, changeover losses, and lower speed consistency. Similarly, a budget chiller may cost less at purchase but more in compressor maintenance and energy over its life. In plants with high washdown intensity or around-the-clock production, these differences are magnified. The table shows why TCO often changes the decision. In many food plants, downtime costs dwarf equipment savings. That is particularly true in high-throughput facilities near major distribution hubs where missed service levels can affect national retailers. A processor shipping from Memphis, Atlanta, or the Inland Empire may incur not only lost production but also premium freight and customer penalties when assets perform below target. Technology projects deserve TCO analysis as well. Controls modernization, SCADA, and energy management systems may look intangible compared with stainless equipment, but they can improve labor efficiency, traceability, and batch consistency across multiple lines. This is where strong engineering teams add value by quantifying benefits beyond a simple payback. Companies exploring broader plant modernization can review integrated engineering and project delivery services to understand how early design choices affect installed cost and lifecycle performance. Every food manufacturer faces the same capital tension: how much should go to growth, and how much should go to sustaining the existing asset base? Too much maintenance spend can leave the company strategically stagnant. Too much growth spend can create fragility if core utilities and aging systems are neglected. The strongest capital plans balance both. Growth projects usually include new lines, packaging formats, product category expansion, acquisitions, and capacity additions for customer wins. Maintenance or sustaining projects include boiler replacement, roof repair, refrigeration upgrades, controls migration, sanitary floor repair, drain improvements, electrical distribution, and end-of-life equipment replacement. While sustaining projects may not always deliver flashy ROI, they protect uptime, audit readiness, and worker safety. A useful planning approach is to divide the capital portfolio into four buckets: Leadership can then target a portfolio mix based on business maturity. A newer, fast-growing co-packer may tilt toward growth and flexibility. A legacy plant with aging utilities may need a heavier reliability and compliance allocation. The optimal balance changes by site, not just by company. The area chart below illustrates a realistic trend shift in the U.S. market, where spending is increasingly moving from reactive maintenance toward automation, resilience, and strategic growth through 2028. This trend matters because 2026 and beyond will likely reward plants that combine reliability with flexibility. Labor constraints, retailer speed expectations, and sustainability pressure are all pushing U.S. manufacturers toward smarter assets, not just larger ones. Predictive maintenance, utility monitoring, modular skids, and digital batching are becoming more common, especially in beverage, dairy, prepared foods, and aseptic applications. From a buying perspective, operators should avoid treating growth and maintenance as separate universes. A line addition that relies on an aging boiler plant, undersized compressor room, or obsolete controls network is not truly a growth project. It is a growth project carrying hidden failure risk. CapEx decisions are strongest when they reflect actual manufacturing realities by product type. Beverage projects often involve fermentation systems, blending and batching, carbonation, hot fill or cold fill, filtration, water treatment, and pasteurization. Food projects may require grinding, mixing, forming, cooking, smoking, retort, slicing, dairy processing, or plant-protein hydration and texturization. Investments should match the process physics and sanitation profile of the category, not just a generic equipment template. This is especially true for plants serving proteins, sauces, dairy, RTD beverages, co-packing, and aseptic production where product integrity depends on tightly integrated process design. Even the best technical concept can fail if the approval process is weak. Governance gives the organization a repeatable way to compare projects, test assumptions, control risk, and assign accountability. In food manufacturing, the approval process usually includes plant leadership, operations, finance, engineering, quality, procurement, and executive sponsors. Strong governance typically includes the following elements: Many companies use approval thresholds. A small reliability project may be approved at plant level, while a multimillion-dollar expansion may require corporate review, board visibility, or lender alignment. Governance should scale with project risk, not just project size. For example, a modest CIP redesign in a dairy or aseptic environment may deserve high scrutiny because product safety exposure is significant. Well-governed projects also need ownership during execution. This is where an experienced owner’s representative or integrated project partner can be valuable, especially for companies managing multiple sites or complex shutdown windows. When engineering, contractor coordination, procurement tracking, startup planning, and field communication are fragmented, hidden costs multiply. A disciplined project structure protects schedule, cash, and operating readiness. Some manufacturers find it useful to study previous delivery models and lessons learned through detailed project examples. Reviewing food and beverage capital project case studies can help teams benchmark how others approached facility moves, utility integration, or phased capacity increases without disrupting customer commitments. There is no single benchmark that fits every facility, but benchmarking remains useful for sanity-checking capital plans. In the United States, capital intensity varies widely by segment, age of facility, automation level, and growth strategy. Beverage and dairy plants often require significant utility and sanitary process investment. Protein plants may carry higher refrigeration, wastewater, and washdown infrastructure costs. Shelf-stable and aseptic operations can involve larger validation and controls scope. Common benchmark lenses include: The table below offers realistic directional benchmarks for the U.S. market. Actual figures vary by company and project complexity, but these ranges help frame discussion. These ranges are useful, but they should never replace site-specific analysis. A high benchmark may be appropriate for a fast-scaling operation near Charlotte, Nashville, Phoenix, or the Central Valley if utility and warehouse infrastructure are being built for future demand. Likewise, a lower benchmark may be rational in a mature site focused on reliability and margin improvement. The bar chart below compares current demand for capital projects across major food and beverage segments in the United States. Demand remains broad, but beverage, co-packing, and flexible prepared foods continue to attract significant capital because those categories benefit from packaging variety, innovation speed, and retailer-driven launch cycles. Another benchmark question is supplier or project-model comparison. The chart below compares decision factors that food manufacturers commonly use when choosing among capital delivery options. The comparison highlights a growing preference for integrated project models in the U.S. market, especially where sanitary process systems, utilities, controls, and construction sequencing need to work as one package. This is relevant for greenfield sites, major line relocations, and multi-phase expansions. Looking ahead to 2026, three benchmark shifts are likely to matter even more: Disruptive Process Solutions supports food and beverage manufacturers across the United States and Canada with a practical, business-first approach to capital projects. Rather than treating engineering as an isolated design activity, the company works to connect capital planning, process performance, construction execution, and long-term operating value. That matters for manufacturers that want more than a contractor. It matters for operators who want a partner that will challenge assumptions, identify the real bottleneck, and protect return on capital. DPS serves processors in all 50 states, with experience spanning beverage, protein, dairy, prepared foods, aseptic systems, shelf-stable applications, and co-packing operations. The company’s model is built around designing the right solution, building it with disciplined coordination, and managing execution so the full project performs as intended in the field. Manufacturers can learn more about the firm’s background on the company overview page. DPS offers capital planning and feasibility studies, owner’s representative support, project and program management, general contracting where licensed, equipment supply, installation, and system integration. This service structure is especially useful for companies that need one team to manage scope from concept through commissioning. In CapEx planning, that reduces the disconnect between what is approved on paper and what can actually be installed within a shutdown window. On the technology side, DPS supports process, controls, and automation needs that directly affect capital value. Capabilities include PLC programming, SCADA, system integration, and control strategies that improve throughput, recipe control, and utility performance. This is particularly relevant for fermentation, distillation, thermal processing, blending, aseptic operations, and energy management where small logic changes can unlock significant productivity gains. From a manufacturing standpoint, DPS works across beverage systems such as brewing, spirits, wine, kombucha, RTD, soft drinks, juices, dairy beverages, and aseptic processing, as well as food applications including proteins, sauces, dressings, prepared foods, dairy, retort, and plant-based products. The company also designs and supplies process equipment such as tanks, CIP systems, tumblers, and cooking vessels, allowing projects to align process intent with equipment execution more closely. A major differentiator is the company’s willingness to prioritize profitable outcomes over project volume. In real terms, that means challenging overbuilt solutions, identifying lower-cost bottleneck fixes where appropriate, and aligning capital deployment with the client’s business model. For food manufacturers in the United States, especially those balancing rapid growth with constrained labor and utility infrastructure, that kind of directness can materially improve project outcomes. It depends on project type. Labor-saving and bottleneck projects often target 2 to 3 years. Compliance, infrastructure, and strategic capacity projects may justify 4 to 6 years if risk reduction or long-term growth is strong. Most plants should maintain a 12-month approved budget, a 3-year prioritized pipeline, and a 5-year strategic capital roadmap. Long-lead projects may need even earlier concept work. Utility upgrades, rigging, controls integration, sanitation impact, startup support, operator training, and downtime during installation are among the most commonly missed items. Yes. In many U.S. plants, controls and data projects can produce faster returns than adding equipment, especially when the real bottleneck is changeover time, batching accuracy, or inconsistent line control. There is no universal split. Plants with aging infrastructure may need a larger sustaining allocation, while high-growth sites may emphasize expansion. The right answer depends on asset condition, market demand, and risk exposure. All food and beverage segments benefit, but the impact is especially high in beverage co-packing, dairy, protein processing, aseptic manufacturing, prepared foods, and RTD categories where utilities and sanitation complexity are significant. Common reasons include poor root-cause diagnosis, incomplete scope, underestimated installed cost, weak startup planning, unrealistic labor assumptions, and insufficient operator training after handoff. Use a weighted scorecard that includes process fit, hygienic design, throughput, changeover time, utility use, maintenance burden, controls compatibility, startup support, and total installed cost, not just purchase price. Expect continued emphasis on automation, sustainability, energy efficiency, water management, cybersecurity for connected systems, and more disciplined governance around resilient supply chain capacity. Ideally at the feasibility stage, before scope is locked. Early involvement helps identify the true bottleneck, validate utility needs, improve estimating accuracy, and reduce rework during execution. In the United States, food manufacturing CapEx planning works best when it is treated as a strategic operating discipline rather than a procurement event. Plants that connect process insight, lifecycle cost, governance, and execution discipline make better capital decisions and recover value faster. Whether the priority is growth, modernization, compliance, or resilience, the objective remains the same: put capital where it produces durable operational and financial results. -
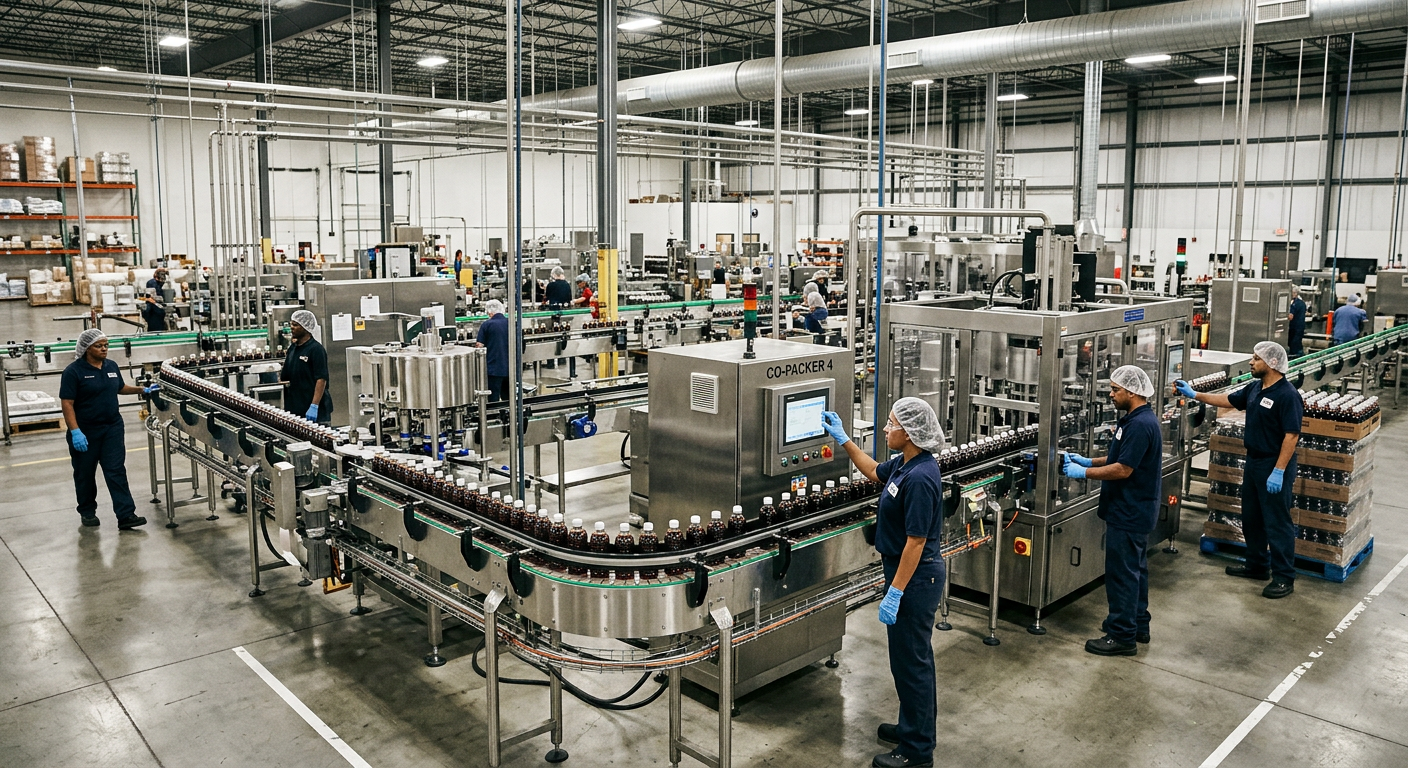
Food Plant Expansion Cost Estimation in 2026: 8 Critical Factors
Expanding a food plant in the United States in 2026 will require more than a rough construction budget. Capital costs are being shaped by domestic manufacturing lead times, utility infrastructure upgrades, labor availability, code compliance, automation, and sustainability requirements. For processors adding new lines, extending warehouse space, upgrading utilities, or converting a plant for higher-value products, accurate cost estimation is now a strategic tool rather than a simple finance exercise. Whether a project is located near Chicago, Dallas-Fort Worth, Fresno, Charlotte, Atlanta, Omaha, the Inland Empire, or port-driven markets such as Houston, Savannah, Newark, and Los Angeles/Long Beach, the same rule applies: the early estimate must reflect how the facility will actually run. That means process design, material flow, sanitation, utility loading, commissioning, and operational constraints all need to be priced together. In food and beverage manufacturing, underestimating one system often forces expensive changes in five others. For a U.S. food plant expansion in 2026, the most accurate cost estimate should account for seven core cost drivers: process equipment, civil and structural scope, utility and MEP infrastructure, regulatory compliance, contingency and risk reserve, labor and installation, and commissioning and validation. In most projects, equipment and process systems are the largest share of spending, but hidden overruns often come from utility upgrades, sanitation requirements, installation complexity, and production downtime during tie-ins. As a practical benchmark, many mid-sized plant expansions in the United States begin in the high six figures and quickly move into multi-million-dollar territory once refrigeration, boilers, CIP, controls integration, structural modifications, and code-driven improvements are included. The best buying advice is to budget from the process outward, not from the building inward. In other words, start with production goals, product mix, packaging format, sanitation standards, and throughput requirements before locking in construction numbers. That approach matters across product types including dairy beverages, protein processing, sauces and dressings, ready-to-drink beverages, aseptic products, fermented beverages, plant-based foods, and shelf-stable packaged foods. It is especially important for processors serving retail, foodservice, club store, private label, and co-packing applications where line efficiency and compliance can make or break return on investment. The table above shows why a plant expansion estimate must be treated as a system-based model instead of a single lump sum. Even if equipment pricing appears stable, real project totals can shift when a plant needs a larger service entrance, wastewater pretreatment, sanitary drainage changes, or production phasing to keep current lines operating. Cost estimation accuracy matters because plant expansions are rarely isolated construction projects. They affect throughput, scheduling, food safety, staffing, warehousing, maintenance, energy use, and customer service levels. A weak estimate does not just increase capital spending; it can delay commercialization, reduce capacity gains, disrupt distribution commitments, and erode margins for years. In the United States market, processors are expanding for several reasons in 2026: reshoring, regional network optimization, SKU growth, automation, labor shortages, cold-chain capacity needs, and demand from private label and co-manufacturing. The market is especially active in the Midwest protein corridor, the Southeast manufacturing belt, Texas beverage and prepared foods hubs, California processing regions, and the Northeast warehouse-to-production conversion market. In each of these areas, local labor rates, utility rates, permitting timelines, and contractor availability can materially change project outcomes. For example, a dairy or beverage line near the Port of Los Angeles may face different imported component lead times than a protein facility in Kansas City or a sauce plant in New Jersey. A facility in North Carolina may have strong access to regional trade partners, but an older building may still need extensive sanitary drainage and electrical modernization. Accurate estimation turns those realities into a decision-making advantage. It also supports better buying decisions. Owners can compare domestic versus imported equipment, assess whether to retrofit or build greenfield, and decide whether to add automation now or leave expansion hooks for later. Strong estimates help companies prioritize profitable scope rather than simply approving the cheapest-looking quote. Equipment and process systems usually dominate the capital budget because they define the operating capability of the expansion. In food and beverage projects, this category includes tanks, pumps, skids, mixers, cookers, fillers, pasteurizers, retorts, heat exchangers, conveyors, homogenizers, separators, batching systems, filtration systems, dosing systems, and clean-in-place equipment. Controls architecture, PLC programming, recipes, SCADA, and line integration are part of this category as well, even though buyers sometimes separate them out. Costs vary sharply by product family. A simple dry ingredient handling addition has a very different budget profile than a USDA protein room, a high-acid hot-fill beverage line, or an aseptic expansion. Product applications influence metallurgy, hygienic design, cleaning requirements, pressure ratings, automation depth, and validation burden. Product diversity also affects changeover complexity and therefore capital intensity. Another major issue in 2026 is lead-time strategy. Domestic fabrication can reduce logistics risk and improve field-fit coordination, but may carry a premium depending on vessel size, controls, and specialty fabrication. Imported systems may appear cheaper on paper, yet freight volatility, customs timing, field modifications, and document gaps can erase savings quickly. Plants near ports like Houston, Savannah, and Long Beach may gain some logistics advantages, but inland freight, rigging, and schedule risk still need to be priced. For many manufacturers, the smartest path is not necessarily to buy the most equipment. It is to size the right system for current revenue and future scale. Oversized systems can create unnecessary utility loads and higher cleaning costs. Undersized systems can throttle growth and force rework within two years. The table above shows why a line-item estimate based only on equipment purchase orders is incomplete. Product category drives not just machine cost, but also utility loads, piping design, sanitary access, floor loading, and startup time. From a technology standpoint, many U.S. plants are prioritizing smarter controls in 2026. Recipe automation, SCADA visualization, batch tracking, energy monitoring, and PLC modernization can often improve capacity without adding major steel. That is one reason manufacturers look for partners with deep process and controls capability, not just installation crews. A firm like DPS equipment solutions can support integrated thinking by aligning process hardware with automation, cleanability, and maintainability rather than treating each purchase as a standalone item. Civil and structural work is one of the most underestimated parts of a food plant expansion. Owners often focus on the visible production equipment and discover late in design that the building slab is too thin, the steel cannot support new mezzanines, the roof needs reinforcement for HVAC, or the truck court must be reconfigured for material flow. In older U.S. facilities, hidden conditions are common, especially in converted warehouses and legacy plants built in phases over decades. This category can include slab demolition, trench drains, housekeeping pads, equipment pits, curb work, pipe bridges, support steel, roof openings, mezzanines, loading docks, wall penetrations, insulated panel repairs, and site drainage. For cold and wet environments, floor slope, thermal breaks, and hygienic surface finishes can significantly affect cost. Geography matters. Midwest freeze-thaw conditions, Gulf Coast humidity, West Coast seismic requirements, and hurricane exposure in southeastern states can all affect foundations, bracing, and enclosure design. In places such as California, Washington, and some parts of the Northeast, code and seismic upgrades can materially reshape expansion budgets. Likewise, in rapidly growing manufacturing corridors around Nashville, Phoenix, and Charlotte, site access and municipal utility tie-in constraints can add unexpected civil work. This table highlights a common pattern: structural scope often grows after process design advances. That is why leading estimates should include site walks, utility mapping, and as-built verification early rather than waiting until equipment is ordered. Utility infrastructure and MEP are frequently the difference between a workable expansion and an expensive problem. Mechanical, electrical, plumbing, refrigeration, steam, compressed air, process water, wastewater, HVAC, and fire protection must all support the increased load. Existing plants may have enough square footage for new production but not enough chilled water, amperage, boiler output, air capacity, or sanitary sewer handling. In food plants, utility design cannot be generic. A chilled sauce line, a retort room, a distillery, a cultured dairy operation, and a beverage syrup room have very different load profiles. Utility needs must be modeled with real process assumptions: peak draw, simultaneous cleaning, production scheduling, packaging speed, and washdown demand. MEP cost also rises when owners want resilience. Dual utility headers, backup compressors, future capacity stubs, larger electrical rooms, and energy monitoring all improve long-term operating flexibility but need to be intentionally budgeted. With more U.S. processors focusing on uptime and portfolio planning in 2026, these investments are becoming more common. The explanation is simple: utility costs are not just support costs; they are production enablers. A lower-priced equipment package can become the most expensive option if it forces a boiler replacement or wastewater upgrade later. 2026 trends also point toward sustainability-driven utility investments. Plants are evaluating heat recovery, water reuse, variable-frequency drives, smart energy management, high-efficiency motors, and more targeted air handling. Policy pressure, ESG reporting, and utility rate volatility are pushing these decisions. In states with aggressive energy and water requirements, such as California, and in regions where wastewater charges are rising, efficient utility design can materially improve long-term project economics. Compliance costs are often treated as a permitting line item, but in reality they touch almost every part of a plant expansion. U.S. food and beverage projects may need to address FDA expectations, USDA requirements, state and local health rules, fire codes, electrical codes, building codes, stormwater rules, wastewater permits, and customer-driven standards such as SQF or BRC. For some facilities, OSHA-related changes also influence layout, guarding, access platforms, and egress. Compliance becomes more expensive when product risk is high or when an expansion introduces a new category. For example, a company moving from ambient dry production into refrigerated RTE foods or aseptic beverages may face entirely new sanitary zoning expectations. The same is true when a co-packer must satisfy multiple brand-owner audits. Documentation is another cost driver. Validation protocols, FAT/SAT requirements, instrument calibration records, P&IDs, utility drawings, sanitation plans, and operator training packages all take time and expertise. They are especially important in dairy, aseptic, retort, and beverage systems where process consistency must be proven, not assumed. The point of this table is that compliance spending should be viewed as risk prevention and market access, not overhead. A line that cannot pass customer audits or regulator scrutiny is not a finished capital asset. Manufacturers seeking a smoother path often prefer partners that understand both engineering and compliance translation. This matters when integrating thermal systems, sanitary piping, automation records, and owner documentation into one project package. You can see that project philosophy in the way food and beverage engineering services are structured around process design, execution oversight, and startup support rather than isolated design handoffs. Contingency is not padding. It is a disciplined response to uncertainty. A 2026 plant expansion estimate in the United States should include contingency that reflects the maturity of engineering, quality of site data, procurement strategy, and installation constraints. Early conceptual estimates typically need a higher reserve than late-stage engineered budgets. Retrofit work in active plants generally requires more protection than open-site construction because unknowns are higher. Risk reserve should address escalation, undocumented field conditions, owner changes, schedule compression, hidden utility conflicts, tie-in complexity, production losses during shutdowns, and freight volatility. It should also reflect local market conditions. Labor volatility in fast-growth Sun Belt markets, winter weather in the Upper Midwest, and permitting delays in dense metropolitan areas can all affect real cost. One useful way to structure reserve is to separate general contingency from targeted risk allowances. General contingency covers normal estimating uncertainty. Targeted allowances address known but undefined items such as slab remediation, utility reroutes, or extended startup support. That separation gives management better visibility and reduces confusion when changes occur. In buying terms, owners should be cautious of estimates that appear extremely precise too early. A number with no stated assumptions, exclusions, or risk treatment is not a better estimate; it is only a more dangerous one. Labor and installation costs vary enormously by region, schedule, facility condition, and trade intensity. Mechanical installation, sanitary piping, electrical work, controls integration, insulation, rigging, and demolition can make up a major share of the final budget. The most expensive installation is usually not the one with the highest hourly rate; it is the one with poor sequencing, repeated field changes, limited access, or insufficient shutdown planning. In active U.S. food plants, production continuity drives labor cost. Night work, weekend shutdowns, phased tie-ins, sanitation windows, confined work areas, and temporary bypass systems all increase execution complexity. Facilities operating in high-throughput markets such as Chicago, Central California, Texas, and the Southeast often cannot afford long outages, so labor plans must align with production schedules. Another key issue is trade availability. Some regions have strong food-grade contractors and fabricators; others rely on traveling specialists. Plants near major manufacturing corridors may have better access to labor, but also face higher demand competition. This is why local supplier strategy matters. The right estimate should identify which trades are expected to be local, which are traveling, and how supervision will be handled. Owners should also ask whether the project delivery approach supports field coordination. A fragmented bid model can create low initial numbers but high final costs. Design, procurement, trade management, and startup all interact. Many processors prefer integrated execution because it reduces handoff friction and makes cost responsibility clearer. That is where service capability matters. Disruptive Process Solutions operates as a full-scope engineering and project execution partner for food and beverage manufacturers across the United States and Canada, with a design-build-manage approach that connects process design, field construction management, and project oversight. For owners, that integrated method can improve budget reliability because constructability, sequencing, and procurement are addressed together rather than in separate silos. More on this can be found through the company background and its operating philosophy. Commissioning and validation are often underfunded because they occur late in the project and are less visible than steel or equipment. Yet this phase is where value is realized. Without structured startup, a plant can miss throughput targets, struggle with changeovers, overuse utilities, or fail food safety checks. In severe cases, a poorly commissioned line forces expensive rework after the contractor has left the site. Commissioning includes dry checks, loop checks, utility verification, bump tests, controls testing, CIP verification, water runs, product trials, operator training, performance tuning, punch list resolution, and documentation turnover. Validation may include thermal confirmation, sanitation protocols, recipe verification, instrument calibration, and quality record completion depending on the application. This factor becomes particularly important in aseptic, dairy, beverage, retort, and highly automated facilities. It is also critical for co-packers and multi-SKU plants where speed to commercial run rate directly affects customer retention and margin. A project that comes in under construction budget but misses three months of planned output is not actually a successful project. This table shows that startup is both a technical and commercial phase. Companies expanding in 2026 should treat commissioning as a protected workstream with dedicated budget, staffing, and schedule ownership. From a manufacturing capability perspective, DPS supports processors with both engineered systems and selected proprietary equipment such as storage and process tanks, CIP systems, marination tumblers, and cooking vessels. That matters because manufacturing capability can shorten coordination loops between design assumptions and physical equipment realities. It also helps align installation tolerances, utility interfaces, and startup planning. Disruptive Process Solutions supports food and beverage capital projects across North America with an emphasis on profitability, transparency, and practical execution. The company serves manufacturers in all 50 U.S. states and Canada, with experience across beverage, dairy, protein, prepared foods, sauces, aseptic processing, and related regulated applications. Its technology capabilities include process engineering, structural and mechanical coordination, plumbing and electrical integration, controls engineering, PLC programming, SCADA, and complete utility planning for systems such as CIP, steam, compressed air, refrigeration, water treatment, and wastewater. This is especially relevant for owners who want expansion budgets rooted in operating reality rather than generic square-foot assumptions. Its manufacturing capabilities include support for custom process equipment and integrated system packages that fit broader plant objectives. That creates an advantage when matching tanks, skids, utility tie-ins, and automation requirements to a defined production strategy. Companies evaluating expansion options can review process equipment capabilities to understand how physical systems fit into wider plant performance goals. Its service capabilities extend from feasibility and capital planning to owner’s representation, project engineering, construction management, installation, and startup coordination. For food and beverage operators, this full-lifecycle support is useful when schedule pressure is high or when multiple vendors, local trades, and compliance obligations must be managed under one program. Broader service information is available through engineering and project delivery services. DPS also works from a business-minded perspective. Instead of pushing unnecessary spend, the company focuses on profitable scope and long-term operating outcomes. That mindset is visible in real project examples where optimization and controls improvements can solve a bottleneck more effectively than adding expensive new hardware. Additional examples can be explored in these project case studies. For U.S. manufacturers planning 2026 expansions, that combination of technological capability, manufacturing support, and service integration can reduce risk during budgeting, procurement, construction, and startup. What is the first step in estimating a food plant expansion cost in the United States?Start with the process basis: target throughput, product mix, packaging formats, sanitation requirements, staffing model, and utility loads. Once those are clear, building and installation costs become much more accurate. Which factor causes the most cost overruns?Utilities and field conditions are common sources of overruns. Existing electrical service, wastewater limits, refrigeration capacity, and sanitary drainage are often underestimated in retrofit projects. Should I expand an existing plant or build a new one?It depends on product type, available utilities, logistics, and speed to market. Retrofit projects often save time and land cost, but hidden conditions can erode savings. Greenfield projects usually provide better layout control and future scalability. How much contingency should be included?That depends on estimate maturity and site certainty. Early concept budgets usually need a larger reserve than engineered estimates. Retrofit work in older facilities should generally carry higher risk allowance than open-site construction. How do product categories affect expansion cost?High-care, wet-process, refrigerated, aseptic, and protein applications usually cost more than simpler dry or ambient lines because they require stricter hygienic design, more utilities, heavier compliance, and more involved commissioning. Why are local references important in U.S. budgeting?Labor rates, permit timing, utility tariffs, seismic requirements, weather exposure, and freight costs vary by location. A project in California, Texas, Illinois, Georgia, or New Jersey will not budget the same way even if throughput targets are similar. What 2026 trends should owners plan for?Expect greater investment in automation, recipe control, digital visibility, utility efficiency, water stewardship, and compliance documentation. Policy pressure around sustainability and resilience will continue to influence equipment selection and utility design. How can I compare supplier options effectively?Compare total installed cost, lead time reliability, service support, controls compatibility, sanitation design, spare parts access, and startup support. The lowest purchase price rarely equals the lowest ownership cost. What industries benefit most from accurate expansion estimates?Protein processing, dairy, ready-to-drink beverages, sauces and dressings, prepared foods, aseptic manufacturing, co-packing, and plant-based foods all benefit because throughput, food safety, and schedule are tightly linked to profitability. What is the smartest buying advice for 2026?Buy around the business case, not just the equipment list. Prioritize process fit, utility realism, compliance readiness, and startup support. A profitable expansion is one that reaches stable production quickly and can scale without major rework. -
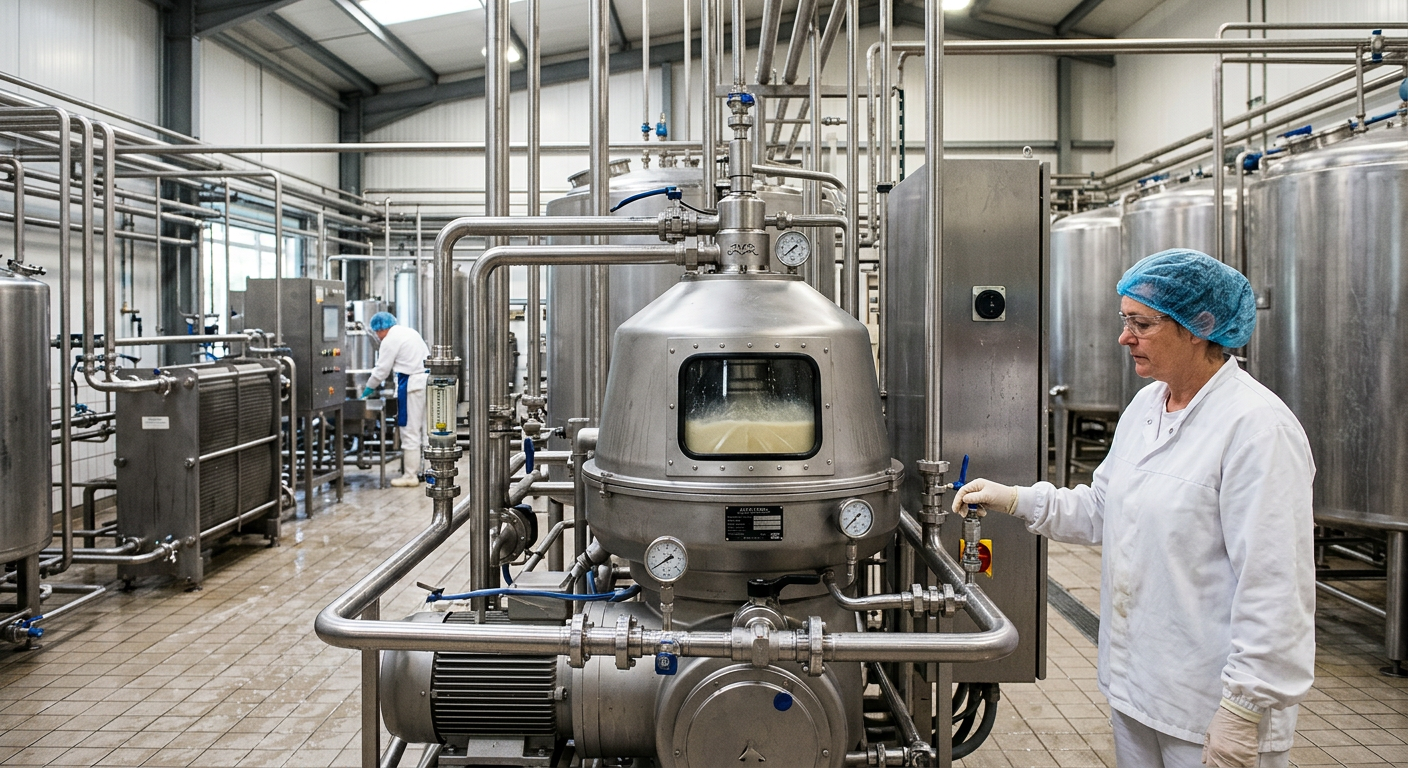
Sanitary Process Engineering for Food Plants
Food and beverage plants in the United States cannot treat sanitary process engineering as an optional upgrade. It is a core discipline that affects product safety, shelf life, audit readiness, throughput, labor efficiency, and long-term capital performance. Whether a facility runs dairy in Wisconsin, protein in Arkansas, sauces in Illinois, beverages in California, or aseptic products near the Port of Savannah, sanitary design choices directly influence contamination risk and operating cost. At the practical level, sanitary process engineering is the design of equipment, piping, utilities, controls, and cleaning systems so that product-contact surfaces can be reliably cleaned, inspected, drained, maintained, and validated. It applies to tanks, valves, pumps, fillers, heat exchangers, blenders, transfer lines, utility tie-ins, and CIP skids. It also governs how projects are planned and executed, especially when the owner wants to scale capacity without compromising compliance under FDA, USDA, SQF, or BRC expectations. For manufacturers evaluating new lines, retrofits, expansions, or plant relocations, the smartest buying decision is not simply choosing the cheapest equipment package. It is selecting a sanitary process strategy that supports the product category, cleaning regime, allergen profile, changeover frequency, and production economics of the site. That is why many operators turn to integrated engineering partners that can design, build, and manage complete systems instead of treating sanitation as an afterthought. In North America, this approach is especially valuable for multi-site manufacturers operating from hubs such as Chicago, Dallas, Charlotte, Fresno, Los Angeles, Houston, and Toronto. Sanitary process engineering is the engineering discipline that makes food, beverage, dairy, protein, and aseptic processing systems cleanable, drainable, inspectable, and compliant. In the United States, it is non-negotiable because poor sanitary design can lead to microbial harborage, allergen cross-contact, costly recalls, failed audits, reduced uptime, and shortened equipment life. A well-engineered sanitary system usually includes smooth and corrosion-resistant product-contact materials, orbital or high-quality sanitary welds, proper slopes for drainage, minimal dead legs, hygienic valves and fittings, validated cleaning cycles, and controls that document critical cleaning parameters. It also matches the cleaning method to the process. Some systems are best cleaned in place with automated CIP. Others require COP for removable parts, utensils, and hard-to-reach components. For buyers in the United States, the correct approach depends on product type. Dairy beverages, RTD products, sauces, cultured products, breweries, distilleries, protein marinades, plant-based foods, and aseptic lines all have different sanitary risks. The right engineering solution balances safety, code compliance, labor efficiency, water and chemical use, and capital return. The table above shows why sanitary engineering is not limited to one component. It is a system-level discipline. A line can have good tanks but still fail hygienically if valve clusters, branch connections, pump seals, or controls were poorly specified. Sanitary process engineering begins with a simple principle: if a surface touches product or influences product exposure, it must be designed so contamination does not accumulate and cleaning can be proven effective. That principle extends beyond process piping into pumps, instrumentation, floor interfaces, utility penetrations, conveyor transitions, and packaging line connections. In food plants across the United States, the consequences of poor sanitary design are expensive and immediate. A small dead end branch on a dairy line in upstate New York can become a persistent microbial niche. An improperly sloped line in a sauce facility near Atlanta can hold rinse water between runs. A rough weld on a protein marinade system in Omaha can trap organic residue and complicate allergen changeovers. In each case, the issue is not theoretical. It impacts product safety, labor hours, sanitation verification, and available production time. Sanitary design is also non-negotiable because the market expects more from manufacturers than basic compliance. Retailers, co-packers, and brand owners increasingly demand documented hygienic design, shorter changeovers, lower environmental footprint, and stronger traceability. That is especially true in fast-growth categories such as functional beverages, cultured dairy, ready meals, plant proteins, premium sauces, and shelf-stable foods. There is also a capital planning reason. When owners invest in process systems, they want more than code-compliant steel. They want profitable projects. That means the line should meet throughput goals, reduce cleaning downtime, fit future expansion, and support maintenance access without chronic rework. This business-minded view is one reason manufacturers seek firms that combine process engineering, project delivery, utility integration, and commissioning under one operating model rather than outsourcing each step in isolation. The growth trend above reflects a realistic direction in the United States market: more spending on hygienic retrofits, automation, CIP modernization, and sanitary utility infrastructure as labor pressure, compliance expectations, and food safety risk continue to rise. Sanitary process engineering in the United States sits at the intersection of recognized hygienic design principles and regulatory expectations. Three names come up repeatedly: EHEDG, 3-A Sanitary Standards, and FDA guidance. Each plays a different role, and understanding the distinction helps buyers make better equipment and design decisions. EHEDG, or the European Hygienic Engineering & Design Group, is widely respected for hygienic design principles and test methods. While rooted in Europe, EHEDG guidance influences global best practice, especially for cleanability, drainability, and equipment design philosophy. U.S. processors with multinational brands or export exposure often reference EHEDG concepts when building higher-performance hygienic systems. 3-A Sanitary Standards are highly relevant in the United States, especially in dairy and related sectors. They provide detailed sanitary criteria for equipment design, materials, fabrication, and cleanability. If a processor in Minnesota or California is selecting tanks, pumps, valves, fittings, or heat exchangers for a dairy application, 3-A compliance can materially reduce risk in specification and audit defense. FDA guidelines establish the regulatory baseline for food safety and current good manufacturing practice. In practical engineering terms, FDA expectations push plants toward cleanable design, suitable materials, contamination prevention, proper maintenance, and documented control of sanitation procedures. For meat and poultry plants, USDA expectations add another layer, while private schemes such as SQF and BRC often increase scrutiny around design detail and verification. The key lesson from this table is that no single framework covers everything. U.S. projects often need a blended approach. A sanitary design partner should be able to interpret these frameworks together and convert them into fabrication standards, utility specifications, piping details, and cleaning validation plans. Manufacturers looking for broader project support often start with an engineering partner’s company background and operating philosophy to confirm whether the team understands both food safety and capital efficiency. That matters when a project involves not just compliant steel, but business-critical schedule and startup performance. Cleaning in place is one of the most important tools in sanitary process engineering. A properly designed CIP system cleans internal product-contact surfaces without taking the process line apart. This reduces labor, shortens downtime, improves repeatability, and supports automated documentation. In beverage plants, dairy operations, RTD facilities, sauce kitchens, aseptic systems, and many liquid processing environments, CIP is often the preferred strategy. Good CIP design starts with the process itself. Engineers must understand product viscosity, sugar load, protein content, fat behavior, thermal history, allergen profile, and run length. A syrup room near Los Angeles, a yogurt line in Idaho, and a marinade system in Texas will not require the same velocities, circuits, chemicals, or rinse strategy. Core design factors include turbulent flow, adequate return, temperature control, chemical concentration, contact time, spray coverage, drainability, and reliable separation between product and cleaning media. Instrumentation should measure conductivity, temperature, flow, and sometimes turbidity. Controls should document cycle completion and alarm deviations. Tank design, pump sizing, valve arrangement, and line routing must all support full wetting and full evacuation. Single-use, reuse, and hybrid CIP systems each have a place. Reuse systems can reduce water and chemical cost in larger plants, while single-use systems may simplify risk management in certain allergen or product-switch environments. The correct answer depends on production economics, sustainability goals, and sanitation risk tolerance. These factors show why CIP is not just a skid purchase. It is a systems integration problem involving process, controls, utilities, piping, instrumentation, and operator workflow. A high-performing CIP installation typically benefits from an engineering team that can also address steam, hot water, compressed air, cooling, and automation interfaces under a unified scope. Manufacturers can review integrated process engineering and project delivery services when considering this kind of work. By 2026, expect CIP systems in the United States to use more data-driven optimization. Conductivity trending, recipe management, digital verification, water reuse logic, and energy reporting will increasingly move from premium features to expected project deliverables, particularly in larger multi-line food and beverage plants. Sanitary piping design is where many projects succeed or fail. Even expensive equipment can underperform hygienically if the line routing, welding, branch geometry, or support strategy is poor. Product-contact piping should be smooth, drainable, accessible, and free from unnecessary pockets, abrupt transitions, or uncleanable branch connections. Weld quality is critical. In hygienic service, welds must avoid undercut, burn-through, pits, cracks, oxidation, and crevice formation. Orbital welding is often preferred for consistency on stainless tubing, especially where repeatability and documentation matter. Surface finish also matters because rougher surfaces hold residue more readily and are harder to clean. The acceptable finish depends on the product and risk profile, but the design should always align with sanitary performance, not just fabrication convenience. Dead legs are among the most common design flaws in food plants. A dead leg is a branch or pocket where product or cleaning solution stagnates because flow is inadequate. These areas are especially dangerous in dairy, aseptic, low-acid, and extended-run applications. The best practice is to eliminate dead legs during design rather than trying to sanitize around them later. Routing also influences maintenance and safety. Piping should allow proper support, expansion management, inspection, and washdown access. In busy retrofit environments such as legacy plants in New Jersey, Ohio, or the Central Valley of California, engineers must often redesign around existing structural and utility constraints without compromising hygienic principles. The demand comparison above reflects how different sectors prioritize hygienic piping investments. Dairy, beverages, and aseptic applications usually rank highest because they combine frequent cleaning, strict microbiological control, and complex fluid handling. This is also where case experience matters. A capable engineering partner understands how sanitary details change across product categories and building types. Manufacturers assessing retrofit examples can review selected project case studies and outcomes to see how sanitary and operational constraints were balanced in real facilities. Material selection is a technical and economic decision. In many hygienic applications, 316L stainless steel is preferred because it offers strong corrosion resistance, good cleanability, durability, and compatibility with many food products and cleaning chemicals. It is especially useful where chloride exposure, acidic products, aggressive wash chemistry, or long service life justify the premium over lower-grade options. That said, no single material is correct for every component. Food-grade polymers are widely used in gaskets, seats, hoses, pump parts, seals, scraper blades, sight glasses, and specialized wear components. The key is choosing materials that are chemically compatible, temperature appropriate, resistant to swelling or cracking, and suitable for the product and sanitation regime. For example, a high-acid juice line in Florida may stress elastomers differently than a hot-fill sauce line in Missouri or a cultured dairy operation in Colorado. Steam exposure, CIP chemical strength, and mechanical abrasion must all be considered. Poor gasket selection is a classic hidden failure point in sanitary systems. Material choice also affects lifecycle cost. A lower upfront material cost can produce higher downtime, more replacement parts, and more frequent contamination investigations. Buyers should ask not only what material is specified, but why it was chosen for that service, how it performs under sanitation chemistry, and how easy it is to source replacement components locally in the United States. The best specifications usually come from teams that understand both engineering and fabrication. For manufacturers comparing custom equipment packages, reviewing available process equipment capabilities can help determine whether a supplier understands sanitary construction, CIP integration, and material selection at the manufacturing level. COP, or clean-out-of-place, remains an essential part of many sanitary strategies. While CIP is ideal for fixed process equipment and closed piping systems, COP is often required for removable components such as fittings, utensils, nozzles, screens, parts baskets, and change parts. In some applications, a mixed sanitation model is the most effective and economical option. The decision between COP and CIP should be based on equipment geometry, production frequency, labor availability, allergen control, and validation needs. A beverage blending line with permanent tanks and manifolds may favor CIP-heavy design. A prepared foods plant with frequent product changes, removable contact tools, and manual assemblies may need stronger COP infrastructure. Buyers should also consider workforce realities. In regions where sanitation labor is harder to recruit and retain, such as high-cost metro markets, more automation in CIP can significantly improve consistency. In smaller plants with less automation budget and simpler equipment, a structured COP program may still perform well if the facility is designed for access, disassembly, and verification. This comparison shows that the right answer is usually process-specific. In many U.S. plants, the most robust sanitary program combines automated CIP for fixed assets with properly designed COP stations for removable items. That hybrid approach often delivers the best mix of control, labor efficiency, and validation confidence. The trend shift above reflects increasing investment in automation, data logging, and utility optimization. Water cost, labor pressure, sustainability goals, and audit discipline are all pushing U.S. facilities toward more sophisticated CIP design heading into 2026. Many sanitation problems originate in design decisions made long before startup. The most common flaws include dead legs, non-drainable piping, poor weld quality, inaccessible valve arrangements, flat-top surfaces that hold water, poorly selected elastomers, weak hygienic zoning, and CIP circuits that were never actually flow-tested under real conditions. Another frequent issue is disconnected project delivery. One contractor installs the piping, another the controls, another the utilities, and no one fully owns hygienic performance. The result is a line that technically runs but is difficult to clean, hard to maintain, and expensive to verify. This is where integrated project leadership matters. Disruptive Process Solutions, based in Cary, North Carolina with a West Coast presence in Lake Forest, California, is known in the market for combining process engineering, installation, and execution oversight within an end-to-end delivery model. From a service capability perspective, that matters because sanitary performance depends on design decisions, field installation quality, startup discipline, and accountability across the project lifecycle, not just on a drawing package. On the technology side, manufacturers increasingly need sanitary systems integrated with PLC programming, automation, SCADA, recipe control, utilities, and commissioning. When a system includes blending, pasteurization, fermentation, carbonation, aseptic transfer, retort support, or protein processing, sanitary reliability depends on that broader technical integration. On the manufacturing side, custom tanks, CIP skids, vessels, and related process equipment can be optimized when the same team understands both fabrication and plant-level execution. Avoiding these flaws requires early interdisciplinary review involving process, sanitation, operations, maintenance, quality, and controls. In retrofit projects, laser-accurate field verification and startup testing are equally important because many hygienic problems appear only after the line is wet and under production conditions. Validation and verification are the proof that sanitary design works in the real world. Validation establishes that the cleaning process, when properly executed, is capable of delivering the required sanitary outcome. Verification confirms on an ongoing basis that the process continues to perform as intended. For CIP systems, validation may include riboflavin coverage tests, flow confirmation, conductivity checks, temperature mapping, swab studies, allergen testing, ATP trends, microbiological results, and review of complete cycle recipes. For COP programs, it may include visual inspection standards, soak parameters, chemistry control, time requirements, and post-clean verification steps. Documentation is critical. U.S. manufacturers increasingly need proof not just that cleaning happened, but that it happened under validated conditions and can be traced during customer audits, regulatory review, and root-cause investigations. Digital records from PLCs and SCADA are becoming more important, especially in larger beverage, dairy, and aseptic plants. Validation also supports smarter capital planning. If a manufacturer can reduce over-cleaning without increasing risk, it can save water, energy, chemicals, labor, and production time. This is one area where engineering, controls, and operational discipline create measurable profit impact. The comparison above illustrates a common buying lesson in the United States: the more complex the sanitary project, the more value there is in providers that can unify process design, utilities, fabrication understanding, controls, installation, and commissioning rather than delivering only one piece of the scope. As sustainability and compliance expectations evolve toward 2026, validation will likely expand beyond cleanability alone. Plants will increasingly track water intensity, chemical consumption per cycle, energy use, and cleaning time as part of broader ESG and profitability metrics. The best sanitary systems will therefore be not only safe and compliant, but measurable and optimizable. What industries need sanitary process engineering most?Dairy, beverage, protein, prepared foods, sauces, plant-based products, cultured products, aseptic processing, brewing, distilling, and co-packing all depend heavily on sanitary engineering. The exact design standard changes by product risk and cleaning regime. Is sanitary engineering only for new plants?No. Many of the highest-value projects in the United States are retrofits in existing facilities where drainage, piping, CIP circuits, utility systems, and hygienic zoning need to be upgraded without stopping the business for long periods. When should a plant choose 316L stainless steel?316L is commonly chosen when corrosion resistance, chemical exposure, cleanability, and long service life justify the added cost. It is especially common in demanding wet-clean, acidic, chloride-exposed, and high-hygiene applications. What is the difference between hygienic design and sanitation procedures?Hygienic design is the physical engineering of equipment and systems so they can be cleaned effectively. Sanitation procedures are the operating methods used to clean them. Good procedures cannot fully overcome poor design. Can a plant use both CIP and COP?Yes. Many facilities should. CIP is ideal for fixed piping and closed vessels, while COP is important for removable parts and smaller assemblies. A hybrid strategy often delivers the best result. How do buyers evaluate a sanitary project partner?Look for proven food and beverage experience, understanding of FDA and relevant industry standards, strong process and utility engineering, controls integration, fabrication knowledge, field execution capability, and transparent project management. A partner should also understand profitability, not just installation. What should be included in a sanitary system quote?Scope should cover process design basis, materials, weld and finish requirements, instrument list, CIP or COP philosophy, utility demand, controls integration, FAT or SAT expectations, validation approach, startup support, and documentation deliverables. Why does local market knowledge matter in the United States?Project success depends on local labor conditions, jurisdictional requirements, utility infrastructure, and logistics. Plants near Charlotte, Houston, Chicago, Seattle, Los Angeles, or the Port of Newark may face very different construction and sourcing realities. What makes an engineering partner valuable beyond design?A strong partner reduces rework, catches hidden bottlenecks, aligns sanitation with throughput, and helps owners invest capital where it improves long-term plant economics. That is especially useful for growing manufacturers that need smart scaling instead of fragmented contracting. In short, sanitary process engineering is one of the clearest places where food safety, operational uptime, and capital strategy meet. For U.S. manufacturers, the best results come from designing hygienic performance into the system from day one, validating it before production pressure builds, and choosing a partner capable of integrating engineering, fabrication insight, installation, and startup execution into one accountable process. -
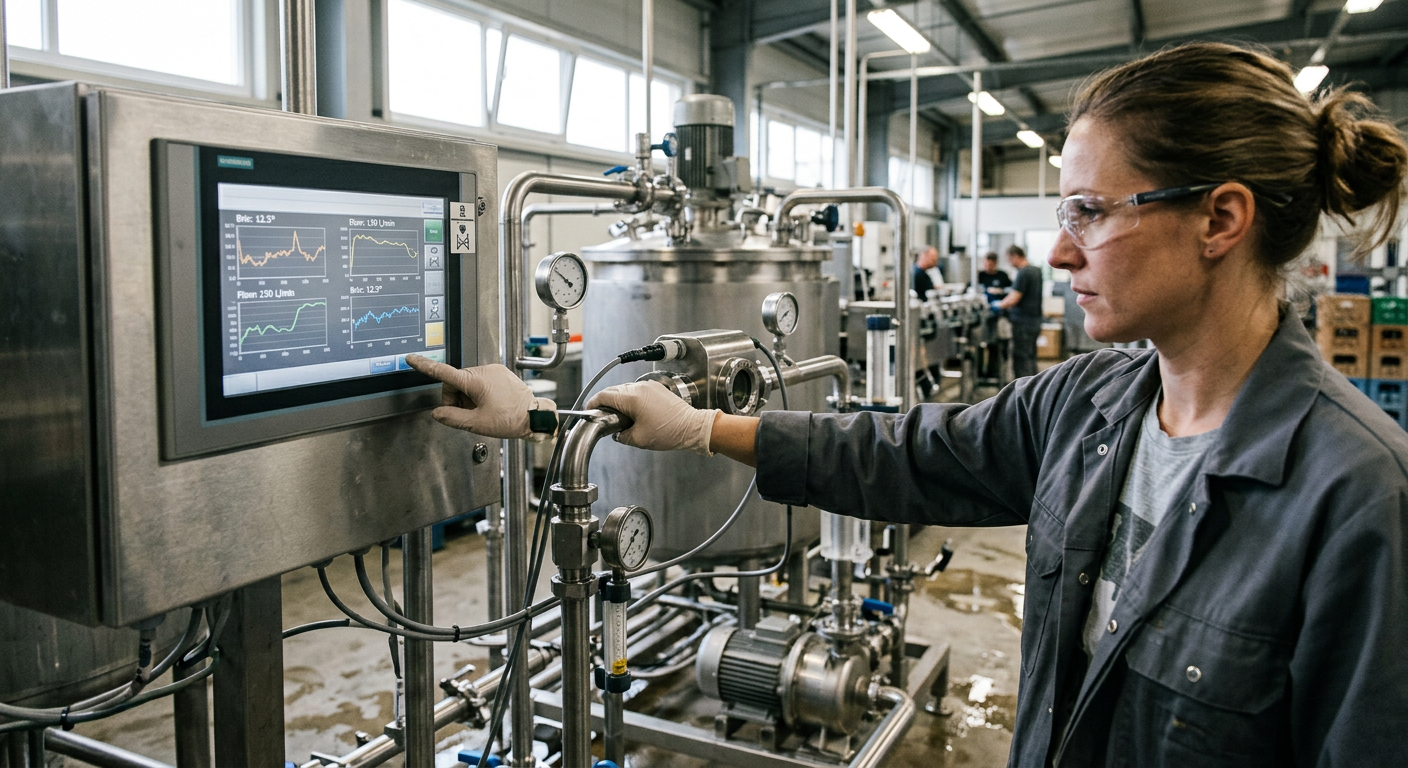
Venture Capital Food Manufacturing Funding: A Complete Guide
Raising venture capital for a food manufacturing business in the United States is possible, but it is rarely as simple as pitching a strong recipe or a fast-growing consumer brand. Investors want proof that a company can scale production, protect margins, manage food safety, secure distribution, and build defensible operations. In practice, the most fundable businesses combine product-market fit with disciplined manufacturing readiness. That means founders need to understand not only venture capital expectations, but also plant design, throughput, compliance, automation, co-packing strategy, and capital planning. Across the U.S., major food hubs such as Chicago, Los Angeles, Dallas-Fort Worth, Fresno, Atlanta, the Research Triangle, and the New Jersey corridor continue to attract attention because they connect manufacturing capacity with logistics, labor, and retail access. Port-linked regions such as Long Beach, Oakland, Savannah, Houston, and Newark remain important for imported ingredients, packaging components, and export-ready finished goods. For investors, these location advantages often affect timelines, capex requirements, and the economics of national scale. Venture capital funding for food manufacturing in the United States is most available for startups that can demonstrate fast category growth, a credible path to gross margin expansion, scalable production, strong food safety systems, and differentiated market positioning. Seed rounds often support pilot production, early commercialization, and brand validation. Series A and B rounds usually fund plant expansion, automation, geographic rollout, equipment installation, and working capital for larger customers. VCs evaluate more than the product itself: they study contribution margin, manufacturing risk, cost of goods sold, capacity bottlenecks, channel mix, repeat purchase behavior, and whether the team can execute in a tightly regulated operating environment. For founders, the best funding outcomes usually come when capital strategy and manufacturing strategy are developed together. A startup that raises too early without operational readiness may burn cash in delays, change orders, co-packer failures, and missed retail launches. A startup that prepares capacity planning, technical diligence materials, and a realistic scale-up roadmap can negotiate from a stronger position. This is especially true in complex categories such as protein, dairy, fermented beverages, aseptic products, sauces, functional drinks, shelf-stable meals, and plant-based foods. The table above shows the basic investor mindset. In U.S. foodtech, capital is available, but it follows evidence. Investors want to see that operational complexity will not destroy market opportunity. The U.S. funding landscape for food manufacturing has changed over the past several years. Capital remains active, but investor behavior is more selective than during the most aggressive growth years. Funds are still backing food and beverage platforms, ingredient innovation, supply chain technology, fermentation, cleaner-label manufacturing, and functional nutrition, but they now demand stronger unit economics and clearer paths to profitability. In practical terms, companies in categories such as high-protein snacks, better-for-you beverages, children’s nutrition, shelf-stable convenience foods, premium sauces, dairy alternatives, and precision-processing platforms can still attract venture interest. However, investors increasingly distinguish between “brand heat” and “manufacturing durability.” A company with viral demand but unstable production is often viewed as higher risk than a company with slower but cleaner operational scaling. Geography also plays a role. The Midwest remains attractive for central distribution, ingredient access, and comparatively efficient industrial costs. California continues to lead in food innovation, premium branding, and investor concentration, especially around Los Angeles, the Bay Area, and Orange County. Texas gains interest for business climate, warehousing, and national distribution reach through Dallas, Houston, and San Antonio. North Carolina, Tennessee, and Georgia are increasingly relevant because of expanding food and beverage infrastructure, workforce availability, and proximity to Southeast consumption corridors. The chart illustrates a realistic pattern: a strong early period, a correction, and then a more disciplined recovery heading into 2026. The emerging pattern suggests that investors are not leaving the sector; they are simply underwriting risk more carefully. Founders should treat the landscape as a strategic map. The right funding partner often depends on product category, plant strategy, capital intensity, and route to market. A fermented beverage business launching through West Coast retail does not look the same to investors as a protein processor building USDA-compliant capacity in the Midwest. Funding stages in food manufacturing generally follow broader venture patterns, but round sizing is heavily influenced by capex, inventory cycles, and manufacturing complexity. Unlike software businesses, food companies frequently need cash for packaging inventory, quality systems, process engineering, line validation, and sometimes utility upgrades or tenant improvements before revenue can scale efficiently. At pre-seed, founders usually raise enough to validate demand, refine formulation, test packaging, secure initial production, and build a launch-ready commercial plan. Seed rounds often support wider retail rollout, co-packer qualification, key hires, and inventory financing. By Series A, investors often expect stronger repeat demand, retailer or distributor proof points, supply chain maturity, and a clear decision about whether the business will remain asset-light or move toward dedicated production capacity. This stage view matters because the use of funds must fit the story. If a founder raises a Series A but still lacks stable yields or realistic production planning, investors may see a governance problem. If a founder asks for growth capital but still depends on a single fragile co-packer, the capital request will often look premature. In many food categories, a hybrid capital stack also becomes relevant. Venture capital may be paired with equipment financing, working capital facilities, state incentives, or strategic manufacturing partnerships. This is common in beverage filling, dairy processing, cold-chain products, and high-volume shelf-stable lines where utility and line setup costs can rise quickly. When venture firms evaluate food manufacturing startups, they look well beyond sales momentum. They test whether the business can convert demand into scalable, profitable production. The first layer is commercial: category growth, repeat purchases, velocity by store, gross-to-net dynamics, and channel concentration. The second layer is operational: COGS, fill rates, waste, labor efficiency, throughput, shelf life, and compliance systems. The third layer is strategic: whether the company’s process, sourcing, formulation, packaging, or manufacturing model creates a long-term advantage. Investors also closely study the founding team. In food manufacturing, execution often requires a combination of brand instincts, technical operations knowledge, supply chain discipline, and financial control. A charismatic founder without plant understanding may struggle in diligence unless supported by strong operators, engineers, or experienced manufacturing advisors. The demand pattern above reflects where investor attention often clusters: categories with recurring consumption, premium pricing potential, and room for operational leverage. For many startups, this is the hardest lesson: investors do not only fund what the consumer sees on the shelf. They fund the invisible system behind it. That includes line design, utility planning, sanitation logic, quality assurance, automation, and project execution. Founders that cannot explain these areas often lose credibility, especially in categories involving aseptic processing, retort, fermentation, dairy, meat, or high-acid products. The U.S. foodtech investor universe includes broad venture firms, category-specific funds, strategic investors, climate-oriented funds, and growth equity groups. Some focus on consumer brands. Others back ingredients, automation, fermentation, food safety platforms, sustainable packaging, or enabling infrastructure. Because of this, founders should avoid using a generic list and instead build a tiered target map. A useful approach is to separate funds into four groups: consumer food and beverage VCs, foodtech platform investors, sustainability and climate funds, and strategic or corporate venture arms. Each group has a different view of timelines, capital needs, and risk. For example, a fund that prefers asset-light consumer businesses may hesitate on a capex-heavy manufacturing plan. A strategic investor may value manufacturing depth, but seek rights or influence that alter future fundraising flexibility. Founders should also study whether a fund has experience with refrigerated products, perishability, retailer chargebacks, ingredient volatility, or food safety events. Capital alone is not enough. The best investor partners understand what happens when a line underperforms, a filler slows down, a CIP cycle affects uptime, or a packaging format causes unexpected spoilage or freight penalties. In cities like New York, San Francisco, Los Angeles, Austin, Chicago, and Boston, investor access is often easier, but competition for attention is high. In secondary markets, founders may receive fewer meetings yet stand out more if the operational story is strong. Either way, alignment beats prestige. A smaller but category-fluent fund can be more valuable than a famous generalist with little manufacturing understanding. Due diligence in food manufacturing is broad and practical. Investors review financial statements, sales trends, and customer concentration, but they also inspect process reliability, manufacturing SOPs, sourcing contracts, certifications, quality systems, and scaling assumptions. This is where many founders discover that their internal documents are not investment-ready. A well-prepared data room should include monthly financials, margin by SKU, sales by channel, cap table, customer contracts, manufacturing agreements, quality and food safety documentation, insurance, regulatory status, equipment list, production capacities, and a detailed use-of-funds model. If the company is considering its own facility, investors also want to understand utility loads, layout assumptions, labor plan, commissioning timelines, and contingency budgets. Founders with complex products should prepare a manufacturing narrative: what the process is, where bottlenecks exist, what assumptions drive throughput, and what changes are required to scale. This is especially important for categories involving thermal processing, carbonation, distillation, cultured products, proteins, emulsions, aseptic systems, and automated batching. The trend shown here reflects a real shift in diligence culture: investors increasingly reward operational discipline and credible profitability, not just topline excitement. For many companies, the most valuable preparation step is bringing in experienced manufacturing and project execution support before the raise. Clean diligence is not only about documents. It is about answering investor questions with confidence and specifics. Valuation in food manufacturing is influenced by growth rate, margin profile, channel quality, category attractiveness, and operational risk. Early-stage deals may still be priced on future potential, but the market increasingly anchors around evidence. A high-growth brand with poor margins or unstable production will often struggle to justify premium pricing. Conversely, a business with disciplined gross margin expansion, healthy reorder behavior, and a credible scale plan may defend stronger terms even if it is growing slightly slower. Common valuation references include revenue multiple ranges, gross margin quality, contribution margin trajectory, EBITDA potential for later-stage companies, and strategic value to future acquirers. Terms matter just as much as headline valuation. Founders should pay close attention to liquidation preferences, board composition, protective provisions, participation rights, pay-to-play language, and pro rata rights. Negotiation is strongest when founders can prove how capital converts into measurable operational outcomes: more cases per hour, reduced labor per unit, lower waste, expanded shelf life, improved fill rates, or greater channel profitability. Investors respond well when capex is translated into business results rather than engineering jargon alone. This comparison highlights the core tradeoff many investors and founders debate. Greater production control can improve margins and defensibility, but it typically raises capital demands and execution complexity. As a practical rule, founders should negotiate from clarity, not optimism. A realistic model that includes commissioning delays, freight variability, and raw material shifts will do more for credibility than a perfect spreadsheet that breaks under basic questioning. After funding closes, the real work begins. The biggest mistake food manufacturing startups make is assuming that capital itself solves operating complexity. In reality, growth magnifies whatever systems already exist. If plant scheduling is weak, larger orders create more disruption. If quality records are inconsistent, more SKUs create more risk. If utilities are undersized, additional lines intensify downtime and waste. Post-investment execution should focus on five areas: capacity planning, margin management, quality systems, leadership depth, and capital deployment discipline. Capacity planning should include realistic ramp curves, not only nameplate targets. Margin management should track labor efficiency, ingredient variance, freight, packaging losses, and trade spend. Quality systems should evolve with scale, especially if the company moves from regional to national retail. Leadership should expand to include operations, supply chain, finance, and quality specialists. Capital deployment should be sequenced around bottleneck removal, not vanity expansion. Future trends through 2026 will shape how investors and operators think about scaling. Automation and SCADA visibility will become more important as labor pressures continue. Sustainability metrics, water use, energy management, and waste reduction will matter more in both procurement and fundraising conversations. Policy trends may strengthen traceability, labeling scrutiny, and domestic resilience expectations. As a result, startups that can link profitability with operational efficiency and compliance readiness will likely win more support. Applications vary by segment. Beverage companies may prioritize blending systems, carbonation, HTST or tunnel pasteurization, bright tanks, and water treatment. Protein and prepared food companies may focus on grinding, forming, cooking, slicing, marinating, refrigerated handling, or retort. Dairy and aseptic businesses may require more advanced sterilization, filling, clean utility design, and controlled environments. Buying decisions therefore depend on product type, shelf-life goals, target channels, and whether the company plans to stay with co-packers or invest in dedicated assets. Case studies often show that the most profitable growth does not come from the largest spend, but from the smartest intervention. In many U.S. facilities, throughput gains come from controls optimization, utility balancing, layout improvements, better CIP logic, or line integration rather than a full greenfield expansion. Investors favor teams that understand this. They want capital efficiency, not just ambition. For food and beverage companies navigating expansion, fundraising readiness is stronger when the manufacturing plan is credible. That is where operational partners matter. Disruptive Process Solutions supports manufacturers across the United States and Canada with an approach centered on profitable capital execution rather than generic project delivery. From a technological capabilities perspective, DPS works across structural, mechanical, plumbing, electrical, process, and controls engineering, including PLC programming, automation, and SCADA integration. That depth is especially relevant for investor-backed businesses that must demonstrate not only product demand but also process control. The company’s experience spans fermentation systems, distillation setups, pasteurization methods such as HTST, UHT, tunnel and flash systems, retort applications, HPP-related integration planning, aseptic processing, blending and batching, in-line Brix monitoring, filtration, clarification, and water treatment systems including reverse osmosis and disinfection. For a founder preparing diligence, this kind of technical fluency can help translate production needs into an investor-understandable capex roadmap. From a manufacturing capabilities perspective, DPS supports both beverage and food operations across a broad range of applications. On the beverage side, this includes brewing, spirits, wine, kombucha, ready-to-drink products, soft drinks, juices, functional beverages, dairy beverages, and aseptic lines. On the food side, the company supports protein processing, prepared foods, sauces, dressings, dairy, shelf-stable systems, aseptic environments, and plant-based processing. Its expertise also extends to mixing, forming, cooking, smoking, tumbling, slicing, portioning, emulsification, dairy systems, retort and canning, utility infrastructure, and controlled processing environments. Businesses exploring new capacity can review related project examples on the project case studies page to understand how scale-up planning connects to real facility execution. From a service capabilities perspective, DPS operates through an end-to-end model that covers process engineering and design, capital planning, feasibility studies, owner’s representation, project and program management, general contracting functions, proprietary equipment supply, physical installation, and system integration. For founders deciding whether to use a co-packer, retrofit a facility, or build in phases, this integrated support can improve both decision quality and speed. The company also offers its own equipment solutions, which can be explored through its equipment offerings, while broader planning and execution support is outlined across its food and beverage engineering services. What makes this relevant in the venture context is that investors increasingly ask hard questions about how a manufacturing startup will actually scale. A founder who can show not only a growth model, but also a disciplined design-build-manage strategy, a clear utility plan, compliance awareness, and a bottleneck-focused expansion path is in a much stronger position. In categories where delays can derail retail relationships or burn runway, execution credibility can materially affect funding outcomes. What kinds of food manufacturing startups are most attractive to U.S. venture capital investors?Startups in functional beverages, better-for-you packaged foods, protein-forward products, efficient plant-based categories, premium sauces, and scalable prepared foods often attract interest. The strongest candidates combine category momentum with credible manufacturing economics. Can a company raise VC before owning a plant?Yes. Many startups raise venture capital while using co-packers or pilot facilities. However, investors expect a thoughtful plan for capacity, quality control, and margin improvement over time. Do investors prefer asset-light or owned manufacturing models?It depends on the category. Asset-light models reduce capex and may speed launch, but owned or dedicated production can offer more control, margin upside, and defensibility. Investors usually prefer whichever model best matches the company’s stage and operating risk. How important is food safety in fundraising?It is critical. Weak quality systems, unclear compliance processes, or poor documentation can reduce valuation or stop a deal entirely. In food manufacturing, regulatory and recall risks directly affect investor confidence. What should founders prepare before approaching foodtech VCs?A solid pitch deck, clean financials, SKU-level margin logic, customer proof, production data, quality documents, sourcing plans, and a realistic capital use model. For capex-heavy businesses, facility and equipment assumptions should also be prepared. How long does food manufacturing VC diligence usually take?It often takes longer than consumer internet deals because investors review commercial traction and operational details. A prepared company may complete the process in a few months, while a less organized company can stretch much longer. Are there local advantages to building in certain U.S. markets?Yes. Chicago offers central distribution, California offers innovation and port access, Texas offers logistics and industrial growth, and the Southeast offers expanding manufacturing infrastructure. Choice of market can affect labor, freight, utilities, and investor perception. What trends will matter most in 2026?Automation, sustainability reporting, traceability, domestic supply resilience, efficient water and energy use, and tighter profitability discipline are likely to shape both operations and fundraising conversations. In the U.S. market, winning venture capital for food manufacturing is no longer about telling the biggest growth story. It is about proving that commercial demand, plant strategy, compliance readiness, and capital efficiency can work together. Founders that approach fundraising with manufacturing maturity will stand out in a more selective but still opportunity-rich market. -
Food Plant ROI Analysis Framework: 5 Models Every CFO Should Know
Capital spending in food and beverage manufacturing is rarely just about buying equipment. In the United States, every project decision touches throughput, labor, utilities, food safety, regulatory compliance, uptime, and long-term competitiveness. A new cook line in Chicago, an aseptic expansion near Fresno, a beverage utility upgrade in Dallas, or a protein debottlenecking project tied to cold-chain flows through Kansas City all require one central question: will the investment create measurable business value? That is where food plant ROI analysis matters. A strong return analysis helps finance leaders, plant managers, operations teams, and ownership groups compare competing projects using a common language. Instead of relying on intuition alone, they can test scenarios, rank capital uses, and align spending with strategic goals such as output growth, margin improvement, risk reduction, sustainability, or network resiliency. In practical terms, food plant ROI analysis should reflect real plant conditions across the U.S. market: labor shortages in major manufacturing corridors, utility cost volatility, stricter customer expectations, retailer pressure on service levels, and compliance demands from FDA, USDA, SQF, and BRC programs. For food processors and beverage manufacturers, ROI is not only about speed of payback. It is also about whether a project supports growth without creating hidden costs later. Food plant ROI analysis is a structured way to measure whether a capital project in a U.S. food or beverage facility will generate enough financial and operational value to justify the spend. The five most useful models are simple payback period, net present value, internal rate of return, total cost of ownership, and risk-adjusted return metrics. CFOs should use all five together because each model answers a different question: how fast the investment returns cash, how much total value it creates, how efficient the return is, what the project really costs over time, and how likely the projected outcome is under real operating risks. For example, a plant may see a packaging automation system with a fast payback but weak long-term flexibility, while a utilities modernization project may look slower at first yet produce stronger NPV over ten years through energy savings, uptime improvement, and reduced maintenance. The best decisions happen when finance and operations compare both direct and indirect returns, then sequence projects according to strategic need. The table above shows why no single metric is enough. A U.S. manufacturer operating in Los Angeles, Houston, Atlanta, or the Midwest distribution belt will make stronger capital choices when these models are used as a combined decision framework rather than as isolated formulas. Food plant ROI analysis is the evaluation of expected financial return from investments in processing, packaging, utilities, automation, infrastructure, and compliance-related projects. In a food plant, returns are often generated from six major areas: increased throughput, lower labor cost, lower waste, lower utility use, reduced downtime, and lower quality or compliance risk. Unlike ROI in many office-based industries, plant ROI has to reflect physical manufacturing reality. A line filler may promise output gains, but if upstream blending, refrigeration, CIP, compressed air, or case packing cannot support the rate, the forecast fails. A smokehouse upgrade may improve cook cycle time, but if sanitation windows tighten or labor availability shifts, the gain may not fully materialize. That is why ROI analysis in food manufacturing should connect engineering assumptions to commercial assumptions. Across the United States, common project categories include: In many cases, the best ROI comes not from the largest spend, but from finding the real bottleneck. A plant in North Carolina or California may assume it needs new equipment when the root issue is control logic, layout flow, sanitation scheduling, or CIP capacity. That is why engineering-led capital planning creates better returns than equipment buying in isolation. Manufacturers evaluating these decisions often benefit from combining feasibility, engineering, and execution planning. Companies looking for that broader approach can review food and beverage engineering services that tie plant design to financial outcomes rather than treating projects as isolated purchases. The chart below illustrates a realistic capital investment growth trend for food and beverage plant modernization in the United States. This line chart shows why ROI discipline is increasingly important. As U.S. manufacturers raise capital spending, the quality of project selection becomes more valuable than the amount spent. The simple payback period measures how long it takes for a project’s annual net cash benefit to recover the original investment. It is often the first filter used by CFOs and plant leaders because it is straightforward and practical. Formula: Payback Period = Initial Investment / Annual Net Cash Savings or Contribution If a packaging automation project costs $1.2 million and is expected to produce $400,000 in annual labor, waste, and uptime benefits, the payback period is three years. In U.S. food manufacturing, many companies prefer a payback threshold of two to four years depending on risk, market growth, and access to capital. Simple payback is especially helpful when screening projects such as conveyor upgrades, palletizing systems, small fillers, controls improvements, wastewater improvements, or energy efficiency measures. It works well when the project produces stable and easy-to-verify savings. Still, payback has limits. It ignores cash flows after the payback date, does not account for inflation or discount rates, and may unfairly reject strategic projects that create larger long-term value. For example, a new aseptic line near the Port of Los Angeles may have a longer payback because of facility modifications, but if it opens a premium market category and strengthens retailer relationships, payback alone understates its value. The table shows why payback is useful for first-pass screening. It is also a good model for buying advice when reviewing local suppliers, integrators, and OEM proposals. However, before approval, decision-makers should validate whether the quoted savings include installation downtime, training, commissioning, spare parts, and maintenance overhead. Net present value, or NPV, is one of the strongest methods for food plant capital decisions because it converts future cash flows into today’s dollars. It answers a more important question than payback: how much value does the project create after accounting for the cost of capital? Formula: NPV = Present Value of Future Cash Flows – Initial Investment For a U.S. processor, the discount rate may reflect weighted average cost of capital, financing conditions, and project risk. When NPV is positive, the project is expected to create value beyond the required return threshold. A higher positive NPV generally means a better investment, all else equal. NPV is ideal for large projects such as beverage utility systems, high-volume cooking lines, fermentation expansions, refrigeration plants, or multi-line integration work. These projects often involve uneven cash flows, startup ramp periods, tax effects, and longer lifecycles that simple payback cannot capture well. Consider a beverage plant near Atlanta deciding between two syrup room designs. The lower-cost option may have a smaller upfront spend, but the higher-efficiency design could save labor, water, cleaning time, and product loss for ten years. NPV makes those future operating advantages visible. NPV also helps compare projects in different industries and applications, such as dairy homogenization upgrades, protein marination systems, hot-fill line additions, retort expansions, and plant-protein hydration systems. This makes it especially helpful for multi-site operators with facilities across the United States. The industry demand chart reflects where many U.S. capital dollars are flowing. In sectors with growing project activity, NPV is critical because it helps avoid approving projects simply because the market is active. When calculating NPV, include these cash flow elements: For engineering-intensive projects, this method works best when financial assumptions are grounded in plant reality. A design-build execution partner that understands process, utilities, installation, and startup can materially improve forecast quality. Manufacturers exploring project planning support can review project case examples to see how real capital programs are evaluated and delivered. The internal rate of return, or IRR, is the discount rate at which a project’s NPV equals zero. In simple terms, it estimates the annualized return percentage the project is expected to generate. CFOs often use IRR to rank competing investments when capital is limited. If a food manufacturer has five possible projects but can only fund two, IRR helps identify which opportunities produce the highest return relative to the investment. This is useful in years when plants in Tennessee, Ohio, California, and Texas are all competing for capital from a centralized finance team. IRR is especially relevant in these situations: Still, IRR should not be used alone. It can favor smaller projects with high percentage returns over larger projects with stronger total dollar value. A $300,000 controls project may have a 40% IRR, while a $5 million expansion project may have a 21% IRR but generate much more strategic value and more total profit. That is why IRR should be paired with NPV. For food and beverage product types such as spirits, sauces, dairy beverages, shelf-stable meals, or co-packed RTD products, IRR becomes most useful when there is a clear hurdle rate based on corporate capital policy. In the U.S. market, some firms may target 15% to 25% or higher for non-essential projects depending on risk and borrowing conditions. An area chart helps illustrate how project priorities have shifted from pure capacity spending to a mix of automation, risk reduction, and sustainability. This trend shift matters for IRR analysis because risk-reduction projects often generate returns through avoided losses rather than obvious revenue growth. Food safety, traceability, and uptime resilience are becoming more central in capital allocation decisions. Total cost of ownership, or TCO, expands the decision beyond purchase price. In food plants, low bid is often not low cost. TCO captures all major lifecycle costs associated with acquiring, installing, operating, maintaining, and eventually replacing an asset or system. This model is highly relevant when comparing local suppliers, OEMs, skidded systems, fabricated tanks, CIP systems, pumps, fillers, thermal processing equipment, water treatment systems, and utility packages. It is particularly helpful when equipment performance affects sanitation, uptime, spare parts availability, or labor intensity. TCO factors commonly include: A processor sourcing a new tank farm or CIP skid may find that one supplier offers a lower initial quote but higher service costs, longer lead times for parts, and more difficult sanitation. Over seven to ten years, the cheaper system can become the more expensive option. The comparison chart below visualizes a sample TCO-oriented supplier review. This chart shows a common procurement reality in food manufacturing: the lowest initial price does not always deliver the best financial outcome. TCO analysis is often where strong engineering input prevents expensive mistakes. For companies evaluating equipment options, integrated sourcing can also matter. Some project partners combine engineering with custom equipment capability, reducing mismatch between design intent and fabricated systems. Manufacturers can review process equipment capabilities when assessing whether a project needs standard equipment, custom fabrication, or a hybrid supply model. Risk-adjusted return metrics refine the analysis by asking not just what a project could return, but what it is likely to return once uncertainty is considered. In food and beverage manufacturing, that is critical because real project outcomes are affected by demand variability, commissioning delays, labor gaps, utility constraints, raw material price swings, and regulatory requirements. A risk-adjusted model may use probability weighting, sensitivity analysis, scenario planning, or hurdle rate premiums. This approach is especially useful for greenfield builds, multi-phase expansions, acquisitions, complex retrofits in operating plants, and projects supporting new categories such as functional beverages or plant-based proteins. Typical risk categories include: Risk-adjusted analysis is particularly valuable in 2026 planning. U.S. manufacturers are dealing with tighter sustainability expectations, growing electrification discussions, water stewardship pressure in drought-sensitive regions, and increasing digitalization requirements for traceability and operational visibility. Projects that appear similar on paper can have very different risk profiles depending on site readiness and execution quality. The strongest capital decisions do not rely on one formula. They combine multiple ROI models into a disciplined process from feasibility to final approval. A practical framework for U.S. food plants looks like this: This integrated approach works across industries such as brewing, distilling, dairy, protein, sauces, prepared foods, aseptic beverages, and co-packing. It is equally relevant for applications including blending, batching, fermentation, pasteurization, retort, packaging, cold-chain support, and full utility infrastructure. It also improves buying advice. Instead of asking only “Which quote is lowest?” teams should ask: For capital-intensive plants, governance matters. Finance should not own ROI alone. Operations, engineering, quality, maintenance, procurement, and commercial leadership each provide part of the answer. In many successful programs, an owner’s representative or integrated project partner helps tie these viewpoints together so the model reflects how the plant really runs. That cross-functional discipline is especially important in trade and distribution-heavy regions such as the Inland Empire, Chicago, Memphis, the I-85 corridor, and Gulf Coast logistics networks. Site strategy, freight lanes, labor markets, and utility infrastructure all influence whether a project’s return will hold up. Disruptive Process Solutions supports food and beverage manufacturers across the United States and Canada with a business-first approach to capital projects. Rather than treating engineering, equipment, and construction as separate silos, the company operates through a design-build-manage model focused on profitable execution. Technological capabilities: DPS brings process, mechanical, structural, plumbing, electrical, and controls expertise to projects involving automation, PLC programming, SCADA, batch systems, fermentation, pasteurization, sterilization, aseptic processing, carbonation, filtration, water treatment, refrigeration, and energy-aware utility systems. This matters for ROI because returns often depend on how well process technology and controls are integrated, not just on equipment selection. Manufacturing capabilities: The company also supports custom process equipment such as tanks, CIP systems, marination tumblers, and cooking vessels, which can improve fit-for-purpose design and reduce lifecycle mismatch between the plant requirement and the equipment supplied. In food and beverage manufacturing, custom fabrication can materially affect TCO, sanitation performance, and startup speed. Service capabilities: DPS provides process engineering, capital planning, feasibility studies, owner’s representation, project and program management, general contracting support where licensed, equipment supply, installation, integration, and commissioning. For manufacturers seeking stronger ROI outcomes, this end-to-end capability helps connect early assumptions to real field execution. More company background is available on the about page. One of the clearest lessons in ROI analysis is that the biggest spend is not always the smartest answer. Sometimes a plant believes it needs a multimillion-dollar expansion when the real bottleneck is programming, sequencing, or utility imbalance. That kind of insight is where engineering judgment protects capital. NPV is usually the best primary model for a major expansion because it captures long-term value, but it should be paired with IRR, TCO, and risk-adjusted analysis. No. It is useful for quick screening, but it ignores time value of money and hidden lifecycle costs. Always validate with TCO and, for larger projects, NPV. For many food plant projects, five to ten years is common. Shorter periods may fit automation upgrades, while utility infrastructure and core process systems often justify longer horizons. It depends on cost of capital, financing conditions, and project risk. Many companies use their weighted average cost of capital and then add risk premiums for uncertain projects. Compliance-related investments can still have strong ROI through risk avoidance, customer retention, reduced recall exposure, and business continuity. Risk-adjusted models are especially helpful here. Beverage, dairy, protein, aseptic, prepared foods, sauces, co-packing, and plant-based systems all benefit from formal ROI review because these segments often involve complex utilities and sanitation demands. Do not compare vendors on price alone. Review installation complexity, service responsiveness, spare parts access, sanitation design, energy use, controls compatibility, and lifecycle cost. Include automation maturity, AI-assisted process visibility, sustainability reporting, water reuse economics, energy management, traceability requirements, and policy-driven efficiency upgrades. In summary, food plant ROI analysis is most effective when it combines financial rigor with process reality. U.S. manufacturers that use payback, NPV, IRR, TCO, and risk-adjusted returns together can make faster, smarter, and more resilient capital decisions in a market where execution quality matters as much as the idea itself. -
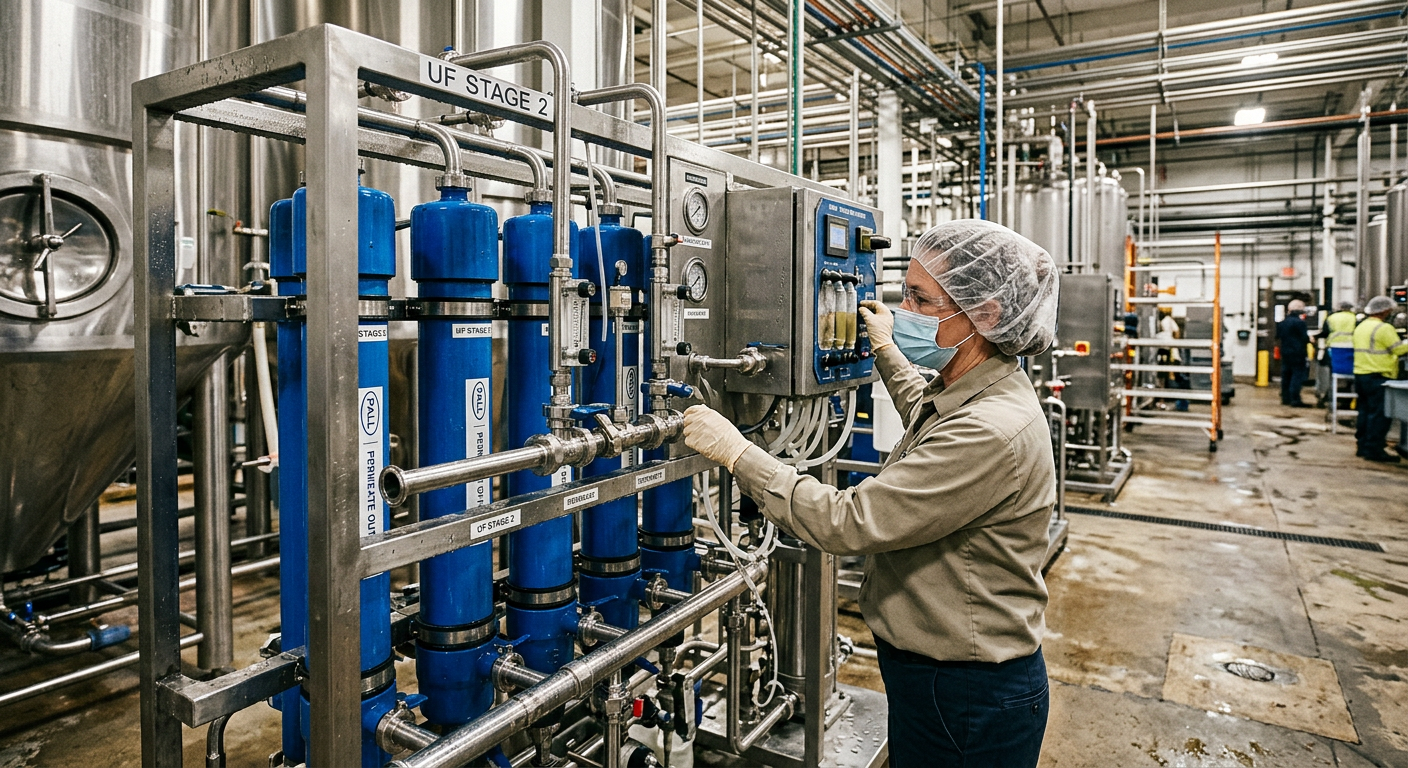
Food Facility NPV Modeling in 2026: Best Practices and Common Mistakes
Net present value, or NPV, remains one of the most reliable tools for judging whether a food or beverage facility investment will create economic value. In the United States, where processors face high utility costs, labor variability, freight constraints, sanitation requirements, and fast-changing consumer demand, a disciplined NPV model helps leaders move beyond instinct and compare projects on a common financial basis. Whether the decision involves a new protein plant in Texas, a dairy line expansion in Wisconsin, a beverage co-packing site near Atlanta, or a brownfield upgrade in California, the quality of the model directly affects the quality of the capital decision. This guide explains how to build a practical NPV model for food facilities in 2026, what assumptions matter most, how to avoid the mistakes that distort valuation, and how to use NPV to compare greenfield and brownfield options. It also connects project economics to real operating conditions across major U.S. manufacturing corridors such as Chicago, Dallas-Fort Worth, Charlotte, Fresno, Houston, Kansas City, the Inland Empire, and logistics gateways tied to the ports of Los Angeles, Long Beach, Savannah, New York and New Jersey, and Houston. The best practice for food facility NPV modeling in the United States is to forecast realistic after-tax cash flows, use a risk-adjusted discount rate grounded in WACC, stress test labor, throughput, utility, and compliance assumptions, and treat terminal value conservatively. The most common mistakes are overstating ramp-up speed, underestimating startup losses, ignoring maintenance capital, using the wrong discount rate, and failing to model working capital. For most processors, an accurate model combines engineering scope, operating data, utility loads, automation strategy, and local market conditions before any board-level capital approval is issued. In practical terms, a strong model should answer six questions: The table above shows why NPV is not merely a finance exercise. In food and beverage manufacturing, engineering design, sanitation strategy, packaging format, utility infrastructure, labor layout, and logistics all alter the cash flow pattern. A board may approve a project because revenue looks attractive, but NPV can still be negative if startup drag, higher maintenance, or a weak residual value are ignored. NPV converts future project cash flows into today’s dollars. That matters because a dollar generated five years from now is worth less than a dollar earned today. In a food facility context, the cash flow stream may come from increased throughput, higher margin products, improved yields, reduced giveaway, lower labor dependence, reduced rework, lower water or energy consumption, fewer sanitation hours, or improved service levels to major retailers and foodservice customers. For U.S. processors, NPV is especially useful because project economics are often uneven across time. A greenfield beverage plant in North Carolina might require 12 to 18 months of construction and commissioning before revenue stabilizes. A brownfield meat processing upgrade in Iowa may generate benefits more quickly but also create shutdown costs and operational disruption. A retort expansion in New Jersey may unlock national distribution, while an aseptic line in California could open premium channels but demand higher validation and maintenance discipline. NPV organizes these uneven effects into one decision metric. Food facility NPV modeling should evaluate the project on an incremental basis. Only cash flows that change because of the investment belong in the model. Existing overhead that will remain regardless of the decision should not be forced into the analysis unless it changes with the project. Likewise, sunk costs such as past feasibility spend should not be treated as project cash outflows if they have already been committed. In 2026, the market environment adds complexity. Wage pressure remains elevated in many production zones. Water and wastewater costs continue to matter in Western states. Utilities and refrigerant strategy are increasingly linked to sustainability goals. Retailers and major brands are still pushing resilience, traceability, and compliance. These trends make NPV more valuable, not less, because intuitive capital spending can easily miss hidden cost drivers. The chart above illustrates the broader investment trend driving stronger demand for robust financial models. As processors expand domestic production, modernize legacy facilities, and invest in resilience near major freight corridors, capital discipline becomes critical. The key lesson is that NPV in food processing is operational at its core. It should reflect how the plant actually runs, not how a spreadsheet looks in a clean conference room. A strong cash flow model begins with project scope. Start with total installed cost: process equipment, utilities, building modifications, engineering, permitting, controls, integration, freight, rigging, startup, commissioning, training, and contingency. In U.S. food projects, owners often underestimate indirect costs such as local code upgrades, wastewater tie-ins, HVAC modifications, floor replacement, process piping reroutes, and sanitation-driven utility changes. If the scope is incomplete, the model is already compromised. Next, define the benefit pathways. Some projects create top-line growth through new capacity. Others create cost reduction through lower labor, reduced waste, lower water use, better yield, shorter changeovers, or less downtime. Many projects do both. Benefits should be tied to line rates, OEE assumptions, staffing models, utility loads, maintenance profiles, and actual product mix. If a new filler can run 300 bottles per minute but upstream blending, pasteurization, or case packing cannot support that rate, the model should not claim the full filler capacity benefit. Ramp-up deserves special attention. Most facility models are too optimistic in the first 12 months. Startup losses, qualification runs, labor learning curves, recipe tuning, customer approvals, sanitation debugging, and packaging variability all reduce realized output. A practical model uses monthly or quarterly ramp assumptions rather than a straight annual average. Working capital must also be captured. A growing facility typically needs more raw materials, packaging inventory, finished goods, and receivables. In sectors such as beverage, dairy, and sauces, inventory policy can materially affect cash use during launch. If NPV ignores working capital, the project may look better than the real treasury burden. Tax treatment matters as well. Federal and state taxes, depreciation schedules, bonus depreciation rules, and local incentives all influence after-tax cash flow. For some projects, abatements, grants, training funds, or utility incentives in states such as Texas, Georgia, North Carolina, Indiana, or South Carolina can materially improve economics. The explanation behind this table is simple: every omitted line item tends to bias the NPV upward. In food manufacturing, that usually results in a project that looks better in presentation materials than it performs in the plant. To improve model accuracy, many owners pair financial modeling with front-end engineering and operations mapping. This is where an integrated partner can help. Disruptive Process Solutions brings process engineering, utility design, controls integration, and capital planning into one framework, which is valuable because throughput assumptions are only credible when the process, utilities, and execution plan are aligned. Companies reviewing project approaches can explore food and beverage engineering services as part of early-stage feasibility work. The discount rate converts future cash flows into present value. In most corporate settings, the starting point is weighted average cost of capital, or WACC, which reflects the cost of debt and equity financing. But using a single corporate WACC without adjustment can be misleading. A low-risk utility optimization project inside an existing plant should not be evaluated exactly like a greenfield co-packing facility dependent on new customer wins. The cash flows are different, so the risk should be different. For U.S. food manufacturers in 2026, discount rate selection should account for several factors: project complexity, demand uncertainty, execution risk, commodity exposure, customer concentration, regulatory burden, technology maturity, and strategic importance. A brownfield automation upgrade in an established Midwest plant may justify a lower risk adjustment than a new aseptic beverage site intended to enter unfamiliar channels near the Port of Savannah. That does not mean the discount rate should become a vague judgment tool. It should remain disciplined. Many companies set a base WACC and then apply project-specific overlays or scenario probabilities rather than arbitrarily raising the hurdle rate. This approach keeps governance consistent while still respecting actual risk. Another common issue is mixing nominal and real assumptions. If revenue, labor, energy, and maintenance costs are forecast with inflation, the discount rate should also be nominal. If all cash flows are in real terms excluding inflation, the discount rate should be real. Mixing the two can significantly distort NPV. The demand profile above helps explain why discount rates may vary by project category. Segments with faster expansion often face higher utilization uncertainty, while mature segments may present steadier but lower-growth cash flows. This table matters because discount rate errors can overpower all the operational detail in the model. Even if throughput, yield, and labor assumptions are strong, a flawed WACC approach can still produce the wrong capital ranking. Terminal value often determines a large portion of total NPV, especially for long-life food facilities. That is why it must be handled carefully. For some projects, a terminal value based on continuing cash flow may be appropriate. For others, especially equipment tied to one product or customer, a lower residual value or no terminal growth may be more realistic. In food processing, terminal value should reflect the real economic life of the asset. Tanks, utility infrastructure, structural elements, and certain process systems can remain useful for decades with proper maintenance. Specialized fillers, packaging formats, proprietary automation, and customer-specific lines may become obsolete much faster. The model should distinguish between them. Exit assumptions should also reflect marketability. A strategically located plant in a logistics corridor near Chicago rail hubs, the Dallas distribution network, or the Port of Houston may hold stronger residual value than a highly customized facility in a labor-constrained region with limited alternative use. Likewise, environmental liabilities, refrigerant transitions, wastewater limitations, and deferred maintenance can reduce practical terminal value. A conservative habit is to use multiple cross-checks: a perpetuity growth method, an exit multiple if relevant, and an asset-based residual estimate. If the implied terminal value from one method seems far above replacement economics, the model is probably too aggressive. The trend shift above is important for terminal value in 2026. Facilities that support energy efficiency, water recovery, flexible packaging, traceability, and automation readiness may retain value better than assets built around outdated utilities or narrow product architectures. For boards and lenders, the explanation is straightforward: terminal value should support the investment case, not rescue it. If a project only clears the hurdle because of an aggressive exit assumption, the underlying economics are probably weak. No food facility model should be approved without sensitivity analysis. The most useful NPV models are not static forecasts; they are decision tools that show how value changes when the real world changes. For a U.S. processor, the most important sensitivities usually include throughput, selling price or customer volume, labor availability, utility cost, yield, startup timing, capex overrun, maintenance cost, and discount rate. Scenario planning is especially useful when comparing strategic pathways. A base case might assume current market growth and a normal startup curve. A downside case could include slower customer onboarding, temporary labor shortages, elevated natural gas prices, and delayed validation. An upside case could reflect stronger utilization, faster line balancing, and local incentives. In 2026, it is also wise to model sustainability and policy scenarios, such as water use restrictions, refrigerant changes, emissions reporting expectations, and retailer pressure for more resilient domestic supply. Monte Carlo simulation can help advanced teams, but even a well-designed tornado chart and three-case scenario set will outperform a single-point model. The purpose is not to create false precision. It is to identify which variables truly control value and where management should focus execution discipline. The comparison chart shows why scenario planning matters. Greenfield and brownfield projects often trade off capital intensity, startup speed, efficiency, and risk in very different ways. The lesson from this table is that sensitivity analysis should be owned by the business, not only by finance. Reliable inputs come from engineering, operations, maintenance, procurement, quality, and commercial teams working together. The most damaging NPV mistakes are usually simple. Companies overestimate throughput, underestimate startup losses, omit maintenance capital, ignore working capital, double count labor savings, or use a discount rate that does not match the cash flow assumptions. In food plants, another major error is assuming the equipment determines capacity by itself. In reality, the slowest constraint often sits in utilities, changeovers, sanitation, packaging, warehouse flow, or controls logic. Another major problem is failing to separate strategic value from direct cash flow. For example, a compliance-driven refrigeration, pasteurization, or hygienic design upgrade may not increase sales immediately, but it can reduce downtime risk, customer audit exposure, product loss, and recall probability. If the model excludes those avoided-cost benefits, management may underinvest in essential resilience. There is also a governance issue. Many project cases are built to win approval rather than to forecast truth. This often shows up in low contingency, optimistic installation windows, vague labor assumptions, and a terminal value that does too much work. The antidote is cross-functional challenge from people who understand how plants actually run. On the technology side, companies should verify that data architecture, PLC logic, SCADA integration, and recipe control assumptions are included where relevant. In some projects, software and controls unlock more value than new steel. A business-minded engineering team can often identify that earlier. This kind of thinking aligns with the operating philosophy behind real project case examples where profitability is judged by actual operational bottlenecks rather than headline capex alone. This table explains why model quality depends on organizational honesty. The best NPV models are usually built by teams willing to challenge assumptions before the project begins, not after performance misses the budget. Greenfield versus brownfield is one of the most important capital choices in U.S. food manufacturing. A greenfield project usually offers better layout, utility efficiency, food safety zoning, automation integration, and future expansion flexibility. A brownfield project usually offers faster market entry, lower initial capex, an existing workforce, and sometimes lower permitting complexity. NPV helps reveal which option truly creates more value once timing, disruption, risk, and scalability are reflected. For example, a new beverage facility near Charlotte or Dallas may cost more upfront but allow optimized syrup rooms, boilers, compressors, cooling towers, packaging flow, and future line additions. A retrofit of an older plant near Chicago or Los Angeles may save capital and speed launch, but hidden utility upgrades, floor slope issues, sanitation constraints, low clear heights, and production interruptions can erode value. Brownfield economics often look attractive because the initial capex is smaller. Yet if the site limits throughput, causes higher sanitation labor, creates freight inefficiencies, or requires repeated patchwork upgrades, long-term NPV may be weaker. Greenfield economics often look harder at first because the spend is larger. Yet if the facility is designed for expansion, energy efficiency, and smooth material flow, later cash generation may be much stronger. Product type also matters. A highly sanitary aseptic or dairy process may benefit more from purpose-built design than a simpler dry blending operation. Protein plants may gain materially from labor and traffic flow redesign. Beverage co-packing often benefits from future-ready utilities and automation if volumes are expected to scale rapidly. This is also where local supplier and execution ecosystems matter. Regions with strong contractor networks, fabricators, utility providers, and labor availability can reduce schedule and contingency risk. Owners should examine not just equipment price, but installation capacity, local trade quality, code familiarity, spare parts support, and startup proximity. The stronger the regional supply base, the more reliable the NPV case becomes. When evaluating these options, many manufacturers look for integrated support that combines planning, design, equipment, and execution. Disruptive Process Solutions applies a Design Build Manage approach that helps align investment strategy with real field execution. Businesses exploring the firm’s background can review the company overview to understand how project-minded engineering can strengthen capital decisions. Disruptive Process Solutions supports food and beverage manufacturers across the United States and Canada with a practical focus on profitable capital deployment. Rather than treating a project as a collection of disconnected vendors, the company works as an engineering-led partner that evaluates process, utilities, controls, constructability, and business outcomes together. That approach is especially useful in NPV-driven decision making because the quality of the financial model depends on the quality of the technical assumptions behind it. From a technological capability standpoint, DPS brings process engineering across food, beverage, dairy, protein, fermentation, aseptic, thermal processing, and automation environments. The team works with process systems such as blending and batching, CIP, HTST and UHT, retort, carbonation, distillation, filtration, water treatment, refrigeration, PLC programming, SCADA, batch control, and energy management. For NPV modeling, these capabilities matter because throughput, yield, utility load, sanitation time, and labor productivity all stem from how the process is truly engineered. From a manufacturing capability standpoint, DPS also designs and supplies branded process equipment including tanks, CIP systems, marination tumblers, and cooking vessels, while integrating a broader range of third-party process equipment into complete plant solutions. That gives clients a grounded perspective on installed cost, maintainability, site fit, and startup readiness. Companies comparing alternatives can review available process equipment capabilities when building assumptions for facility investment cases. From a service capability standpoint, DPS provides capital planning, feasibility studies, owner’s representation, process design, project and program management, general contracting support where licensed, installation, utility integration, and commissioning oversight. The company serves all 50 states with a lean execution model that is built for quick decision making and direct accountability. For U.S. food and beverage operators, this matters because schedule reliability, scope control, and startup performance are not side issues in an NPV model; they are core drivers of value creation. The practical philosophy behind DPS is to challenge bad assumptions early, even if that reduces near-term project revenue. That kind of radical transparency is valuable in capital planning, where the wrong project can lock in years of underperformance. Whether the need is a co-packing beverage facility, a protein line modernization, a dairy utility upgrade, or a full feasibility study for a new site, the goal is the same: build profitable projects with assumptions that hold up under operational pressure. What is a good NPV for a food facility project?A good NPV is one that is positive after realistic assumptions, risk testing, and proper discounting. The exact threshold depends on corporate capital constraints, strategy, and project risk. Should food companies use payback or NPV?Use both, but rely more on NPV for final ranking. Payback is useful for liquidity awareness, while NPV better captures long-term value. How long should the forecast period be?Most food facility models use 5 to 10 explicit forecast years plus terminal value. The right horizon depends on asset life, customer visibility, and market stability. What discount rate should be used in the United States?There is no universal rate. Start with corporate WACC, then evaluate whether project-specific risk adjustments or scenario analysis are warranted. How should incentives be handled?Include only incentives that are reasonably probable and well documented, such as grants, tax abatements, training funds, or utility rebates tied to the site. Is greenfield always better for 2026 sustainability goals?Not always. Greenfield often allows better energy, water, and flow design, but a well-selected brownfield site can still produce superior NPV if existing infrastructure is strong and retrofit risk is manageable. Which variables usually matter most?In many U.S. food projects, utilization, startup timing, capex overrun, labor savings realization, yield, and maintenance needs drive the largest NPV changes. How often should the model be updated?At minimum, update it at feasibility, 30 percent design, procurement lock, pre-startup, and post-launch review. The best companies use the same model as a living management tool. In summary, accurate food facility NPV modeling in the United States depends on integrating finance with engineering reality. Projects succeed when cash flow assumptions reflect plant constraints, compliance needs, local market conditions, and execution discipline. In 2026, that means building models that are rigorous enough to withstand inflation, labor volatility, sustainability demands, and changing customer expectations. When smart capital meets smart manufacturing, NPV becomes more than a formula. It becomes a roadmap for profitable growth.


