-
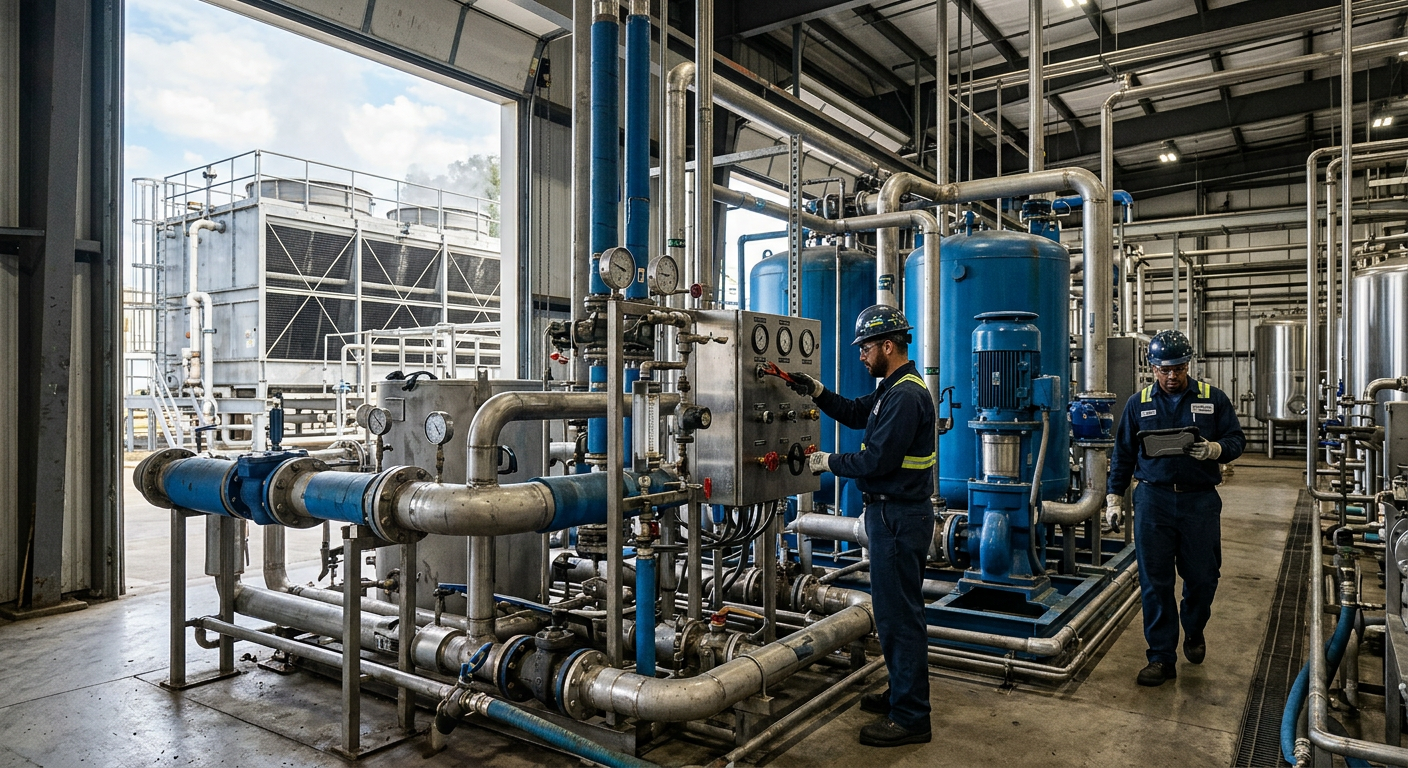
Food Plant Steam System Sizing: Engineering Calculations for Process and CIP Applications
Steam remains one of the most important utilities in American food and beverage manufacturing. It heats kettles, retorts, blanchers, pasteurizers, jacketed tanks, CIP skids, hot water sets, washdown systems, and building support loads. In facilities from dairy plants in Wisconsin to protein processors in Arkansas, beverage co-packers in Texas, and sauce plants near the Port of Savannah, accurate steam sizing directly affects production uptime, sanitation performance, energy cost, and future expansion. The fastest way to size a food plant steam system is to calculate the peak simultaneous steam load for process equipment, CIP, sanitation, domestic support, and distribution losses, then apply a practical design margin based on startup events and future capacity. In most U.S. food plants, undersized systems fail during overlapping events such as morning startup, retort heat-up, multiple kettle calls, and CIP return-to-temperature cycles. Oversized systems, on the other hand, create poor turndown, short boiler cycling, unstable pressure, and unnecessary fuel spend. A sound engineering approach usually includes these steps: For many United States projects, the most economical solution is not the largest boiler. It is the best-matched system architecture: one or more boilers with proper turndown, a distribution network laid out for dry steam, high condensate return, and controls aligned with actual operating sequences. This matters especially in fast-growth regions such as North Carolina, California’s Central Valley, greater Chicago, and the Dallas-Fort Worth manufacturing corridor, where plants often expand in phases and utility capacity decisions made early can lock in operating cost for years. The table above shows why steam sizing must reflect actual operating behavior. Average load rarely predicts the real peak that determines boiler and header capacity. Steam demand calculation starts with a thermal inventory. Every user is listed with operating pressure, target temperature, product mass, heating time, jacket efficiency, startup frequency, and simultaneous use. In food applications, process steam load generally falls into two categories: direct equipment heating and indirect hot water generation for CIP or process loops. The core formula is a heat balance: Required heat = mass x specific heat x temperature rise, plus vessel losses, plus heat-up of metal surfaces, plus safety allowances appropriate to the process. That heat duty is then converted into steam flow using the usable latent heat at the selected steam pressure. For example, if a sauce kettle in Ohio must raise 2,000 pounds of product from 70°F to 190°F in 30 minutes, the engineer calculates the product heat load, adds vessel and piping losses, and divides by the available Btu per pound of condensing steam. That yields a realistic pounds-per-hour steam requirement. The same logic applies to cheese vats in Wisconsin, protein cookers in Nebraska, and aseptic support skids in New Jersey. Three methods are common in practice: For CIP systems, demand is often underestimated because engineers only count tank heating and forget recovery losses, make-up water swings, and concurrent circuits. A multi-tank CIP skid serving fillers, tanks, and lines in a beverage facility near Los Angeles may have a relatively modest average steam draw but a very high short-duration peak when fresh caustic, acid, and hot rinse cycles are staged poorly. Sequencing can reduce installed boiler capacity as effectively as hardware changes. The table above shows why a single rule-of-thumb value is rarely enough. Accurate sizing depends on process detail. Where plants already operate, trend data can sharpen the model. Boiler fuel consumption, feedwater make-up, condensate return rate, and header pressure trends reveal actual demand shape by shift and season. Facilities in the Midwest often show winter spikes due to lower incoming water temperature and space-conditioning loads. Gulf Coast plants may show higher summer swings associated with sanitation schedules and beverage throughput. The line chart illustrates a realistic modernization trend for steam utility investment in the United States as plants pursue efficiency, electrification readiness, and tighter sanitation control through 2026 and beyond. Boiler sizing should reflect peak coincident steam demand, required redundancy, turndown, feedwater quality, emissions constraints, and growth plans. In food processing, boiler selection is as much about operations strategy as thermal capacity. A single large firetube boiler may look cheaper on day one, but two smaller units can improve turndown, maintenance flexibility, and resiliency during production surges. Selection criteria usually include: For example, a beverage plant near Charlotte planning to scale from one line to three may benefit from modular capacity rather than a single installed maximum. Likewise, a protein facility in Kansas City with sanitation-critical morning startups may prioritize fast response and strong low-load stability. The table above compares common boiler strategies. The right choice depends on production pattern, resilience needs, and long-term capital planning rather than equipment price alone. By 2026, boiler rooms in the United States are increasingly shaped by three trends: digital monitoring, stricter sustainability expectations, and resilience planning. Plants are installing better blowdown heat recovery, O2 trim, combustion tuning, remote alarms, and integration with energy dashboards. Some projects also evaluate hybrid strategies where traditional gas-fired steam remains essential for core thermal loads, while electric hot water systems handle ancillary duties. Once the boiler plant is sized correctly, the steam distribution network must deliver dry steam at stable pressure to each point of use. Poor network design can waste the benefit of an otherwise well-chosen boiler. In many brownfield plants from New Jersey to California, the real issue is not generation capacity but distribution losses, pressure instability, water hammer, and lack of drainage at low points. Good distribution design includes proper header sizing, branch takeoff orientation, pitch for condensate drainage, expansion allowance, insulation, drip legs, separators where needed, and practical routing around production areas. Long runs to remote packaging halls or warehouse utility drops, such as those found in large Texas or Georgia sites, require special attention to line loss and condensate formation. Target steam velocity varies by system, but the principle is straightforward: keep velocities reasonable, avoid excessive pressure drop, and protect steam quality. Undersized headers increase velocity and entrainment. Oversized pipes can increase cost and warm-up time. The network should be designed around the actual pressure tiers in the plant, often with a main high-pressure header from the boiler room and localized reduction for users such as kettles, hot water sets, and jacketed tanks. The table above highlights the physical details that separate stable steam systems from troublesome ones. The bar chart compares realistic relative steam demand intensity across major food and beverage segments in the U.S. market. Retort, protein, and prepared foods typically create the most aggressive steam peaks. In large metropolitan and port-connected zones such as Houston, Long Beach, Philadelphia, and Savannah, facility layouts may be constrained by older buildings or aggressive construction schedules. In these cases, pipe routing must be coordinated tightly with structural, plumbing, electrical, and controls work to avoid costly field changes. This is where integrated utility design offers real value. Manufacturers evaluating network upgrades can learn more about integrated process and utility delivery through food and beverage engineering services that align process goals with utility infrastructure instead of treating steam as a standalone package. Condensate recovery is one of the fastest-return improvements in food plant steam systems. Hot condensate contains both thermal energy and treated water value. Returning it reduces boiler fuel demand, make-up water consumption, chemical use, and blowdown rates. In many U.S. plants, raising condensate return from 45 percent to 75 percent can materially improve annual operating cost, especially where water, sewer, and gas rates are rising. Not every condensate stream should be returned. The decision depends on contamination risk, flash steam behavior, pressure differential, lift requirements, and product contact concerns. For example, condensate from utility steam jackets in a sauce plant is often suitable for return if the system is maintained well. Condensate from direct-contact or suspect heat exchange applications may need segregation. Key design choices include gravity return versus pumped return, vented receiver sizing, flash steam handling, NPSH for pumps, and location of polishers or monitoring points. A plant near Denver may face different return temperature and altitude considerations than one in coastal Louisiana. Brownfield sites with long underground runs may also need corrosion review and insulation upgrades before increasing return rates. The table above explains where condensate systems often gain or lose value. A recovery program succeeds when it is designed as a quality-controlled utility loop, not just a drain return. The area chart shows a realistic shift toward higher condensate recovery as sustainability and utility-cost management gain importance through 2026. Utility steam and clean steam are not interchangeable. When steam has any chance of direct or indirect product contact under a plant’s quality framework, the design basis must be defined carefully with QA, operations, and engineering. In pharmaceutical-style or high-care food environments, clean steam may be required for humidification in controlled zones, sterilization support, or direct-contact functions where boiler chemical carryover cannot be accepted. Clean steam systems typically require purified feedwater, compatible materials such as stainless steel, sanitary design principles, and controlled generation equipment. The exact requirement depends on product category, regulatory interpretation, and customer standards. A dairy ingredients plant shipping to demanding consumer brands may set stricter steam quality expectations than a conventional prepared foods site, even when both are within the same state. In food processing, the first question should be functional necessity: does the application truly require clean steam, culinary steam, or simply well-managed utility steam through a barrier heat exchanger? Over-specification adds cost. Under-specification adds risk. This decision matters in aseptic filling projects, retort support, ingredient injection systems, and high-care packaging areas. Plants developing direct-contact or hygienic steam applications often pair clean utility strategy with broader sanitary equipment planning. For manufacturers considering new skids, tanks, or integrated processing assets, custom process manufacturing and equipment solutions can help align utility design with hygienic standards from the beginning. Most food plants generate steam at one pressure and use it at several lower pressures. Pressure reducing stations provide controlled step-down while protecting steam quality, downstream equipment, and operator safety. A good PRV station includes more than a single reducing valve. It needs proper isolation, straining, drip removal, pressure sensing, safety relief, bypass strategy where justified, and enough straight run for stable control. Common station mistakes include undersized valves for startup load, oversized valves that hunt at low flow, poor trap drainage upstream, no separator where wet steam is likely, and relief devices that do not match actual downstream pressure class. These issues often show up in real facilities as unstable jacket temperatures, erratic control valves, and nuisance trips on hot water sets. In plants with multiple pressure levels, it is often smart to reduce pressure close to the user group rather than once centrally for the whole plant. Local reduction can improve control and reduce unnecessary high-velocity low-pressure piping. For example, a large beverage campus in Phoenix may use a medium-pressure distribution loop with dedicated low-pressure stations for syrup prep, bottle washer support, and sanitation hot water generation. The table above explains why PRV stations should be treated as engineered assemblies rather than accessories. Steam traps are small devices with large consequences. Incorrect selection or poor maintenance leads to live steam loss, flooded heat exchangers, water hammer, slow batch times, and degraded sanitation performance. Every food plant should treat steam trap management as part of its utility reliability program, not as a minor maintenance task. Trap choice depends on application. Float and thermostatic traps often fit modulating heat exchangers and unit heaters. Inverted bucket traps may serve drip applications. Thermodynamic traps may suit certain high-pressure drip services. Thermostatic air vents and startup venting behavior also matter, especially where rapid heat-up is required. A trap survey should classify location, service type, pressure, condensate load, failure mode, and criticality. In many plants, 10 to 20 percent of installed traps are underperforming at any given time. That can quietly erase fuel savings from a new boiler project. Large sites in Illinois, Pennsylvania, and California often find six-figure annual losses once failed-open traps and bypass leakage are quantified. Maintenance best practices include annual or semiannual survey routes, ultrasonic and thermal inspection, trap tagging, replacement standards, and integration into CMMS systems. If a facility lacks a current map of steam traps, it lacks control of one of its simplest utility efficiency levers. The comparison chart shows why many growing food plants favor modular utility strategies even when the single-boiler option appears cheaper at first glance. Manufacturers seeking a practical example of utility optimization tied to broader plant performance can review project case studies that show how engineering decisions affect throughput, capital efficiency, and operating results. Disruptive Process Solutions supports food and beverage manufacturers across the United States and Canada with a design-build-manage approach that connects process engineering to real capital outcomes. Rather than treating steam, CIP, controls, and installation as disconnected scopes, the company works across utility and process systems so owners can make faster, better-informed project decisions. From a technological capabilities standpoint, DPS brings integrated engineering across process, mechanical, plumbing, electrical, structural, and controls disciplines. That matters when a steam system must coordinate with PLC logic, SCADA visibility, batching, recipe control, energy monitoring, and production sequencing. In a modern plant, correct steam sizing is not just a boiler-room exercise; it is part of a wider operating model. From a manufacturing capabilities standpoint, DPS also supports custom process equipment that can be aligned with utility needs from day one. That includes tanks, CIP systems, cooking vessels, and related processing assets that benefit from a coordinated approach to steam pressure, condensate routing, sanitary design, and automation. This is especially valuable in projects where utility assumptions can easily drift away from actual equipment performance. From a service capabilities standpoint, DPS works across capital planning, feasibility, owner’s representation, detailed engineering, general contracting functions, installation management, commissioning, and system integration. For manufacturers expanding in high-growth U.S. regions such as North Carolina, Texas, California, and the Midwest, that end-to-end delivery model can reduce handoff errors and improve schedule control. Companies that want to understand the team and delivery philosophy in more detail can visit about Disruptive Process Solutions. The focus is straightforward: profitable projects, transparent advice, and utility and process decisions that hold up in the field. How much design margin should be added to a food plant steam load?There is no universal percentage that fits every plant. Margin should reflect uncertainty, startup behavior, and future growth. A well-defined project may only need a modest margin, while a phased expansion with unknown line additions may justify more. Blindly adding 30 percent without reviewing coincidence often causes oversizing. Should CIP be sized on average or peak demand?Peak coincident demand. CIP systems are highly cyclical, and the highest steam draw often occurs when heating fresh solutions or recovering tank temperatures between circuits. Sequencing changes can reduce peak demand significantly. When is clean steam necessary in food manufacturing?When the application, customer requirement, or regulatory interpretation demands steam quality beyond normal utility steam, especially for direct product contact or highly hygienic support functions. The answer depends on the exact application, risk assessment, and quality standard. Is condensate always worth returning?Usually yes, but not always. Return suitability depends on contamination risk, elevation, flash behavior, pumping needs, and economics. Segregation is often the right answer where some streams are clean and others are questionable. What is the most common steam distribution mistake?Ignoring condensate drainage and pressure drop. Many plant issues blamed on boiler size actually come from wet steam, poor trapping, inadequate header design, or badly placed pressure reduction. How often should steam traps be inspected?Critical plants often inspect annually or semiannually depending on service severity. A trap program should be data-driven and tied to maintenance planning, not handled only after failures become obvious. Can one boiler support both process steam and future expansion?Sometimes, but only if capacity, turndown, and outage risk are acceptable. Many growing U.S. facilities choose modular or staged boiler capacity to protect expansion flexibility and maintenance uptime. How do 2026 sustainability trends affect steam system design?They are pushing plants toward higher condensate recovery, better metering, lower emissions burners, heat recovery, digital monitoring, and utility strategies that can adapt to changing fuel, electricity, and water economics. Corporate ESG commitments are also increasing scrutiny of boiler efficiency and water reuse. What information should be ready before starting a steam sizing study?Equipment list, process temperatures, batch sizes, cycle times, required pressures, sanitation schedule, line expansion plans, available fuel, water quality data, plant layout, and any utility trend history. The better the inputs, the more reliable the sizing outcome. In summary, food plant steam system design in the United States should be built on realistic process calculations, practical utility architecture, and clear understanding of how the plant will operate at peak. That means sizing for simultaneous demand, selecting boilers for both efficiency and resilience, delivering dry steam through a disciplined network, recovering condensate wherever sensible, and separating clean steam requirements from ordinary utility service. Plants that take this approach are better positioned for capacity growth, energy control, and reliable sanitation performance in 2026 and beyond. -
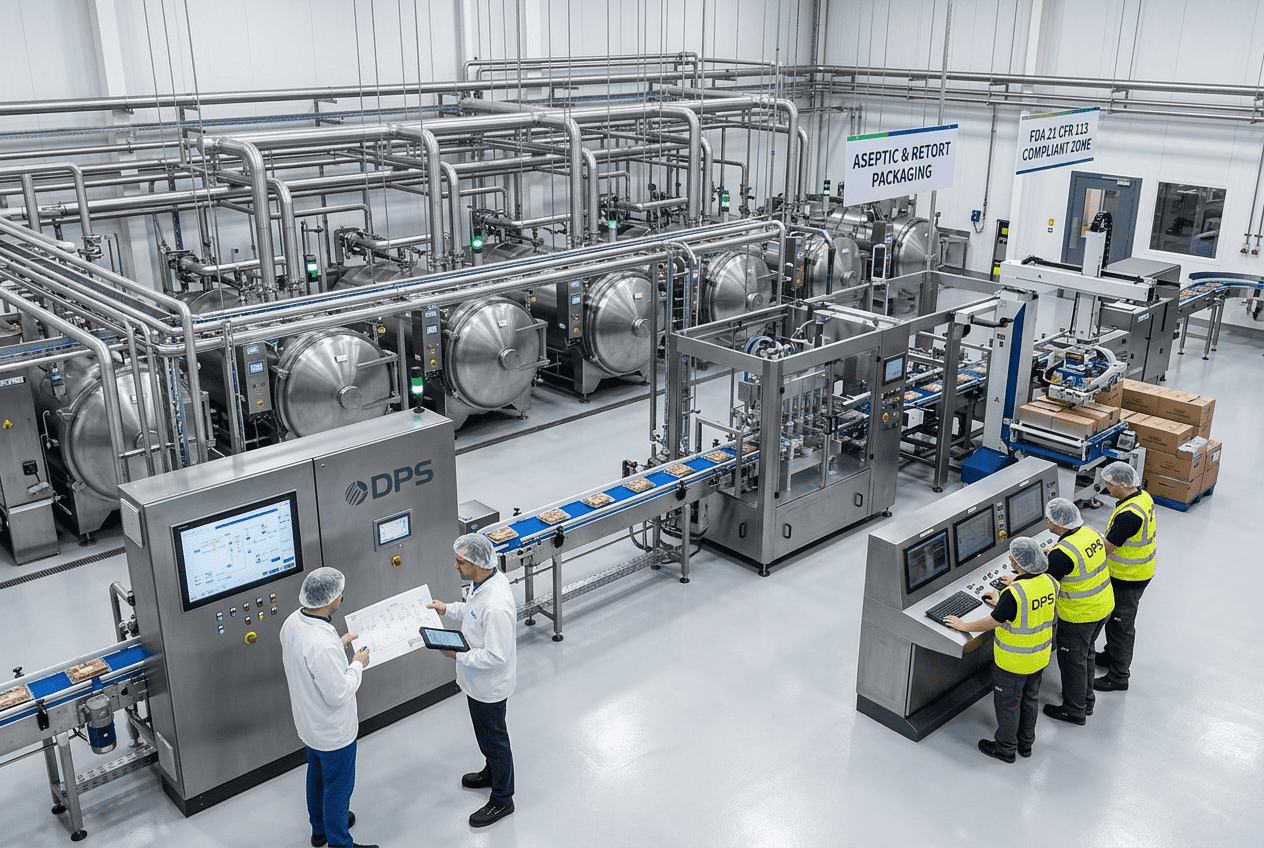
Food Facility Mass Balance Calculations: Engineering Methods for Production Efficiency
Mass balance calculations are one of the most practical engineering tools for improving production efficiency in food and beverage facilities across the United States. Whether a plant is processing poultry in Arkansas, sauces in Illinois, dairy in Wisconsin, beverages in California, or co-packed shelf-stable meals near Houston, the same principle applies: every pound, gallon, or kilogram entering a system must either leave the system, accumulate in it, or be lost in a measurable way. When this discipline is applied correctly, manufacturers gain tighter yield control, better scheduling accuracy, cleaner utility planning, stronger compliance records, and more profitable capital decisions. For U.S. manufacturers facing narrow margins, labor volatility, ingredient price swings, and sustainability pressure, mass balance is no longer just a process engineering exercise. It is a business management tool. Production leaders use it to understand shrink, accounting teams use it to reconcile inventory, operations managers use it to plan line loading, and project teams use it to size equipment, tanks, heat exchangers, pumps, and CIP systems. In high-throughput regions such as the Midwest dairy corridor, the Southeast poultry belt, and beverage hubs around Atlanta, Dallas, and Los Angeles, accurate mass balance work often separates reliable plants from facilities that constantly chase unexplained losses. This guide explains the engineering methods behind food facility mass balance calculations, how to quantify inputs and outputs, how to track moisture and solids, how to perform equipment-level balances, what software tools are useful, and how balance models connect to production scheduling. It also outlines common errors to avoid, buying advice for U.S. manufacturers, representative applications by product type, and where a full-scope engineering partner can help. A food plant mass balance is the structured calculation of all material entering and leaving a process over time. In practical terms, it answers questions such as: For most U.S. food plants, the basic equation is: Input = Output + Accumulation + Loss On a steady-state line with no meaningful accumulation, that often simplifies to: Input = Saleable Product + Byproduct + Waste + Emissions + Unrecovered Hold-Up The most valuable mass balance models in food manufacturing are not theoretical. They are built around real measurements: load cells, magnetic flowmeters, Coriolis meters, Brix readings, moisture tests, protein and fat analyses, packaging counts, CIP return volumes, trim collection, and cleanout losses. Plants that consistently quantify these items can improve yield, reduce giveaway, support HACCP and traceability records, and make better investment decisions. In the United States market, the strongest results usually come when mass balance is integrated into process design, automation, utility planning, and daily operations rather than treated as a one-time spreadsheet exercise. Mass balance begins by defining the system boundary. That boundary may be an entire facility, one production line, a single unit operation, or a campaign window such as one shift or one SKU run. In a sauce plant in New Jersey, the boundary may be the blend kitchen from ingredient staging to filler. In a meat plant near Kansas City, it may be the marination tumbler through thermal processing and packaging. In a brewery near Portland, it may be brewhouse to bright tank. The right boundary depends on the problem being solved. Three fundamentals matter most: Food systems are more complex than simple chemical transfer systems because ingredients are often biological, variable, and seasonally inconsistent. Tomato solids from California may differ by harvest week. Poultry yield changes with bird size, temperature, and deboning performance. Dairy solids fluctuate with incoming milk composition. Fruit puree Brix can drift based on supplier and storage conditions. Because of that, mass balance in food plants always benefits from routine sampling and statistically grounded reconciliation. The table below shows the core mass balance framework used in many U.S. facilities. This framework is useful because it connects engineering to operations. A plant may have a good facility-level balance but poor unit-level balance, which means the total numbers seem acceptable while one cooker, filler, or freezer is quietly creating losses. The line chart reflects a realistic industry trend: more U.S. plants are moving from manual spreadsheets to digital mass balance and yield tracking as part of automation, compliance, and sustainability programs. Input-output quantification is where many plants either gain confidence or lose it. Good balances depend on disciplined measurement at receiving, batching, transfer, processing, packaging, and waste handling. In food and beverage applications, the preferred method depends on the product and process condition. Common quantification methods include truck scales for bulk receiving, floor scales for super sacks and minor ingredients, load cells under tanks, magnetic or Coriolis flowmeters for liquids, positive displacement flow for viscous streams, package count verification, metal detector reject counts, and laboratory composition tests. In aseptic beverage and dairy systems, inline Brix, density, conductivity, and mass flow can materially improve calculation quality. In protein operations, trim bins, bone yield, purge loss, and cook loss must be tracked separately. Plants should also distinguish between direct measurement and inferred measurement. Direct measurement comes from calibrated devices. Inferred measurement comes from formula assumptions, density conversions, standard package weights, or average loss factors. Direct measurements are generally superior, but inferred values remain necessary where measurement points are limited. The following table compares common quantification methods used in U.S. food plants. For a buying decision, U.S. plants should prioritize measurement at bottlenecks and high-value loss points rather than trying to instrument everything at once. A line filling premium beverage concentrates in Southern California may justify Coriolis meters at multiple transfer points. A bakery in Ohio may get excellent results first by improving dough batch scaling, oven moisture testing, and package-weight verification. Industry by industry, quantification priorities differ: Moisture and solids accounting is the most important advanced topic in food mass balance because many large apparent yield losses are actually water movement. Cooking, chilling, drying, evaporation, concentration, freezing, thawing, fermentation, and storage all affect water distribution. If a plant tracks only wet weight, it may misread process performance. Consider a kettle sauce operation in Chicago. If 10,000 pounds of ingredients enter a batch and only 9,250 pounds are filled, the instinct may be to report a 7.5% yield loss. But if steam-off during cook is expected, and solids concentration rises to the target, the true material performance may be normal. Similarly, in a poultry line around Springdale, Arkansas, marinade uptake may increase weight before cooking, followed by expected cook loss and chill pickup. Without moisture accounting, operators can misdiagnose normal physics as process waste. Two related balances are often needed: Dry solids balance is especially useful for evaporators, dryers, breweries, tomato processing, yogurt, confectionery, and sauces. It helps answer whether solids are being lost or merely concentrated. From a product perspective, moisture and solids accounting is essential for dairy powders, plant proteins, prepared meals, sauces, soups, brews, spirits, juices, yogurt, cheese, canned foods, meat snacks, and bakery items. It is also important for labeling compliance and standard-of-identity targets. For U.S. manufacturers looking ahead to 2026, sustainability reporting is increasing the importance of water-linked mass balance. Plants are under pressure to document water intensity, product yield, wastewater loading, and recoverable byproduct streams. Accurate solids accounting helps reduce both overuse of utilities and organic loading to treatment systems. The area chart shows how plants are increasingly moving beyond simple wet-weight reporting toward composition-aware yield management. Equipment-level balances are where mass balance becomes actionable for engineering and maintenance teams. Rather than only asking what the plant lost in a week, equipment-level analysis asks what happened at each tank, filler, freezer, dryer, tumbler, or retort. This is usually where the biggest improvement opportunities appear. Typical balance targets include: For example, a UHT beverage system near Fresno may lose meaningful product during sterile startup, interface transitions, and end-of-run push-out. A prepared foods facility near Minneapolis may lose margin in kettle heel and particulate stratification. A distillery in Kentucky may have fermenter-to-still transfer variance that appears small per batch but becomes major over a year. The table below shows a practical equipment-level balance view. When performing equipment balances, plants should map product hold-up volumes and interface losses. This is especially relevant for long transfer lines, manifold-heavy systems, and multi-SKU beverage or dairy plants. In many cases, small per-changeover losses justify line pigging, improved push-out sequencing, recipe cutoff optimization, or revised valve automation. These calculations also support buying advice. If a U.S. manufacturer is choosing between a larger tank and a smaller, more responsive one, or between a basic filler and an advanced servo filler, mass balance data can clarify the economic tradeoff. The cheapest equipment on paper may create the most costly yield loss in practice. Software tools for mass balance range from simple spreadsheets to integrated plant-wide systems. The right choice depends on plant complexity, staffing, automation maturity, and the decision that needs support. Smaller facilities may begin with structured Excel templates and laboratory data imports. Larger facilities often use MES, historian platforms, SCADA-linked dashboards, ERP reconciliation tools, and specialized process modeling packages. In the United States, many projects now link mass balance to automation data collection. Flowmeters, tank levels, valve states, batch events, and line counts can feed a historian or SCADA layer. This reduces manual data entry and allows engineers to analyze losses by shift, SKU, or operator window. A good software setup does not need to be overly complex, but it must enforce unit consistency, version control, and exception visibility. Useful software categories include: The table below compares software approaches. When companies evaluate software, they should ask whether the platform can separate planned evaporation from true loss, reconcile batch and continuous process data, and connect floor data to scheduling and procurement. Plants near major trade and logistics hubs such as Chicago, Savannah, Long Beach, and Dallas often run more complex supplier and production networks, making digital reconciliation especially valuable. A full-scope engineering partner can help decide whether to build a simple, maintainable system or a highly integrated one. For example, food and beverage engineering services that combine process, controls, and project management can align instrumentation, software logic, and reporting structure so the balance model serves operations rather than becoming an isolated engineering file. The connection between mass balance and production scheduling is often underestimated. Yet scheduling accuracy depends on realistic assumptions about batch yield, changeover loss, line starvation, intermediate storage, and cleanout recovery. If the mass balance is wrong, the schedule will also be wrong. Suppose a beverage co-packer near Charlotte schedules three RTD runs back to back using nominal yields. If startup loss, syrup room residuals, and changeover interfaces are not included, the plant may miss case targets, short ingredients, or overload downstream warehousing. In a prepared foods plant in Indiana, failure to account for cook shrink and hold times can produce mismatches between upstream mixing and downstream tray sealing. In dairy, standardization and filler giveaway can throw off daily milk utilization planning. The following scheduling variables should be tied directly to balance models: Good integration supports procurement, labor planning, warehouse allocation, and utility use. It also improves customer service because promise dates become more reliable. For co-packers and contract manufacturers in particular, mass balance-informed scheduling helps prevent margin erosion on low-yield SKUs. The bar chart illustrates where demand is strongest today. Protein, beverage, and dairy operations often have the fastest payback because yield movement is highly material to profitability. Plants considering new capacity should also use mass balance in capital planning. Tank farms, syrup rooms, boiler capacity, cooling towers, compressed air, wastewater pretreatment, and packaging line rates all depend on realistic material flow assumptions. A planning partner that understands both food processing and business economics can translate those assumptions into practical facility decisions. More details on project approaches and examples can be explored through selected food and beverage project case studies. Many balance models fail not because the math is complex, but because the assumptions are poor. The most common errors in U.S. food plants are avoidable with better structure and cross-functional review. Typical errors include using inconsistent units, confusing gross and net weight, ignoring startup and shutdown losses, assuming constant density, failing to separate evaporation from waste, overlooking rework loops, neglecting WIP accumulation, and relying on outdated formulation data. Another common issue is treating package count as equivalent to saleable mass even when overfill or underfill exists. The table below summarizes recurring mistakes and how to correct them. Two practical buying tips emerge from these errors. First, do not invest in software before standardizing the plant’s data definitions. Second, do not invest in hardware without a clear list of which loss points are worth measuring. Smart capital follows the highest-value questions. By 2026, regulatory and customer expectations in the United States are likely to put greater emphasis on digital traceability, water stewardship, and verifiable production reporting. Plants that correct these basic calculation errors now will be better prepared for evolving customer audits and sustainability scorecards. This comparison chart reflects why many manufacturers prefer integrated project delivery over isolated equipment procurement when mass balance accuracy is central to project success. Disruptive Process Solutions serves manufacturers across the United States and Canada with a business-first approach to food and beverage capital projects. Rather than treating mass balance as a narrow design exercise, the company applies it as part of broader process performance, profitability, and execution planning. That approach is especially relevant for manufacturers expanding capacity, relocating lines, improving yield, or building complex greenfield operations. Technological capabilities. DPS supports process, controls, mechanical, structural, electrical, and plumbing engineering for food and beverage systems. This makes mass balance work more useful because material calculations can be tied directly to automation logic, utility loads, vessel sizing, line routing, and process control strategy. For beverage and aseptic facilities, that may involve blending systems, inline Brix monitoring, pasteurization, UHT, carbonation, water treatment, and SCADA-linked reporting. For food applications, it may include mixing, grinding, cooking, emulsification, retort processing, dairy systems, plant protein lines, and sanitary utility integration. Additional background on the firm can be found on the about our company page. Manufacturing capabilities. DPS also brings equipment manufacturing experience to projects, including tanks, CIP systems, tumblers, and cooking vessels. That matters in mass balance-driven projects because fabricated equipment can be aligned with real hold-up volume targets, drainability needs, recovery expectations, and sanitation requirements rather than selected only from generic catalog options. For manufacturers evaluating vessel layout, transfer optimization, or custom process skids, the in-house perspective helps bridge the gap between engineering assumptions and shop-floor reality. More information about available systems and fabricated solutions is available under process equipment solutions. Service capabilities. DPS operates through a design-build-manage model that can support capital planning, feasibility, owner’s representation, project management, general contracting functions, installation oversight, system integration, and commissioning. For a mass balance initiative, that means one team can connect the front-end study to field execution. In practical terms, a client may begin with a production bottleneck review, discover the real issue is a controls or transfer constraint rather than equipment size, and then implement the fix with coordinated engineering and construction support. That is often the difference between theoretical improvement and measurable plant results. This integrated model is particularly useful for U.S. manufacturers in beverage co-packing, dairy expansion, protein processing, aseptic systems, and prepared foods, where project success depends on more than a standalone spreadsheet. It depends on how design, installation, controls, utility infrastructure, and schedule discipline all work together. What is the main purpose of mass balance in a food plant?The main purpose is to account for all material entering and leaving a process so a manufacturer can understand yield, waste, byproduct, moisture movement, inventory accuracy, and equipment sizing. Which industries benefit most from food mass balance calculations?Dairy, beverage, protein, prepared foods, sauces, bakery, aseptic processing, distillation, fermentation, and co-packing operations all benefit strongly. The highest-value applications are usually where ingredient cost or shrink is significant. How often should a plant update its mass balance?Core balance assumptions should be reviewed at least quarterly, while high-value production balances are often monitored daily or by batch. Composition-heavy systems may need more frequent moisture or solids verification. Can a plant use spreadsheets, or is specialized software required?Spreadsheets are acceptable for early-stage studies and smaller operations. As complexity grows, integrated MES, ERP, historian, or SCADA-linked tools usually provide better control and lower manual error. What local factors matter in the United States?Ingredient variability by region, freight routes, utility costs, wastewater requirements, labor availability, and access to major logistics hubs such as Chicago, Houston, Savannah, Los Angeles, and New York all influence how balance models should be built and used. How does mass balance help buying decisions?It shows the true production impact of equipment choices by quantifying yield loss, hold-up, changeover waste, utility use, and line capacity. This often prevents overbuilding or buying equipment that looks inexpensive but performs poorly. What are the biggest warning signs that a plant needs better mass balance work?Frequent inventory discrepancies, unexplained yield loss, recurring schedule misses, high giveaway, inconsistent batch output, poor rework visibility, and disagreement between plant and finance numbers are major signs. How does mass balance support sustainability goals for 2026 and beyond?It helps quantify water use, wastewater loading, recoverable product, product-to-drain loss, and utility-linked material movement. Those metrics are becoming more important for customer reporting, ESG programs, and cost reduction. Can mass balance be applied during expansion or greenfield design?Yes. In fact, it is most powerful during planning because it guides tank sizing, line rates, utility capacity, storage design, and scheduling assumptions before capital is committed. What should a manufacturer do first?Start by identifying one high-value line or product family, define clear boundaries, standardize units, measure true input and output points, and validate moisture or solids movement. Once that model is reliable, expand plant-wide. For food and beverage manufacturers in the United States, mass balance is one of the clearest paths to stronger production efficiency. It sharpens engineering, stabilizes scheduling, improves buying decisions, and creates a better foundation for profitability, compliance, and sustainable growth. -
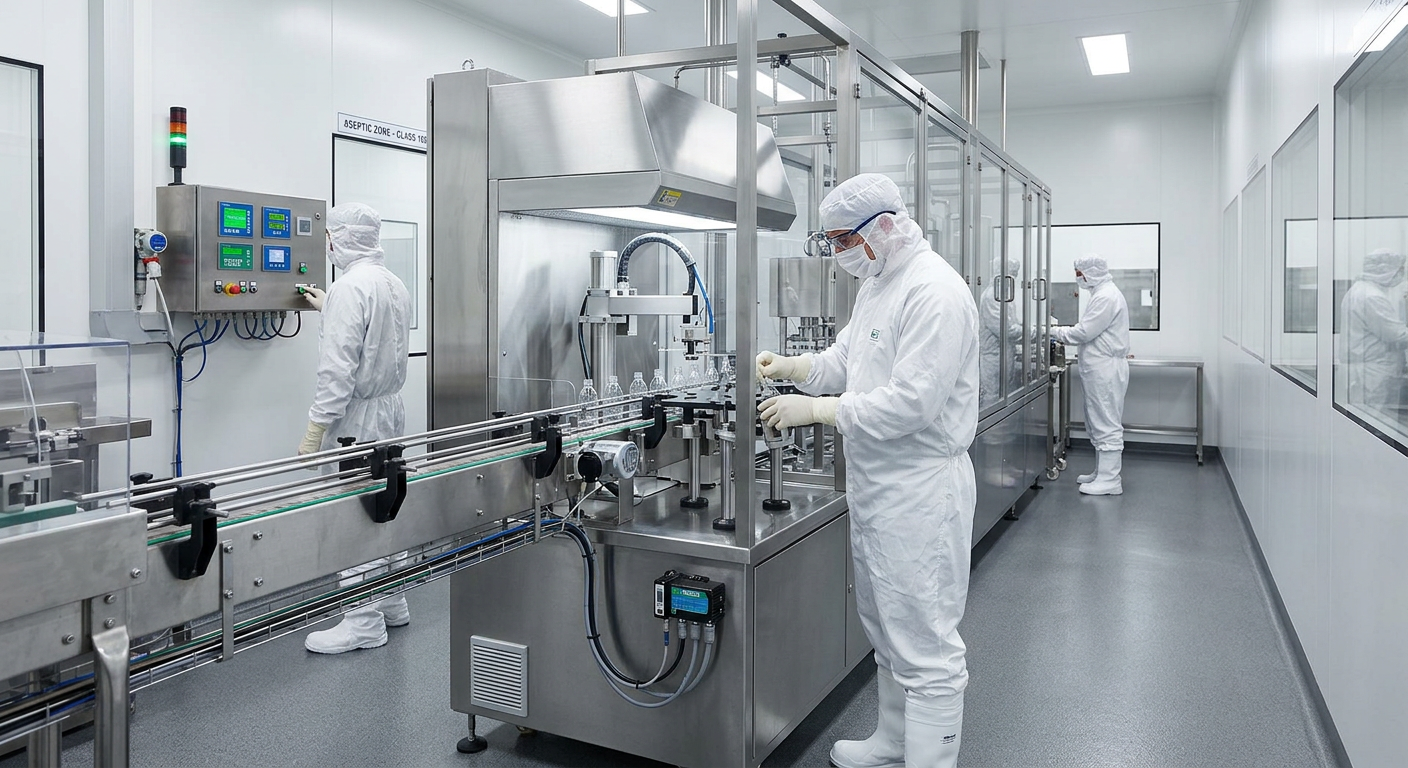
Paperless Manufacturing for Food Plants: From Clipboard to Digital Records
Food and beverage manufacturers in the United States are moving away from clipboards, handwritten batch sheets, filing cabinets, and disconnected spreadsheets because paper slows response times, increases compliance risk, and makes continuous improvement harder. A practical paperless manufacturing program usually starts with production order digitization between ERP and MES, then expands into digital work instructions, electronic batch records, shift handover logbooks, and setup or changeover checklists on operator terminals. For plants running under FDA, USDA, SQF, or BRC expectations, the value is not only speed. It is traceability, version control, searchable history, stronger training accountability, fewer manual transcription errors, and more reliable plant data for operations and capital planning. In U.S. markets from Chicago and Kansas City to Fresno, Charlotte, Houston, and the Inland Empire, food plants are under pressure to produce more SKUs with fewer labor hours while still passing customer and regulatory audits. That pressure is especially visible in protein processing, dairy, ready-to-drink beverages, sauces, aseptic production, and co-packing. A well-designed paperless system gives supervisors live visibility into work status, lets QA verify process steps without chasing binders, and gives engineering cleaner data to target downtime, yield loss, and sanitation issues. The fastest route from paper to digital records in a U.S. food plant is to replace high-friction paperwork first: production orders, line clearance forms, setup verification, batch records, shift logs, and work instructions. Instead of asking teams to overhaul everything at once, successful plants phase the rollout by line, process family, or compliance risk. The strongest starting point is usually the order-to-execution flow from ERP to MES, because that establishes a master record for what should be made, when, on which line, with which materials, and under which approved operating parameters. Once that foundation is in place, plants can layer operator-facing workflows on terminals or industrial tablets. Operators see current instructions only, supervisors can track read-confirmation, QA can require electronic sign-off, and engineering can lock critical fields or tolerance bands. When a deviation occurs, the response is faster because the system can force hold points, escalation prompts, or recheck tasks before production continues. For U.S. buyers, the best paperless manufacturing solution is not just software with forms. It should fit food-grade operations, support electronic signatures, retain audit trails, work in low-connectivity production zones, integrate with ERP and automation data, and scale across multiple facilities. Plants that pair digital records with practical process engineering and implementation support usually achieve better results than plants that treat digitization as an IT project alone. The table above shows why many food plants begin with the most repetitive, most auditable, and most error-prone records. Those are the workflows where digitization produces immediate labor and risk benefits. Production order digitization connects planning with execution. In a paper-based model, planners print orders, supervisors mark them up, operators interpret them, and data returns later through spreadsheets or handwritten logs. Each handoff creates delay and the possibility of mismatch between the planned order and what actually ran. In a digital model, approved orders flow from ERP into MES or a production execution layer, where they are assigned to specific assets, recipes, materials, labor groups, and quality checkpoints. For U.S. food plants, this matters most where lot traceability, allergen segregation, label control, or make-to-order scheduling are critical. A sauce plant near Atlanta, a dairy processor in Wisconsin, or a beverage co-packer near Los Angeles can all face costly rework if operators start from the wrong revision, wrong packaging format, or wrong ingredient release status. ERP-to-MES order flow reduces those failures by aligning inventory, recipe control, and actual production entry against the released work order. Good implementations also capture start and stop times, downtime reasons, material consumption, yield, operator confirmation, and in-process checks directly against the live order. That gives leadership a clearer view of schedule adherence and OEE, while finance gains more accurate production reporting. This structure is especially valuable at large U.S. logistics hubs such as Dallas-Fort Worth, Memphis, and New Jersey, where multi-shift operations need planning accuracy and fast recovery from disruptions. Plants serving retailers or foodservice customers can use digital order flow to tighten fill-rate performance and reduce manual order reconciliation. The chart illustrates a realistic market trajectory: digital record adoption is accelerating in U.S. manufacturing because labor constraints, audit pressure, cybersecurity-aware cloud deployment, and 2026 sustainability reporting needs are all pushing plants toward connected systems. Digital work instructions are often the highest-value step after order digitization. Most plants have standard operating procedures, cleaning steps, startup checks, packaging instructions, and troubleshooting guides, but many still depend on printed binders or PDFs saved in uncontrolled folders. That creates a familiar problem: the approved instruction exists, but the operator on second shift may not be using it. With version-controlled digital work instructions, the plant publishes one active instruction per task or equipment family. Operators access it through a line terminal, HMI-adjacent station, or rugged tablet. The system records who opened it, when it was acknowledged, and whether required training or read-confirmation is complete. If a change affects food safety, allergen handling, sanitation verification, or critical control procedures, the system can require acknowledgment before the task proceeds. This approach is especially important in high-turnover labor environments and in multi-site networks. A co-packer in the Carolinas, a meat processor in Nebraska, and a beverage line in Southern California may all need consistent execution despite different staffing patterns. Controlled work instructions make it easier to standardize best practices across sites and shifts. Plants should avoid making work instructions too long or too technical for the point of use. The best digital instructions combine concise text, photos, diagrams, acceptable ranges, escalation prompts, and links to maintenance or QA references. They should also distinguish between informational content and mandatory action steps. The table shows that not every instruction needs the same controls. Some need simple visibility, while others require enforced sequencing, electronic sign-off, or training verification. Electronic batch records, or EBR, are central for regulated food and beverage production because they convert fragmented notes into a complete, auditable production history. In a paper environment, one batch may require weigh sheets, process logs, quality checks, sanitation release records, hold tags, and supervisor signatures from multiple areas. During an audit or customer complaint, gathering the full packet can take hours or days. EBR consolidates those events into a structured digital record tied to the order, recipe, lot genealogy, equipment, and user actions. For U.S. plants dealing with FDA preventive controls, USDA inspection expectations, customer audits, export requirements, or strict retailer scorecards, EBR can materially improve compliance discipline. Required fields can prevent incomplete records. Timestamping can show the actual sequence of events. Exception workflows can route deviations to QA or management. Attached photos, sensor values, and scanned lot data can support investigations more effectively than handwriting ever could. EBR is especially valuable in aseptic, retort, dairy, fermented beverage, nutritional beverage, protein marination, and batch sauce operations where process integrity and lot traceability are critical. Plants in ports and distribution corridors such as Savannah, Long Beach, Philadelphia, and Houston also benefit because customer response speed matters when product is moving nationally. When plants implement EBR, they should be careful not to simply digitize bad paper forms. A better approach is to redesign the workflow around exceptions, limits, and traceability logic. That means asking which entries should be automated, which steps need dual verification, and which records need to trigger investigations. The point is not to create prettier forms. The point is to create stronger production control. This industry demand view reflects where digital record initiatives are strongest: complex batching, traceability, food safety documentation, and multi-SKU operations tend to create the clearest business case. Shift handover is one of the most underestimated sources of lost productivity in manufacturing. In many plants, critical information about line status, downtime causes, material shortages, maintenance issues, sanitation concerns, and quality holds is passed through notebooks, whiteboards, verbal updates, or text messages. Important details disappear, repeat problems go untracked, and management lacks a clean history. Digital shift logbooks solve that by capturing structured entries with timestamps, equipment tags, priority levels, attachments, and responsibility assignments. A supervisor can see what happened on first shift, whether an issue was escalated, whether maintenance responded, and whether the problem recurred on another line. Searchable logbooks are far more useful than static notes because they allow trending by asset, category, SKU, or recurring defect. For plants running 24/7 in manufacturing corridors such as Indianapolis, St. Louis, or the Central Valley, this can significantly improve continuity. If a filler fault appeared three nights in a row, if a blender routinely misses target Brix during startup, or if a packaging line repeatedly waits on label verification, the data becomes visible. That supports both daily management and capital planning. Good digital logbooks should include free text, but not rely only on free text. The system should prompt users with standardized categories such as quality, maintenance, sanitation, staffing, materials, utilities, and safety. That makes trend analysis possible while still allowing narrative context. Setup and changeover events are where paper-based plants often lose hidden profit. A rushed startup can lead to mislabeled product, wrong tooling, incorrect line settings, missing sanitation release, excess giveaway, or delayed first-pass quality approval. When checklists are on paper, completion may be inconsistent, signatures may be late, and review may happen after waste is already created. Digital checklists on shop-floor terminals bring discipline to these moments. The system can present tasks in the required order, require scans or photos, block progression if key items are incomplete, and route approvals to QA or maintenance when needed. On a food line, that could include allergen flush confirmation, label code verification, metal detector challenge, nozzle setup, packaging material checks, startup sample approval, and first-good-unit release. For short-run and high-SKU environments such as co-packing, contract manufacturing, and seasonal production, digital changeover control often produces very quick returns. It reduces startup scrap, improves first-pass quality, shortens time to release, and creates repeatable best practices across crews. The explanation is simple: setup checklists only help if they are usable under production pressure. Terminals must be easy to navigate, robust enough for wet or cold environments, and designed around operator workflow rather than office-style forms. The area chart highlights the trend shift expected through 2026: as labor efficiency, sustainability reporting, and customer audit demands increase, digital records will continue replacing paper across food manufacturing. A paperless manufacturing system succeeds only if the technical design matches plant reality. Food facilities have washdown conditions, inconsistent Wi-Fi zones, sanitation restrictions, glove use, multi-language staffing, and legacy controls. Engineering requirements therefore matter as much as software features. Plants should define user roles, record retention rules, cybersecurity requirements, network architecture, equipment interfaces, and environmental constraints early. If a facility wants automatic capture of temperatures, flow, fill weights, or CIP values, the implementation team must understand PLC and SCADA architecture as well as data quality limitations. If the goal is electronic signatures for compliance, the system must support secure user authentication, timestamping, and audit trails. From a practical standpoint, many U.S. plants need a hybrid approach: cloud-based administration with local resiliency on the shop floor. That allows enterprise visibility while protecting production during brief network interruptions. Terminals should also be selected based on use case: wall-mounted HMIs for fixed stations, stainless terminals for wet processing rooms, and rugged tablets for mobile verification tasks. On the technology side, engineering and integration services are most effective when they cover both process operations and controls. A firm with process, mechanical, electrical, and controls understanding can align digital record design with actual line behavior rather than treating forms as isolated software objects. That is particularly useful in processing environments involving CIP, pasteurization, fermentation, retort, batching, and utility-intensive systems. Technological capability also matters when plants want deeper data capture. A partner with experience in PLC programming, automation, SCADA, utilities integration, and process system design can help connect digital workflows to real equipment states, alarms, and production parameters. That is a major advantage over stand-alone form tools that never become part of the operating system of the plant. When evaluating suppliers, U.S. food manufacturers should ask not only about software licensing, but also about line connectivity, validation support, change management, multilingual usability, and long-term support for expansions or acquisitions. The best implementations are phased, measurable, and operations-led. Plants that start too broad often create user fatigue and weak adoption. Plants that start too small sometimes fail to build integration discipline. A balanced roadmap usually begins with process mapping, critical record identification, and pilot design on one representative line or process area. A practical roadmap includes discovery, requirements, workflow redesign, hardware planning, integration design, pilot deployment, training, performance review, and scale-up. During discovery, teams should document where paper is created, who touches it, what data is copied, what records are required for compliance, and what decisions depend on those records. That often reveals hidden delays and duplicate data entry. Project best practices include using plant champions from production, QA, maintenance, and IT; defining master data ownership; testing in real shift conditions; and measuring outcomes such as error reduction, faster release, shorter handover meetings, or improved retrieval time during audits. Plants should also keep operator screens simple. Adoption rises when workflows are intuitive and visibly useful. Service capability matters here as much as technology. Manufacturers often need a partner that can move from concept to field execution, coordinate contractors, align utilities and controls work, and manage project risk. A design-build-manage approach is valuable because it keeps accountability connected from engineering through commissioning and startup. Companies needing broader plant modernization can learn more about integrated execution through the DPS team and operating model, especially when digital records are part of larger process, utility, or capacity projects. For manufacturing capability, the strongest partners understand how digital systems fit real production environments such as beverage batching, dairy processing, protein preparation, sauces, aseptic systems, and co-packing. They can connect digital workflow design with physical equipment, utility demands, CIP strategy, packaging formats, and operating constraints. If specialized equipment or integration support is needed, process equipment capabilities can also influence how effectively data capture is built into the line from the start. For buyers in the United States, a good purchasing decision balances total cost, implementation support, flexibility, compliance features, and the supplier’s ability to work inside active food plants without disrupting operations. It is often smarter to choose a solution that solves the highest-risk records first than to buy a broad platform that remains underused. The comparison chart shows why many U.S. food manufacturers prefer food-focused execution platforms or integrated engineering-led solutions over generic digital form tools. The gap is usually largest in controls connectivity, audit readiness, and plant-floor usability. Disruptive Process Solutions supports food and beverage manufacturers across the United States and Canada with an execution style built around profitability, transparency, and practical manufacturing outcomes. Rather than approaching modernization as software alone, DPS works at the intersection of engineering, installation, integration, and project management. That perspective matters when paperless manufacturing is tied to broader line upgrades, utility changes, capacity expansion, or a new facility launch. From a technological standpoint, DPS brings process, mechanical, electrical, plumbing, structural, and controls knowledge into one delivery framework. That includes automation, PLC programming, SCADA coordination, and system integration relevant to production data capture and execution visibility. This makes digital record projects more effective in environments where the software must reflect real process conditions, recipe logic, equipment states, and utility dependencies. From a manufacturing standpoint, DPS supports a wide range of food and beverage applications including brewing, spirits, wine, kombucha, RTD beverages, dairy, sauces, prepared foods, protein processing, aseptic operations, and shelf-stable processing. That breadth matters because a digital batch record strategy for a retort line is not the same as one for a fermentation cellar or a high-speed beverage co-packing line. Experience with actual process systems helps shape better digital workflows. From a service standpoint, DPS provides end-to-end support ranging from capital planning and feasibility studies to owners representation, project management, general contracting functions where applicable, equipment supply, installation, and full system integration. Manufacturers looking for a project partner that can engineer, build, and manage around production realities can review selected project examples and case experience to see how integrated execution supports long-term operating performance. For U.S. plants making buying decisions, that combination can be especially useful when digital records are only one part of a larger need, such as adding a batching system, relocating equipment, improving utilities, expanding co-packing capacity, or modernizing controls. What is the best first step toward paperless manufacturing in a U.S. food plant?Start with the records that are used daily, affect compliance, and create the most rework when incorrect. Production orders, setup checks, batch records, and shift handover logs are usually the best first targets. Does a paperless system need full MES to deliver value?Not always. Some plants begin with digital workflows and selective integrations, then expand into a broader MES capability later. The right architecture depends on complexity, compliance exposure, and growth plans. How does digitization support FDA, USDA, SQF, or BRC expectations?It improves audit trails, record completeness, traceability, revision control, sign-off accountability, and retrieval speed. Those benefits are especially useful during inspections, customer audits, and investigations. Can legacy equipment still be included?Yes. Many plants use a hybrid model where some data is captured automatically from PLC or SCADA systems and other data is entered through guided operator workflows. The key is defining what must be automated and what only needs verification. How long does implementation usually take?A focused pilot can often launch in one to three months. A multi-line or multi-site rollout may take several more months depending on integration depth, hardware needs, validation expectations, and training complexity. What product types benefit the most?High-SKU beverages, dairy, sauces, proteins, aseptic products, prepared foods, and co-packed items often see the fastest returns because they involve frequent changeovers, recipe control, quality documentation, and traceability demands. What should buyers in the United States ask suppliers?Ask about ERP integration, electronic signatures, audit trails, offline capability, terminal suitability for food environments, controls connectivity, cybersecurity, support model, and experience in active food plants. How do 2026 trends affect investment decisions?By 2026, U.S. manufacturers will face even stronger expectations around data transparency, labor productivity, sustainability measurement, and resilient operations. Digital records support reduced paper waste, faster exception handling, better energy and process analysis, and stronger readiness for future policy or customer reporting requirements. Are local suppliers enough, or is a national partner better?It depends on project scope. A local specialist may work for a single workflow deployment. For multi-site programs, integrated utility upgrades, or projects spanning engineering and controls, a national partner with broad execution capability often reduces risk. Is paperless manufacturing only for large enterprises?No. Mid-sized manufacturers, regional co-packers, and fast-growing brands often benefit quickly because digital records reduce administrative overhead and improve consistency without requiring large corporate support teams. -
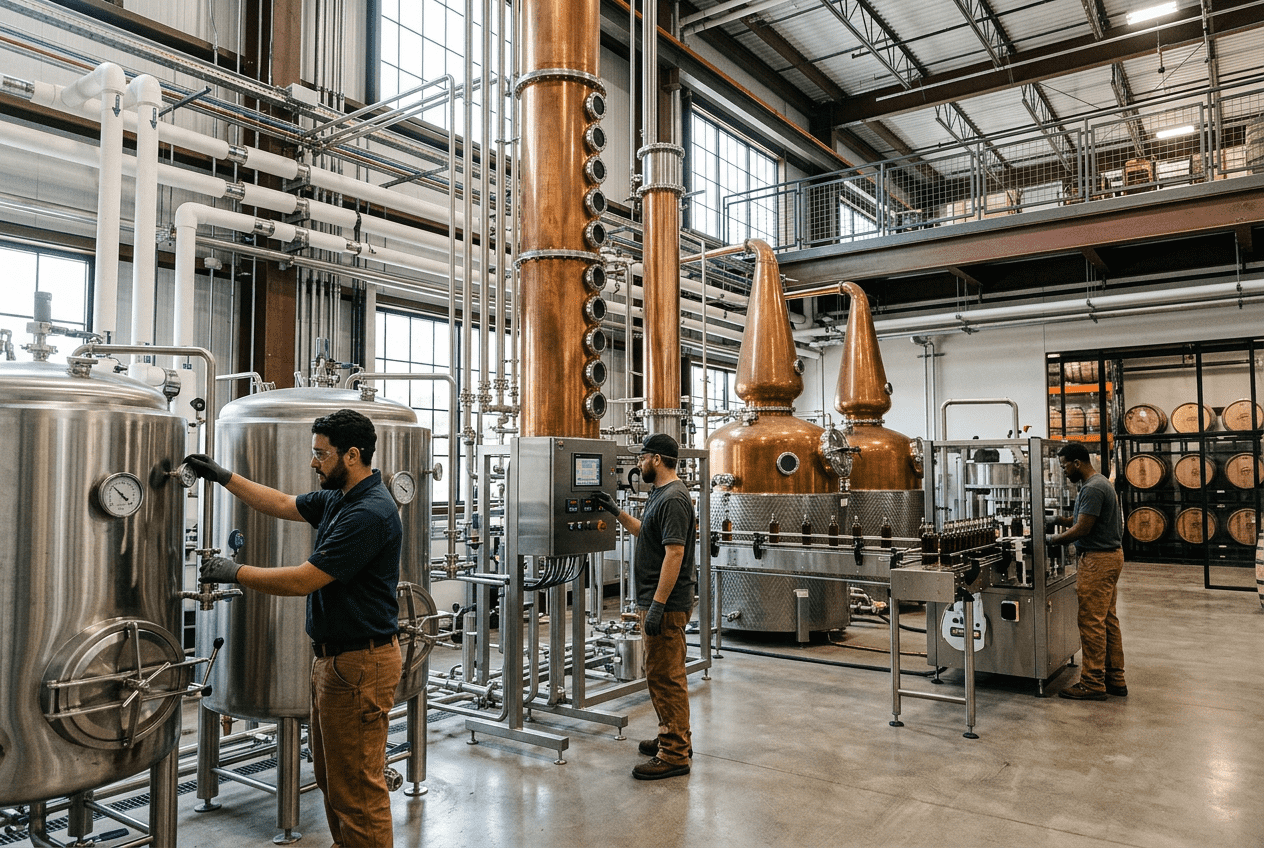
Retort Processing Systems for Food Plants
Across the United States, food manufacturers are under constant pressure to increase shelf life, protect product quality, and meet strict FDA, USDA, SQF, and BRC expectations. A retort processing system is one of the most important technologies used to achieve those goals for low-acid and shelf-stable foods. Whether a plant packs soups in cans, ready meals in trays, seafood in pouches, or sauces in jars, the right retort system helps the processor reach commercial sterility while preserving package integrity and line efficiency. Demand is especially strong in major production and logistics corridors such as Chicago, Houston, Los Angeles, Savannah, New Jersey, Dallas-Fort Worth, and the Carolinas, where manufacturers serve both domestic distribution and export channels through ports, refrigerated warehouses, and co-packing networks. In these markets, retort selection is no longer just about buying a vessel. It is about matching thermal process design, automation, utilities, packaging, throughput, validation, and long-term maintenance into a profitable operating model. For that reason, many U.S. processors work with engineering-led partners that can plan, install, and integrate the full process. Disruptive Process Solutions supports food and beverage manufacturers across North America with integrated capital project execution, helping clients connect process safety, plant layout, utilities, and production economics rather than treating retort equipment as a stand-alone purchase. A retort processing system is a pressurized thermal sterilization system used to heat sealed food containers to a validated time and temperature profile that destroys pathogenic and spoilage microorganisms and achieves commercial sterility. In low-acid foods, this typically means delivering a validated lethal effect, often expressed as F₀, while controlling pressure, venting, come-up time, cooling, and package stress. Common retort types include static steam, water immersion, rotary, and continuous systems. The best choice depends on product viscosity, package format, target throughput, utility availability, and regulatory validation requirements. In simple terms, a retort works by exposing sealed containers to controlled heat under pressure. The pressure keeps the package from distorting during the thermal cycle, while the heat penetrates to the product’s cold spot and destroys the organisms of concern. That combination is essential for low-acid foods such as meats, seafood, beans, soups, gravies, pasta meals, and many pet food products. The table above gives a practical overview, but each of these items influences equipment sizing, layout, controls architecture, and operating cost. U.S. plants shipping through retail, foodservice, military, and export channels usually need a solution that balances safety with throughput and package appearance. A retort processing system is a pressure-rated vessel or continuous thermal sterilization line designed to process sealed containers after filling and closing. The process is used primarily for low-acid foods with a pH above 4.6, where the risk of Clostridium botulinum must be controlled through a scheduled thermal process. Commercial sterility does not mean absolute sterility in a laboratory sense. It means the food is free of microorganisms capable of growing in the product under normal non-refrigerated storage and distribution conditions. The typical retort cycle includes loading, venting or air removal when needed, come-up to process temperature, holding for a validated time, controlled pressure balancing, cooling, and unloading. During the hold period, heat must reach the coldest point in the package. The cold spot can vary depending on product type. For conduction-heated foods such as pâtés or dense stews, the cold spot behaves differently than for convection-heated broths or soups. Commercial sterility depends on more than vessel temperature. It requires process authority review, container closure integrity, instrumentation accuracy, documented operating procedures, and lot traceability. That is why many successful projects in the United States integrate retort design with upstream filling, downstream drying and conveying, recipe management, utility generation, and plant controls. From a technological capabilities perspective, DPS works with processors that need this full-system view. Its engineering and integration capabilities span process, mechanical, electrical, structural, plumbing, controls, PLC programming, SCADA, and utility design. For retort projects, that matters because thermal safety is inseparable from steam quality, condensate removal, cooling water control, instrumentation placement, alarm logic, and data capture. The chart below reflects the steady expansion of shelf-stable packaged food demand in the United States, driven by convenience foods, emergency pantry stocking, export growth, and e-commerce distribution. This growth trend helps explain why processors in the Southeast, Texas, California, and the Midwest are evaluating retort expansions, packaging conversions, and co-packing capability upgrades. The opportunity is large, but so is the cost of a wrong specification. Under-sized retorts create bottlenecks. Overbuilt systems tie up capital and utility spending. Not all retorts heat the same way, and not all packages behave the same way under thermal load. The main system categories used in U.S. food plants are static steam, water immersion, rotary, and continuous retorts. Each has strengths tied to heat transfer, throughput, package support, utility use, and recipe flexibility. Static steam retorts are common when processors run metal cans or robust containers that can handle direct steam environments. They are often valued for thermal efficiency and straightforward operation. Water immersion retorts use hot water circulation to improve temperature uniformity and can be well suited for flexible and semi-rigid packages. Rotary retorts add agitation, improving heat transfer for certain products and often reducing cook time while supporting better texture or particulate suspension. Continuous systems are typically chosen for large-volume operations where a steady product flow justifies higher capital cost and more complex automation. In practice, the right choice depends on more than package type. Product rheology, fill weight, headspace, tray geometry, closure system, utility infrastructure, and labor model all affect the final decision. The table shows why no single retort design is best for every facility. A pouch meal line near the Port of Savannah may prioritize overpressure and basket logistics. A canned chili producer in Kansas City may prefer static steam. A high-output pet food plant near Houston may justify continuous operation. A premium soup line in California may choose rotary processing to reduce thermal abuse and improve texture consistency. Demand also differs by sector. The next chart compares relative demand by industry segment in the United States. Ready meals, pet food, and protein entrees currently drive much of the investment in retort capacity. That pattern is especially visible in regional manufacturing hubs such as Arkansas, North Carolina, Ohio, Southern California, and Texas, where labor availability, freight access, and utility infrastructure support scaled food production. Temperature and pressure are the heart of safe retort operation. For low-acid foods, even small deviations can lead to major compliance and safety consequences. The scheduled process defines target temperature, minimum hold time, vent schedule or air removal parameters where applicable, and required pressure profile during heating and cooling. Temperature must be measured with calibrated, validated instruments placed and configured according to the retort design. Operators rely on recording devices, indicating instruments, alarm logic, and recipe controls to ensure the process stays within approved limits. Pressure management is equally critical, especially for pouches, trays, plastic bowls, and glass jars. Internal package pressure changes rapidly as the contents heat and cool. Without proper overpressure control, seals may peel, lids may dome, trays may buckle, and glass may break. In modern plants, the control strategy often includes PLC-based recipe management, automatic cycle enforcement, batch records, SCADA visibility, and historian integration. This is where technological capabilities strongly affect risk reduction. DPS supports processors with control system architecture, PLC programming, automation, and plantwide integration that connect retort operation to upstream preparation, CIP skids, utilities, and downstream packaging systems. The biggest mistake many processors make is viewing temperature control alone as enough. In reality, thermal process safety is a combined function of vessel performance, package mechanics, fill consistency, steam or water distribution, utility stability, and disciplined operations. That is why projects in high-volume U.S. plants often include boiler review, condensate design, pump selection, utility redundancy, and alarm philosophy as part of the retort scope. F₀ is the most recognized lethality metric in retort processing. It expresses the equivalent sterilization time at 250°F, referenced to a z-value of 18°F for low-acid foods, unless otherwise specified by process authority. In practice, F₀ helps processors understand whether the accumulated thermal effect is sufficient to meet safety objectives without unnecessarily overcooking the product. However, F₀ is only useful when it is tied to real product behavior. That is why heat penetration studies are essential. A heat penetration study places thermocouples or data loggers in selected containers at the true cold spot and tracks how quickly the product heats and cools under actual retort conditions. These studies help determine safe scheduled processes and are especially important when changing formula, fill weight, container size, tray depth, agitation mode, or package material. Validation normally includes container closure review, distribution studies, repeatability checks, instrument calibration, and documentation acceptable to regulatory and customer standards. For U.S. manufacturers serving national retailers, military contracts, or export markets, this documentation is often reviewed closely during audits and customer qualification. Processors should remember that a higher F₀ is not always better. Excess lethality can damage texture, darken color, flatten flavor, and reduce nutritional value. The goal is not maximum cooking. The goal is validated safety with controlled quality loss. This is particularly important in premium ready meals, seafood, dairy-based sauces, and high-value protein applications. On the manufacturing side, DPS supports processors that need more than equipment sourcing. Its expertise spans retort and canning systems, cooking vessels, mixing, dairy processing, protein handling, utility systems, and custom equipment fabrication. That broader manufacturing capability matters because product preparation, particle size control, filling accuracy, and package handling directly affect retort validation success. Overpressure is the controlled application of external pressure in the retort to counter internal package pressure. It becomes especially important for pouches, trays, plastic bowls, composite containers, and glass jars. During heating, product moisture and headspace expand. During cooling, rapid temperature change can create a damaging pressure imbalance if the retort does not manage the transition carefully. For example, a flexible pouch may need enough external pressure to avoid swelling and seal strain during the cook. A plastic bowl may require stable support pressure to protect lid adhesion and bowl shape. Glass jars need controlled cooling to avoid thermal shock and breakage. Even metal cans can experience paneling or distortion if pressure or cooling transitions are poorly managed. Overpressure strategy includes vessel pressure control, air or gas management where applicable, pump and spray performance, cooling water ramp rate, and package support design. Basket loading patterns, divider plates, and rack strength also play major roles. The chart below illustrates how the U.S. market is shifting from rigid metal packaging toward a larger mix of flexible and semi-rigid retort-ready formats. This shift is one reason overpressure-capable systems are gaining attention in the United States. Brands want lighter packaging, lower freight costs, stronger shelf appeal, and more convenient formats. But those gains only materialize when thermal processing and packaging mechanics are designed together. Container compatibility is one of the first filters in retort system selection. Every package presents a different thermal response, mechanical limit, and closure challenge. The same recipe can require a very different retort process when moved from a steel can to a polypropylene bowl or from a glass jar to a stand-up pouch. Cans remain a durable and widely accepted option for soups, beans, seafood, and pet food. Pouches reduce freight weight and can improve heating rates. Trays and bowls support premium meal formats and microwave convenience. Glass jars remain popular in sauces, baby-adjacent premium products, and specialty foods where shelf presentation matters. The right retort system must support the package throughout the full cycle, not just at target temperature. Processors also need to evaluate line handling after retort. Wet packages may need drying. Flexible packs may need secondary support. Glass containers may need gentler conveying and case packing. Package compatibility therefore reaches well beyond the retort vessel itself. The comparison chart below shows a simplified scorecard often used in early project discussions. Scores are relative and should be validated for each actual product and package system. For plants considering a format change, early pilot work is essential. A pouch conversion may improve distribution economics but require a new basket design, different overpressure strategy, and revised heat penetration validation. A tray conversion may create stronger retail appeal but reduce net retort capacity per batch. These tradeoffs should be modeled before capital is committed. Selecting a retort system is a capital planning exercise as much as an equipment decision. The right solution depends on throughput target, package mix, recipe portfolio, labor strategy, utility load, floor space, and future expansion plans. A growing co-packer in North Carolina may prioritize flexibility across multiple SKUs and package formats. A large soup plant in Ohio may prioritize low cost per unit. A seafood exporter near Seattle or New Bedford may prioritize batch traceability and rapid product turnover. The most effective selection process usually starts with a production model. How many containers per hour are required? What are the longest recipes? How many shift hours are available? How much downtime is expected for loading, unloading, maintenance, and sanitation? What is the margin impact of one more basket per cycle or one less minute in cooling? These questions often determine the right retort count and automation level more accurately than nameplate capacity alone. From a service capabilities standpoint, DPS approaches these decisions through capital planning, process engineering, owner-side representation, general contracting coordination, equipment supply, installation, and project management. That matters because retort projects commonly affect steam generation, compressed air, cooling towers, water systems, drains, floor loading, electrical service, controls networking, and building modifications. A profitable outcome depends on integrating all of those elements. It is also wise to compare suppliers on more than vessel price. Plants should assess controls transparency, spare parts access, field service reach in the United States, validation support, basket ergonomics, cycle repeatability, and long-term maintenance cost. A lower initial price can become expensive if the system creates bottlenecks or requires frequent downtime. In many U.S. projects, the best financial decision is not the largest or most automated system. It is the system that fits demand now while allowing smart expansion later. This is especially relevant for processors scaling from regional to national retail distribution through hubs such as Atlanta, Memphis, Phoenix, and New Jersey. Although not every retort vessel itself is cleaned through a full CIP cycle in the same way as product-contact tanks, CIP integration around retort operations is still highly important. Upstream kettles, balance tanks, fillers, transfer lines, sauce systems, and associated utilities must be cleaned reliably to protect product safety and keep the retort running with minimal interruption. In many plants, retort uptime is constrained less by the vessel than by poor sanitation coordination, scale buildup, pump wear, valve issues, or utility instability. Preventive maintenance should cover instruments, door gaskets, spray nozzles, pumps, valves, chain systems, basket hardware, pressure regulators, recorders, temperature sensors, cooling circuits, condensate traps, and safety interlocks. A disciplined PM program reduces deviations, preserves package quality, and supports audit readiness. DPS also brings strong capability in utility and CIP system integration, including custom CIP systems, tanks, process vessels, and complete installation of steam, chilled water, compressed air, process piping, and controls. For processors, that means retort reliability can be addressed as part of a broader hygienic design and uptime strategy rather than as a stand-alone maintenance issue. Well-run maintenance programs also improve sustainability. Efficient steam use lowers fuel cost. Controlled cooling water use reduces water consumption. Better cycle consistency reduces overprocessing and waste. As 2026 approaches, U.S. processors are placing greater emphasis on energy monitoring, digital maintenance alerts, historian-based performance analysis, and water reuse strategies where permitted and technically appropriate. Future trends in the retort market include smarter recipe optimization, expanded use of digital twins for thermal modeling, tighter electronic batch records, stronger cybersecurity around PLC and SCADA systems, and increased pressure from retailers and regulators for traceable, documented food safety performance. Sustainability goals are also influencing package format decisions, utility system upgrades, and heat recovery considerations. Companies that treat retort systems as part of a larger smart-manufacturing strategy will likely be in the strongest position. What foods in the United States typically require retort processing?Low-acid shelf-stable foods such as soups, gravies, chili, beans, meat products, seafood, prepared meals, pasta dishes, broths, and many pet food products commonly require retort processing. How is retort different from pasteurization?Retort processing is a higher-severity thermal process intended to achieve commercial sterility in sealed containers, especially for low-acid foods. Pasteurization generally reduces microbial load but does not usually create a shelf-stable low-acid product at room temperature. Which retort type is best for pouches?Many pouch applications favor water immersion, water spray, or steam-air systems with strong overpressure control. The best option depends on pouch size, product viscosity, seal design, and target throughput. Can one retort run cans, trays, and bowls?Sometimes, yes. But multi-format flexibility depends on basket design, pressure capability, control precision, and validation work. A system that can technically run multiple packages may still perform best when optimized around a narrower mix. Why is F₀ important?F₀ provides a standardized way to quantify thermal lethality for low-acid foods. It helps processors validate safety while avoiding unnecessary overcooking. How often should a retort be validated?Validation is typically required for new products, new package formats, major formula or fill changes, significant equipment modifications, and whenever a process authority determines review is necessary. Routine verification and calibration should also be part of normal plant controls. What should buyers look for in a retort supplier or integrator?Look beyond vessel price. Evaluate U.S. service reach, controls capability, documentation support, package expertise, spare parts availability, maintenance requirements, and the ability to integrate utilities, automation, and surrounding process equipment. How can plants reduce retort project risk?Start with process authority input, packaging trials, throughput modeling, and utility review. Work with an engineering-led partner that can coordinate design, installation, controls, and commissioning across the full system. Processors can learn more about integrated project execution, equipment, and project experience through engineering and integration services, available process equipment solutions, and selected project case studies. For U.S. manufacturers, a retort processing system is not just a compliance tool. It is a strategic production asset that affects product safety, throughput, shelf life, packaging choice, labor efficiency, and profitability. Plants that align validation, controls, utilities, package mechanics, and maintenance from the start are far more likely to achieve dependable commercial sterility and long-term return on capital. -
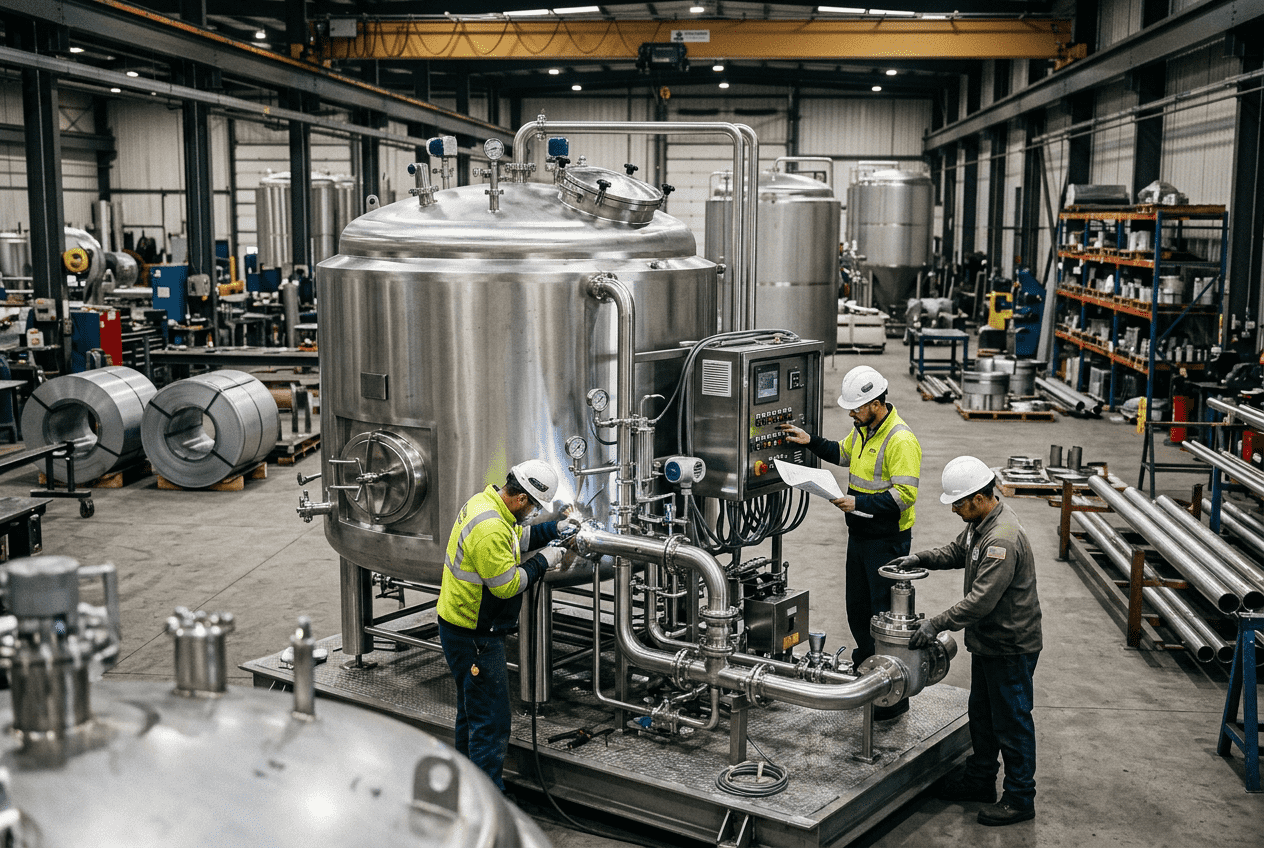
IIoT Implementation for Food Facilities: 5-Phase Deployment Framework
Industrial IoT implementation in food and beverage facilities works best when it is deployed in stages. In the United States, the most reliable path is a five-phase model: identify the assets that matter most, install secure edge connectivity, configure dashboards and alarms, activate analytics and AI, and then scale the platform across the plant with ERP and business-system integration. For food manufacturers, this phased approach reduces downtime risk, supports FDA, USDA, SQF, and BRC expectations, and helps operations teams improve yield, maintenance planning, energy use, traceability, and labor efficiency without disrupting production. Whether a plant is running dairy in Wisconsin, sauces in New Jersey, poultry in Georgia, beverages in Texas, or aseptic products in California, the same principle applies: start with the critical process bottlenecks, prove value on a controlled scope, and expand only after the data architecture, cyber controls, and operating workflows are working in real production conditions. A practical IIoT implementation for food facilities in the United States should begin with a short discovery process focused on the production assets most likely to create downtime, quality losses, utility waste, or compliance exposure. Typical first targets include pasteurizers, retorts, fillers, boilers, compressors, refrigeration systems, CIP skids, mixers, slicers, homogenizers, and packaging lines. After that, plants should install edge gateways that can collect PLC, SCADA, sensor, and utility data without interfering with validated controls. The third phase is dashboard creation and alert threshold setup so supervisors, maintenance teams, and plant leadership can monitor operating conditions in real time. The fourth phase adds AI and predictive analytics to identify failure patterns, process drift, sanitation anomalies, and energy inefficiencies. The fifth phase connects the deployed solution across the full plant and into ERP, CMMS, batch, quality, and inventory systems. This five-phase structure is especially important in food and beverage manufacturing because process stability matters as much as data visibility. A poor rollout can create nuisance alarms, overwhelm maintenance teams, or expose regulated operations to unnecessary change control. A disciplined rollout, by contrast, can improve OEE, reduce emergency maintenance, tighten process capability, and create better decision-making from the floor to the executive level. The table above shows why phased deployment is preferred over plant-wide big-bang implementation. Each stage creates a measurable checkpoint, which is especially valuable for operators managing perishable products, short production windows, and strict sanitation schedules. The growth trend reflects what many manufacturers are seeing across major U.S. processing corridors such as Chicago, Minneapolis, Fresno, Charlotte, Atlanta, Dallas-Fort Worth, and the I-95 Northeast distribution belt: IIoT is no longer a pilot-only concept. It is becoming part of mainstream capital planning. The first phase determines whether the project will create value or just create data. Discovery should start with a plant walkdown, utility review, process mapping session, and downtime history analysis. The team should identify which assets have the largest financial consequence when they fail or drift. In food plants, those critical assets are rarely limited to one production line. Utilities often matter just as much. A boiler upset, ammonia refrigeration issue, low compressed air quality event, or CIP underperformance can affect the whole facility. For most U.S. manufacturers, the strongest discovery questions are simple: where do we lose throughput, where do we lose quality, where do we lose yield, where do we lose energy, and where do we lose labor hours to reactive work? The answers reveal where sensors should be placed and what data should be captured. For example, a dairy facility in Wisconsin may prioritize temperature stability, separator performance, homogenizer vibration, and CIP conductivity. A beverage co-packer near Los Angeles or Savannah may focus on syrup rooms, blending accuracy, filler efficiency, compressed air, and tunnel pasteurization. A meat processor in Arkansas or North Carolina may prioritize refrigeration, slicing loads, washdown-ready sensors, and sanitation verification points. Sensor planning must align with the process and the environment. Food plants require careful attention to washdown ratings, hygienic design, chemical exposure, cable routing, enclosure standards, and calibration frequency. It is also important to separate what must be measured continuously from what can be inferred through PLC tags, historian data, or lab results. This table matters because it connects measurement strategy to business outcomes. Good sensor planning is never just about instrumentation density. It is about picking the data points that explain downtime, compliance, quality, and cost. During this phase, teams should also decide whether the first deployment should target one line, one process family, one utility backbone, or a mixed pilot. A mixed pilot is often ideal because it shows both line-level and plant-level value. For example, combining filler monitoring with compressor and boiler visibility can help leadership see the link between utility stability and production throughput. Once the target assets are defined, the next step is secure data collection. In food facilities, edge gateway installation should be designed around plant realities: existing PLC brands, network segmentation, sanitation zones, electrical constraints, and maintenance access. The objective is not to replace controls; it is to collect, standardize, buffer, and transmit data safely. Many U.S. facilities operate mixed automation environments that include Rockwell Automation, Siemens, Schneider Electric, legacy HMIs, stand-alone skid controls, and OEM-specific panels. That means the gateway architecture has to bridge protocols such as EtherNet/IP, Modbus TCP, OPC UA, Profinet, serial connections, and in some cases analog or pulse-based utility meters. In older facilities around the Midwest and Northeast, retrofit planning may also include cabinet modernization, power conditioning, and industrial wireless links where cabling is difficult. Connectivity decisions should be made jointly by OT and IT. The best architecture usually includes local buffering at the edge, segmented VLANs or separate OT networks, VPN access controls, certificate-based communication where possible, and a clear policy for remote support. Plants moving product through hubs like Houston, Newark, Chicago, or the Port of Long Beach often have enterprise pressure to centralize data quickly, but speed should never come ahead of cyber hygiene. The choices in this table directly affect long-term uptime. A plant may have excellent analytics software, but if the gateway layer is fragile, data confidence will collapse and users will stop trusting the platform. At this stage, many manufacturers benefit from an engineering partner that understands both production and controls. A firm that can work across process engineering, automation, utilities, and installation tends to reduce handoff errors. That matters when a project touches equipment rooms, packaging lines, and sanitary process areas at the same time. This is where integrated engineering capability becomes valuable, especially for companies that need structural, mechanical, electrical, process, and controls coordination instead of a narrow software-only deployment. Dashboards are where data becomes operational behavior. The mistake many teams make is building dashboards for everyone and value for no one. The better approach is role-based design. Operators need live status and actionable alarms. Maintenance needs condition trends, runtime, and failure signatures. Quality teams need process compliance views. Plant leaders need throughput, waste, and labor-impact indicators. Corporate stakeholders need standardized multi-site KPIs. Alert threshold setup should combine engineering limits, food safety boundaries, statistical process behavior, and business consequences. Not every out-of-range reading requires an alarm. In fact, too many alarms can be as harmful as too few. The goal is to separate informational events from urgent interventions. In food manufacturing, useful dashboards often include pasteurization temperature profiles, retort cycle verification, filler microstops, compressor load patterns, refrigeration efficiency, CIP performance, giveaway trends, utility cost per unit produced, and sanitation cycle adherence. Plants shipping through large retail and foodservice channels increasingly want these dashboards linked to traceability and lot performance, especially when serving national customers from hubs like Columbus, Kansas City, Phoenix, or Memphis. The table shows why alerts and dashboards should be configured by function, not by software convenience. A single dashboard rarely meets the needs of every user. Plants that adopt role-based views typically get better user adoption and fewer alarm complaints. One of the strongest buying recommendations for this phase is to insist on a dashboard design workshop before final configuration. That workshop should define KPI ownership, escalation logic, data quality rules, mobile access needs, and reporting cadence. It is also smart to validate thresholds against two to four weeks of baseline operating data before enabling full alarm routing. The bar chart highlights where demand is strongest. Beverage, dairy, aseptic, and protein operations tend to move quickly because quality risk, uptime sensitivity, and utility intensity are high. Prepared foods are also active, especially where multi-step thermal and mixing processes make root-cause analysis difficult without data. AI should not be turned on just because the software offers it. It should be activated only after the plant has trustworthy data, stable naming conventions, and clear ownership of response workflows. Otherwise, predictive analytics becomes an expensive alert generator with poor credibility. When implemented correctly, AI can create major value in food operations. It can detect bearing degradation before a filler fails, identify refrigeration drift before product temperatures go out of range, predict CIP deviations before a sanitation cycle is wasted, and uncover utility demand spikes that raise cost per case or cost per pound. In batch processes, it can help identify subtle combinations of process variables that correlate with rework, separation, texture problems, foam instability, overfill, or under-yield. AI deployment should focus first on use cases where action can actually be taken. Good initial use cases include predictive maintenance for rotating assets, anomaly detection for utilities, process drift monitoring for thermal systems, and batch pattern recognition for high-value products. More advanced applications can then expand into scheduling, labor planning, energy optimization, and digital twin models. For U.S. manufacturers preparing for 2026, this phase is becoming increasingly strategic. Rising labor constraints, insurance scrutiny, energy costs, and retailer expectations for consistency are all pushing plants to move beyond reactive operations. Sustainability reporting is also influencing deployment decisions, because AI can help document water, energy, and chemical use reductions tied to operational changes. The explanation is straightforward: AI performs best where repetitive patterns, measurable process signatures, and clear intervention paths exist. That is why utilities, rotating machinery, and structured thermal processes often outperform more ambiguous use cases early on. The area chart illustrates the operational shift now happening across the sector. As we move through 2026, more plants are budgeting for predictive methods because labor shortages and asset age make reactive maintenance increasingly expensive. After a successful pilot or limited rollout, the value of IIoT increases sharply when the plant connects line data with business systems. Full-plant scaling means standard naming, repeatable device templates, common dashboard logic, cyber governance, and formal ownership of the platform. ERP integration is where operational data begins supporting purchasing, maintenance planning, production accounting, inventory control, and capital allocation. For many food manufacturers, the highest-value integrations involve ERP, CMMS, MES, batch systems, historian platforms, lab systems, and quality records. For example, if downtime events automatically create maintenance work order context, reliability teams can respond faster and finance teams can see asset cost patterns more clearly. If batch deviations are tied to raw material lots and utility conditions, plants gain better root-cause analysis. If production and utility data feed into costing, leadership gains a better view of margin by SKU or customer. Scaling across a U.S. plant network also creates benchmarking value. A processor with sites in California, Texas, Illinois, and Pennsylvania can compare performance on common packaging formats, sanitation windows, energy per unit, and utility reliability. That visibility supports better capital planning and more disciplined replication of successful plant practices. When choosing a scale-up strategy, buyers should evaluate whether the provider understands not just software integration but also the physical realities of plant modifications. Food plants often need instrument additions, control panel upgrades, sanitary support changes, utility tie-ins, and coordinated shutdown planning. A capable deployment partner must be able to bridge engineering intent with installation execution. This comparison chart shows why many processors eventually favor an integrated deployment model. Point tools may install quickly, and OEM controls can be useful, but plant-wide value usually comes from solutions that combine process understanding, controls integration, installation management, and business-system alignment. Food and beverage plants need technical specifications that reflect both digital and physical requirements. Sensor selection should account for hygienic surfaces, washdown conditions, ambient temperature swings, chemical exposure, and calibration demands. Controls integration should define read/write access, data polling rates, historian retention, timestamp precision, and alarm hierarchy. Network design should address segmentation, gateway hardening, remote access, credential management, and patch strategy. Manufacturing capability matters here as much as software architecture. Plants often require custom skids, modified utility systems, panel work, fabricated supports, or integrated process equipment changes to make IIoT deployment truly useful. A partner with experience in process equipment, utilities, and field installation can solve bottlenecks that pure software vendors often miss. In many cases, the data problem is tied to a process problem: poor instrumentation on a CIP system, limited access around a tank farm, weak panel layout, or utility instability. Fixing the data layer sometimes means improving the mechanical or electrical layer as well. From a service perspective, the strongest implementations include front-end feasibility, design support, on-site coordination, commissioning, startup, and post-launch optimization. That service depth is particularly valuable when the project spans multiple trades and the plant cannot afford schedule drift. Companies evaluating partners should look for end-to-end capability rather than isolated consulting. The explanation is simple: technical specifications are what make a deployment repeatable, auditable, and scalable. Without them, every expansion becomes a custom project and ROI declines over time. For plants seeking complete plant modernization, it is often useful to align IIoT deployment with broader process improvements such as utility upgrades, control panel replacements, filler expansions, CIP modernization, or sanitary piping projects. That is particularly effective when working with a company that can combine process engineering, project delivery, installation, and equipment integration under one plan. More information on these broader capabilities can be found in the company’s food and beverage engineering services and its process equipment solutions. The best roadmap for a U.S. food facility is one that ties digital deployment to operational priorities and shutdown windows. In practice, that usually means starting discovery during live production, performing panel and gateway prep off-line, installing in planned maintenance windows, validating data quality before dashboard rollout, and only then enabling AI and enterprise integration. Best practice number one is to establish a steering team with operations, maintenance, QA, IT, engineering, and finance representation. Best practice number two is to write success criteria before the project starts. Good success criteria may include a defined reduction in downtime, better thermal compliance visibility, a target cut in compressed air waste, or a reduction in emergency work orders. Best practice number three is to train users by role. Best practice number four is to treat naming conventions, data ownership, and cybersecurity as core design tasks rather than afterthoughts. Procurement teams should also compare local supplier and integrator models carefully. In some regions, a software reseller may be enough for a simple dashboard project. In more complex facilities, especially older plants in manufacturing centers such as Milwaukee, St. Louis, Philadelphia, Fresno, or Houston, it is often better to select a deployment partner with field construction and process integration experience. That reduces the gap between what is specified and what can actually be installed. As 2026 approaches, policy and sustainability trends are strengthening the business case. Utilities and insurers increasingly reward better monitoring and asset risk management. Water use scrutiny is rising in western states. Energy reporting is becoming more visible in board-level planning. And food manufacturers face growing pressure to make plants both more efficient and more resilient. IIoT, when properly implemented, supports all three goals. For buyers, the best advice is this: do not purchase an IIoT platform first and then search for a use case. Start with the production and utility constraints that matter most, define the engineering requirements, and choose a deployment structure that can scale. A sound roadmap should connect process, controls, data, installation, and operating behavior. Disruptive Process Solutions supports food and beverage manufacturers across the United States and Canada with an approach built around profitable, well-planned capital execution. Rather than acting as a narrow contractor, the company works as an engineering-led partner that aligns plant improvements with operating realities and commercial goals. That is especially relevant for IIoT projects, where digital visibility only produces value when it fits the actual process, utility infrastructure, and production schedule. From a technology standpoint, DPS brings expertise across process, controls, automation, PLC programming, SCADA, utilities, and complete system integration. That means sensor planning, gateway connectivity, line integration, and dashboard use can be tied directly to how the facility actually runs. From a manufacturing standpoint, DPS also supports complete processing environments across food and beverage sectors, including dairy, proteins, sauces, aseptic systems, brewing, spirits, RTD beverages, and co-packing operations. The team’s process familiarity helps ensure that IIoT projects do not live in isolation from thermal processing, blending, refrigeration, CIP, compressed air, or packaging performance. From a service standpoint, DPS operates through a design-build-manage model that supports planning, engineering, installation coordination, execution oversight, and long-term project accountability. That model is valuable for manufacturers that need more than software support and want a partner that can help bridge feasibility, capital planning, implementation, and field execution. Companies interested in learning more can visit about DPS, review broader service capabilities, and explore selected project case studies relevant to processing and plant integration. For food and beverage operators evaluating long-term modernization, the main advantage of this kind of partner is practical integration. The same organization can help identify whether the bottleneck is instrumentation, controls logic, utility capacity, equipment layout, or operational workflow, and then help execute the right fix rather than forcing every problem into a software-only solution. A limited pilot can often be completed in 8 to 16 weeks, depending on the number of assets, controls complexity, and shutdown availability. Full-plant scaling can take several additional months. Start with assets that create the highest downtime, compliance, utility, or quality impact. In many facilities, that means thermal systems, fillers, refrigeration, boilers, compressors, and CIP skids. No. Many plants can start with read-only data collection from existing PLCs and supplement that with new sensors or metering where needed. Replacement is only necessary when legacy limitations block safe integration or long-term reliability. Dairy, beverages, protein processing, prepared foods, aseptic operations, and co-packing facilities often see the fastest returns because uptime, sanitation, and utility performance have a direct effect on margin and compliance. Alerts should reflect food safety limits, process capability, equipment health, and actual response workflows. Plants should avoid alarm overload and classify alerts by urgency and ownership. Yes. That is usually part of Phase 5. Good integrations can connect downtime, work orders, maintenance planning, utility usage, batch performance, and cost visibility. The biggest mistakes are buying software before defining use cases, ignoring cybersecurity, skipping data governance, failing to involve maintenance and QA early, and underestimating physical installation requirements. Expect stronger use of AI for predictive maintenance, higher pressure for sustainability reporting, more focus on utility optimization, tighter cyber expectations, and broader integration between plant-floor data and enterprise decision systems. -
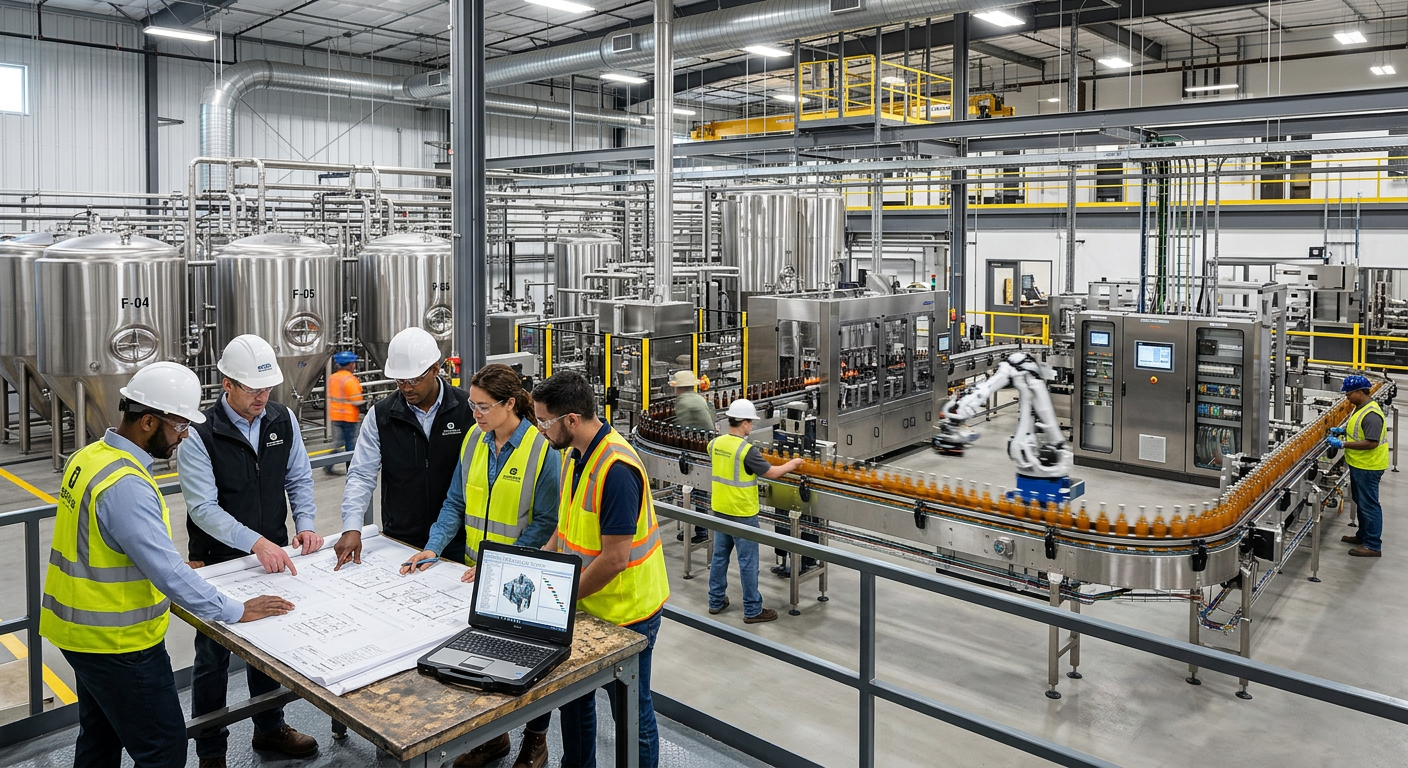
UHT Beverage Processing Systems
Ultra-high-temperature beverage processing is the preferred route for U.S. manufacturers that need commercially sterile, shelf-stable drinks with long distribution windows and reduced cold-chain dependence. A well-designed UHT system rapidly heats product, holds it for seconds at a validated lethal condition, cools it under hygienic control, and transfers it directly to aseptic packaging. In practice, the best system depends on product viscosity, particulate size, package format, plant utilities, target throughput, cleanability, and commercial goals. For manufacturers shipping through hubs such as Chicago, Dallas, Atlanta, Los Angeles, Houston, Newark, and the ports of Long Beach and Savannah, UHT can improve logistics flexibility, open national retail channels, and reduce warehouse risk when integrated correctly. For companies evaluating a new line or retrofit, the most important decision is not simply “buy a UHT skid.” It is choosing the right process architecture: direct or indirect heating, plate or tubular heat exchange, aseptic buffer design, CIP strategy, and line integration with fillers, utilities, controls, and quality systems. That is where an engineering-led partner matters. Disruptive Process Solutions supports food and beverage manufacturers across the United States and Canada with practical engineering, integration, and capital planning aimed at profitable execution rather than overbuilt scope. A UHT beverage processing system sterilizes liquid products by heating them to a very high temperature, typically about 135°C to 150°C, for a very short time, often 2 to 10 seconds, followed by rapid cooling and aseptic filling. In the United States, these systems are widely used for dairy beverages, plant-based milks, creamers, juices, nutritional drinks, concentrates, and ready-to-drink coffee. The right UHT design depends on product sensitivity, viscosity, particulates, desired shelf life, package type, and sanitation needs. For low-viscosity products with minimal fouling, plate systems can be efficient and compact. For products with higher solids, higher viscosity, or particulate risk, tubular systems usually offer better reliability. Direct steam injection or infusion provides fast heating and cooling with strong flavor protection for delicate products, while indirect heating through plates or tubes often offers better utility efficiency and simpler water balance. A complete line should also include homogenization where required, deaeration where beneficial, aseptic surge capacity, validated CIP, automation, and filler-package compatibility. The table above simplifies the buying decision: there is no universal “best” UHT system. The best investment is the system that matches the actual product portfolio, packaging roadmap, sanitation discipline, and utility economics of the plant. UHT processing achieves commercial sterility by combining high temperature with a very short holding period. The core concept is lethality: microorganisms and spoilage enzymes are inactivated based on exposure to a specific time-temperature history. Instead of holding beverages for minutes at lower temperatures, UHT pushes temperature upward so total exposure time can shrink to seconds. This helps preserve flavor, color, and nutritional quality compared with longer thermal treatments. A standard process sequence includes balance tank, feed pump, preheating, optional deaeration, homogenization, final heating, hold tube, flash cooling or indirect cooling, aseptic storage, and aseptic filling. Each element must be engineered so the coldest particle or slowest stream path still receives the validated minimum treatment. Residence time distribution matters. So do pressure relationships, especially where sterile and non-sterile zones meet. In practical plant terms, the thermal profile often looks like this: preheat product from ambient or chilled storage to an intermediate level, then raise it rapidly to sterilization temperature, hold for the validated few seconds, and cool it quickly before packaging. Sensitive products such as premium dairy alternatives or RTD coffee benefit from minimizing total thermal load. More robust products may tolerate broader operating windows. This table shows why thermal design cannot be generic. Even when temperatures appear similar, the limiting factors differ: protein denaturation, particulate safety, flavor retention, oxygen pickup, or fouling. That is why successful U.S. installations typically include thermal validation, flow verification, and controls interlocks that protect legal process conditions. The growth trend above reflects a realistic market direction: expanding demand for shelf-stable beverages, resilient distribution models, and labor-efficient processing. This is especially relevant in the United States, where freight costs, retailer service expectations, and regional co-packing expansion are reshaping investment decisions. Direct and indirect heating achieve the same regulatory outcome but with different thermal mechanics. In direct systems, culinary steam contacts the product directly through steam injection or steam infusion. The product heats almost instantly, then the added water is removed in a flash cooling stage under vacuum. In indirect systems, heat passes across a metal surface, such as a plate or tubular wall, without steam contacting the beverage. Direct heating is often selected when flavor retention is critical. Because heating and cooling are extremely fast, total heat exposure is lower. This helps protect volatile aromatics in products like premium RTD coffee, creamers, and some dairy beverages. The tradeoff is greater system complexity around steam quality, condensate management, flash cooling, and water balance. Plants also need reliable culinary steam production and strong process control. Indirect heating can be easier to integrate into existing utility systems and usually offers excellent energy recovery through regeneration. It is common in high-volume dairy and shelf-stable beverage plants where operating efficiency, compact footprints, and predictable maintenance matter. However, slower heat transfer relative to direct systems may increase thermal impact on the most sensitive formulations. The comparison shows that the decision is commercial as much as technical. A high-margin, flavor-sensitive beverage sold nationally from a California or Texas co-packer may justify direct heating. A large-volume dairy or plant-based line shipping through Midwest and Southeast distribution networks may favor the efficiency of indirect heating. Plate heat exchangers are efficient because of high surface area and turbulent flow, but they are best suited to relatively low-viscosity products with limited particulate content. Tubular systems, including concentric and shell-and-tube variants, provide wider passages and stronger mechanical tolerance for challenging products. They are often chosen for beverages with proteins, fibers, seeds, cocoa, or higher total solids. In the United States market, product complexity is increasing. Oat-based drinks, high-protein shakes, fiber-fortified beverages, coffee mixes, and hybrid dairy-plant products can be difficult to process consistently. These products may shear differently, foul surfaces faster, and have broader viscosity ranges across seasonal formulations. Tubular UHT systems typically offer better robustness when product developers want formulation freedom. Particulates add another layer. Even if the liquid base is pumpable, particle size and distribution change the thermal validation approach. Every particle must receive the minimum process. This may require larger diameter hold tubes, lower shear pumps, and filler-path designs that maintain sterile integrity without damaging inclusions. The practical lesson is straightforward: choose plate systems for thermal efficiency when the product truly fits; choose tubular systems when stability, fouling tolerance, or particulates make narrow channels a risk. A cheaper skid becomes expensive quickly if it limits future products or creates chronic uptime losses. UHT processing only delivers shelf stability when the sterilized product remains protected all the way to final seal. That makes integration with aseptic filling and packaging a mission-critical topic. The UHT processor, aseptic surge tank, sterile valves, filler bowl or tank, package sterilization system, environmental controls, and closure management must operate as one validated sterile chain. In U.S. manufacturing environments, packaging decisions are often driven by channel strategy. Club retail may prefer multi-pack shelf-stable cartons. Convenience and foodservice channels may require PET, HDPE, or bag-in-box. Export lanes moving through Newark, Houston, or Long Beach may prioritize durable formats and high pallet efficiency. Each choice affects line design, filler speed, sterilant handling, package depyrogenation or decontamination, and warehouse planning. Integration is also an automation project. Recipe management, sterile boundary monitoring, pressure cascade logic, alarm handling, and diversion control should be built into a coordinated controls architecture. This is where technological capability matters. DPS supports process, mechanical, electrical, plumbing, structural, and controls engineering, including PLC programming, SCADA, and system integration, which is especially valuable when a filler, UHT skid, utilities, and CIP platform come from different vendors. The chart highlights why integrated aseptic design has become more valuable: demand is broad, not concentrated in one category. A line designed only for today’s SKU may struggle when the commercial team adds high-protein, plant-based, or coffee products next year. UHT is often misunderstood as automatically harsher than other thermal methods. In reality, the short exposure window can protect quality better than longer lower-temperature processes, provided the formulation and equipment are optimized. Nutrient retention depends on the ingredient. Proteins may denature structurally without necessarily losing nutritional value. Some vitamins are heat-sensitive, but oxygen control, formulation buffering, and post-process fortification strategies can reduce impact. Flavor is often the deciding issue. Dairy can develop cooked notes through sulfur compound formation. Plant-based drinks may reveal bitterness, cereal notes, or oxidation if lipid systems are unstable. Coffee can lose aroma or develop stale character if dissolved oxygen is not managed. Color changes may result from Maillard reactions, pigment breakdown, or suspended solids instability. Products with cocoa, tea, fruit, or natural colors need careful process mapping from blend tank to package. Manufacturing capability also influences quality. DPS designs and supplies processing tanks, custom CIP systems, and selected proprietary process equipment, which can support tighter control of blending, hold-up volume, and cleanability. Combined with line integration and commissioning, this reduces the disconnect between formulation intent and real plant performance. The takeaway from this table is that product quality is never only a “formulation issue” or only an “equipment issue.” It sits at the intersection of both. The best UHT outcomes come from teams that coordinate R&D, operations, engineering, sanitation, and packaging from pilot work through startup. UHT economics depend heavily on regeneration. In regenerative heat exchange, outgoing hot product transfers energy to incoming cold product, reducing the external heating and cooling load. This is one of the biggest reasons indirect UHT systems can operate efficiently at scale. In the United States, where steam generation, chilled water capacity, wastewater handling, and utility peak demand all affect project ROI, regeneration can significantly shape payback. Plants in regions with high energy prices, constrained boiler capacity, or aggressive sustainability targets often prioritize regenerative design early. Manufacturers in California, the Northeast, and parts of the Pacific Northwest may place extra emphasis on utility optimization. Gulf Coast and Midwest plants may focus more on expansion capacity and reliability, but energy recovery still matters because it reduces operating cost and carbon intensity. By 2026, more beverage plants are expected to link UHT skids with plant-wide energy dashboards, heat recovery loops, variable-frequency drives, condensate return improvements, and smarter scheduling tied to tariff structures. Policy pressure around emissions reporting and customer pressure around sustainability disclosures are both pushing thermal systems toward better efficiency documentation. The area trend reflects a clear shift: energy recovery is no longer a bonus feature. It is becoming a default expectation in serious capital planning, particularly for multi-line aseptic or high-throughput co-packing environments. Continuous UHT processing succeeds or fails on hygiene and uptime. Fouling occurs when proteins, minerals, carbohydrates, or other solids deposit on heat transfer surfaces. As deposits build, heat transfer falls, pressure drop increases, product quality drifts, and microbial risk rises. Different beverages foul differently. Dairy proteins may form dense thermal films. Plant-based drinks can create starch-like or gum-heavy deposits. Coffee and cocoa products can leave stubborn residues. CIP design must match the product portfolio, not just the base machine. Flow velocity, detergent chemistry, rinse verification, temperature profile, tank sizing, return conductivity logic, and validation documentation all matter. High-throughput operations running long campaigns may need multi-circuit CIP systems, recovery tanks, and automation that sequences filler, processor, blend system, and package-contact components with minimal manual intervention. This is also a core service capability question. DPS works across process engineering, capital planning, installation, commissioning, owner’s representation, project management, and system integration. For manufacturers, that means CIP and fouling management can be addressed not only as a sanitation topic but as a full project discipline that includes utility loads, floor layout, operator access, drain design, instrumentation, and startup training. The explanation is simple: fouling is predictable when you understand the product and the thermal path. Good plants monitor it, design for it, and budget for it before the line is purchased. UHT processing spans a wide product range in the U.S. market. Dairy remains a major application, especially for white milk, flavored milk, creamers, and nutritional beverages. Plant-based products continue to grow, particularly oat, almond, soy, pea, and blended drinks. Juice and juice beverages use UHT when the target is ambient shelf life with broad retail reach. RTD coffee is one of the strongest growth categories, driven by convenience, premiumization, and distribution flexibility. Regional demand patterns matter. The Midwest and Upper Plains remain important for dairy infrastructure. California and the Pacific Northwest are strong centers for plant-based innovation. Texas and the Southeast are expanding in co-packing, warehousing, and logistics. New Jersey and the Mid-Atlantic support import-export and dense retail distribution. That geography changes not only where lines are installed but what products they must run profitably. When manufacturers compare suppliers, they should look beyond skid price. Ask whether the integrator understands both beverage process behavior and plant execution realities. Can the partner tie utilities, controls, filler integration, CIP, and compliance together? Can they support growth from pilot to multi-SKU commercial production? Practical experience across dairy, aseptic, RTD, and utility infrastructure matters. The comparison chart represents what buyers should evaluate in supplier selection. The strongest projects are rarely won on equipment alone; they are won on integration quality, validation readiness, and lifecycle performance. For example, a beverage company building near Atlanta or Dallas may need a line that starts at moderate volume but can scale fast as club and grocery distribution expand. Another company near Los Angeles or the Port of Long Beach may need export-ready aseptic packaging and strong utility resilience. A co-manufacturer in the Carolinas may need rapid turnaround with mixed product runs and flexible CIP architecture. These are not identical projects, even if all are labeled “UHT.” Manufacturing capability matters here as well. DPS supports turnkey installation and integration, and can combine custom equipment supply with field execution. That is useful when a project needs tanks, CIP skids, utility tie-ins, automation upgrades, and aseptic packaging coordination under one accountable structure instead of a fragmented multi-vendor process. For readers wanting a closer look at engineering and execution support, DPS outlines its broader process and project services, its selected equipment capabilities, and representative project examples that show how integrated delivery improves speed and risk control. What temperature qualifies as UHT?In most beverage applications, UHT means heating the product to roughly 135°C to 150°C for a few seconds, followed by aseptic handling and packaging. The exact validated condition depends on the product and target microorganisms. Is UHT the same as aseptic processing?Not exactly. UHT is the thermal sterilization step. Aseptic processing includes the sterile transfer, storage, filler, package sterilization, and sealed packaging steps that preserve commercial sterility after heating. Which is better: direct or indirect UHT?Neither is universally better. Direct systems often provide stronger flavor protection for sensitive beverages. Indirect systems often provide better energy efficiency and simpler integration. The best choice depends on product and plant priorities. When should I choose tubular over plate?Choose tubular when the beverage has higher viscosity, more solids, greater fouling tendency, or particulates. Plate systems usually fit thinner, cleaner products where heat transfer efficiency is the main goal. Can UHT work for plant-based beverages?Yes. UHT is widely used for oat, almond, soy, pea, and blended products. Success depends on stabilization, homogenization, fouling control, and selecting a thermal profile that protects flavor and texture. How long can UHT beverages last?Shelf life varies by formulation, package type, oxygen control, and distribution conditions, but many UHT beverages are designed for several months of ambient storage. Validation should always be product-specific. What are the biggest hidden costs in a UHT project?Common hidden costs include utility upgrades, CIP capacity, aseptic filler constraints, package change parts, automation integration, steam quality issues, startup waste, and insufficient surge or storage design. How important is CIP automation?Very important for continuous or multi-SKU operations. Automated CIP improves repeatability, reduces operator error, supports documentation, and helps maximize uptime between production campaigns. What should U.S. buyers ask suppliers before purchase?Ask about validated product fit, fouling assumptions, residence time distribution, filler integration, utility loads, regeneration efficiency, CIP cycle design, controls philosophy, startup support, and expansion flexibility. What is changing by 2026?Expect more digital monitoring, higher energy recovery expectations, stronger sustainability reporting, broader aseptic packaging flexibility, tighter sanitation data tracking, and more demand for systems that can run both dairy and plant-based portfolios. In summary, UHT beverage processing in the United States is no longer a niche capability reserved for only the largest dairies. It is now a strategic platform for shelf-stable growth across dairy, plant-based, juice, nutrition, and RTD coffee. The winning approach is to engineer the full sterile pathway, not just buy a heater. That means matching thermal method to product, integrating with packaging and utilities, designing for CIP and fouling, and building a line that supports future commercial shifts. For manufacturers who want an execution partner that combines engineering depth, equipment know-how, and project accountability, DPS brings a practical design-build-manage model focused on profitable outcomes. -
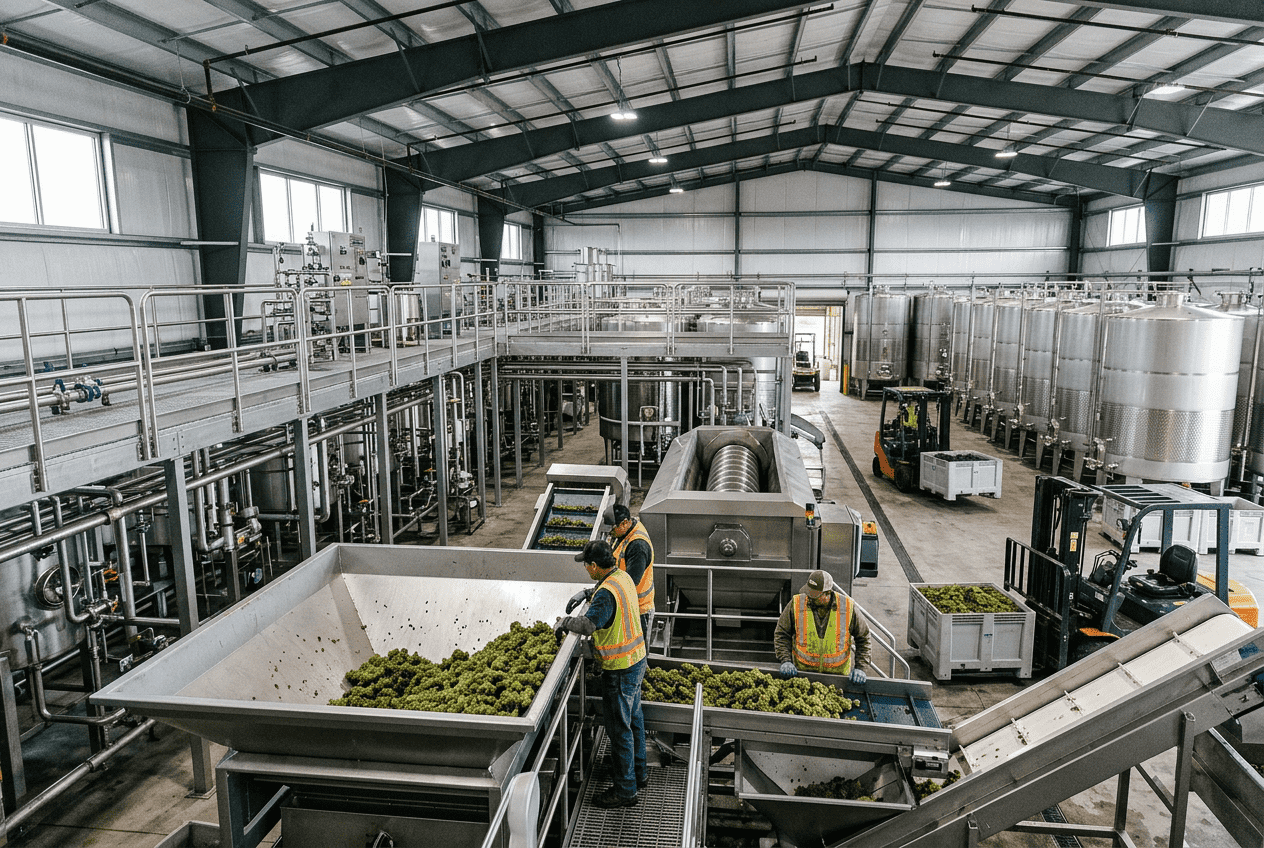
Aseptic Food Processing Systems
Aseptic food processing systems are designed to sterilize product and package separately, then combine them in a sterile environment to produce shelf-stable foods and beverages without refrigeration. In the United States, this technology is widely used for dairy drinks, plant-based beverages, creamers, soups, broths, sauces, nutrition products, and ready-to-drink formulations that need long shelf life, strong quality retention, and efficient national distribution. For manufacturers evaluating capacity expansion, co-packing readiness, or conversion from hot fill or retort, the best aseptic line is not simply the fastest one. It is the one that matches product viscosity, particulates, package format, FDA filing obligations, utility profile, labor strategy, and commercial growth plan. In practical terms, aseptic processing makes the most sense when a brand needs ambient distribution, reduced cold-chain dependence, high throughput, repeatable sterility assurance, and packaging flexibility across cartons, bottles, or pouches. It is especially relevant in U.S. markets shipping through major logistics corridors such as Chicago, Dallas-Fort Worth, Atlanta, Los Angeles/Long Beach, and New Jersey, where transportation efficiency and shelf stability can materially improve margin. This guide explains how the technology works, when it outperforms retort, what equipment matters most, how compliance works under FDA 21 CFR Part 113, and how manufacturers can lower operational cost while protecting product quality. Aseptic processing is a continuous manufacturing method in which a liquid or pumpable food is rapidly heated to commercial sterility, held for a validated time, cooled, and filled into a pre-sterilized container inside a sterile zone. Compared with retort, it usually offers shorter thermal exposure, better flavor retention, higher line efficiency for liquids, and broader packaging options. It is often the right choice for milk, creamers, protein shakes, broths, drinkable soups, sauces, and other low-acid or acidified products that benefit from ambient shelf life and premium quality positioning in the United States. For buyers building or upgrading a line, the key decisions are product type, packaging format, target shelf life, throughput, viscosity range, particulate handling, utility costs, and regulatory pathway. A successful installation typically includes validated UHT processing, sterile surge capacity, reliable CIP/SIP strategy, aseptic filling, and strong automation with data capture. It also requires early input from engineering, operations, quality, packaging suppliers, and a recognized process authority. The U.S. market continues to favor aseptic growth in dairy alternatives, functional beverages, meal solutions, and contract manufacturing. Companies serving national retailers or e-commerce channels often prefer aseptic because it reduces refrigerated storage burdens and widens geographic reach. In regions like California, Texas, the Midwest dairy belt, and the Carolinas, producers are increasingly evaluating aseptic lines as part of broader capacity, utility, and labor optimization programs. The chart above reflects a realistic upward trajectory for aseptic project activity in the United States, driven by shelf-stable beverage demand, co-packing investment, and pressure on refrigerated distribution costs. The expected growth into 2026 and beyond is tied to automation adoption, sustainable packaging development, and tighter operating cost control rather than simple volume expansion alone. An aseptic system has two equally important halves: product sterilization and package sterilization. On the product side, the process usually begins with formulation, blending, standardization, and deaeration where required. The product is then pumped through a thermal system, often ultra-high temperature processing, to achieve commercial sterility. Depending on the formulation, the heat may be delivered through indirect systems such as plate, tubular, or scraped-surface heat exchangers, or through direct systems such as steam injection or infusion. UHT treatment typically exposes product to very high temperature for a very short time. The exact schedule depends on product chemistry, viscosity, particle size, and microbial target, but the principle is consistent: destroy relevant microorganisms while minimizing damage to taste, texture, color, and nutrients. After the hold phase, the product is cooled under controlled conditions and transferred to an aseptic balance tank or surge vessel before entering the filler. On the package side, cartons, bottles, cups, or pouches are sterilized using hydrogen peroxide, heat, UV, or other validated methods depending on the equipment design and packaging material. The filler itself operates within a sterile enclosure using filtered air, controlled overpressure, sterile pathways, and monitored intervention procedures. If the sterile boundary is maintained, the product can be filled and sealed at ambient conditions while remaining shelf stable for extended periods. In U.S. operations, line design must account for product changeovers, allergen segregation, CIP timing, operator access, and startup losses. A beverage co-packer in Southern California will think differently about changeover frequency than a Midwest dairy plant running long campaigns of one SKU. Likewise, a sauce producer near Houston shipping nationwide through Gulf and inland logistics routes may prioritize high-viscosity handling and container flexibility over ultra-high speed. This process table matters because many failures blamed on “the UHT” are actually caused by downstream sterile transfer or filling. In other words, sterilization effectiveness and filler hygiene must be engineered as one system, not separate purchases. Aseptic and retort are both proven methods for producing shelf-stable foods, but they serve different product and business cases. Retort sterilizes product after packaging, usually in cans, jars, trays, or pouches. It is highly effective for products with particulates, chunk integrity requirements, or packaging formats suited to batch or semi-continuous thermal treatment. Aseptic sterilizes product before packaging and is usually better suited to pumpable products, fluid foods, and higher throughputs where quality retention is a priority. For a U.S. manufacturer, the choice often comes down to more than microbiology. It includes capital allocation, packaging strategy, warehouse layout, SKU mix, labor model, and retailer expectations. A premium dairy beverage brand in Wisconsin may benefit from aseptic cartons or HDPE bottles. A soup processor in New Jersey with heavy particulates and multiple foodservice pouch sizes may still prefer retort. A fast-growing co-packer in Texas may choose both technologies to serve a broader customer base. The comparison shows why there is no universal winner. The right technology is the one that fits the product portfolio you want to sell over the next five to ten years, not only the line item you need today. That is why many owners begin with a portfolio-level feasibility study before committing capital. Manufacturers seeking a deeper planning perspective often benefit from a partner that understands both aseptic and retort from the process, utility, and construction sides. DPS approaches projects that way through integrated engineering and execution, and the company’s processing and project delivery services are structured around long-term profitability rather than simply pushing equipment into a plant. Industry demand is strongest where shelf-stable distribution and premium quality intersect. Plant-based beverages, dairy-based nutrition, and co-packing continue to lead because brands want flexibility, speed to market, and fewer refrigerated distribution constraints. The core equipment package in an aseptic line must be selected as a system. Heat exchangers determine heat transfer efficiency, fouling behavior, cleanability, and product suitability. Hold tubes establish the validated residence time needed for lethality. The aseptic filler protects the sterile boundary while meeting desired speed and package format. Around these components are supporting systems including homogenizers, deaerators, sterile valves, product recovery, SIP circuits, CIP skids, filtration, air handling, controls, and utilities. Plate heat exchangers are efficient and compact but best for lower-viscosity, low-particulate products. Tubular exchangers are more robust for viscous products and those with limited particulates. Scraped-surface heat exchangers are valuable for products that foul easily or require gentle movement, such as certain dairy, dessert, and sauce applications. Direct UHT systems can offer superior flavor retention for some beverages but require careful steam quality management and condensate handling. The filler deserves special scrutiny because it often determines practical uptime. Sterile chamber design, package sterilization effectiveness, cap handling, seal integrity, intervention procedures, and automation diagnostics all influence performance. A line that looks excellent on paper can become expensive if filler stops drive high product loss or repeated sterility resets. U.S. buyers should also evaluate utility integration early. Steam quality, hot water systems, glycol, compressed air, water treatment, condensate recovery, and automation network architecture can strongly affect both line performance and total installed cost. This is one reason manufacturers often engage firms with full process and utility integration experience instead of buying isolated skids. DPS brings that systems view through combined process, mechanical, electrical, structural, plumbing, and controls engineering. Its equipment capabilities and broader technical integration background are particularly relevant when an aseptic line must connect with upstream batching, downstream packaging, utilities, and SCADA in one coordinated project. Aseptic processing is highly versatile, but product fit matters. In dairy, common applications include milk, cream, creamers, flavored milk, drinkable yogurt bases, and protein beverages. In beverages, it supports juice blends, plant-based drinks, coffee beverages, tea, nutritional RTD products, and functional formulations. In food, it is widely used for broths, pureed soups, tomato bases, culinary sauces, gravies, and emulsified dressings where the rheology and particulate size are compatible with the selected system. Each category presents distinct engineering challenges. Dairy and high-protein drinks can foul quickly and may require careful homogenization, thermal profiling, and CIP discipline. Acid beverages may be easier microbiologically but still demand package compatibility and flavor protection. Soups and sauces may push the limits of viscosity, shear sensitivity, and particle integrity. Products intended for club stores in the Midwest may prioritize carton cube efficiency, while premium natural retail channels on the West Coast may prefer recyclable bottle formats or differentiated shelf appearance. This table shows that “aseptic capable” is not a yes-or-no label. The details of formulation, particle load, and packaging ambition determine whether the process is straightforward or highly specialized. For manufacturers expanding product portfolios, a staged approach often works best: validate a small family of products first, design flexibility for future SKUs, and avoid overbuilding for hypothetical demand. That approach is common among companies scaling from regional to national distribution through hubs like Chicago, Memphis, and Atlanta. In the United States, low-acid aseptically processed foods are regulated under FDA requirements that include 21 CFR Part 113 for thermally processed low-acid foods packaged in hermetically sealed containers. Compliance is not only about installing the right equipment; it is about validating the process, documenting controls, filing required scheduled processes, and operating within approved parameters. A recognized process authority plays a central role. This specialist reviews the product, formulation, package, thermal process, and intended production method to establish a scheduled process. The manufacturer must then ensure that actual operation matches the filed and validated process. Instrument calibration, deviation handling, recordkeeping, operator training, initial commercial startup discipline, and container closure integrity all matter. For acidified products, related FDA frameworks may also apply depending on the formulation. Many project delays occur because compliance is addressed too late. Equipment is specified before the process authority has finished reviewing particulate limits, formulation changes, or package dimensions. The result can be rework, slower startup, or expensive modifications. That is why early coordination among process authority, OEMs, quality, operations, and engineering is essential. Manufacturers entering aseptic for the first time should treat compliance as a design input, not a final checklist. This is particularly important for multi-state operations or co-packers serving large retail brands that expect strong audit readiness from day one. Packaging choice affects far more than appearance. It influences sterilization method, line speed, seal integrity, freight cost, warehouse density, sustainability claims, consumer convenience, and capital outlay. Cartons remain a leading aseptic option because they offer good cube efficiency and strong shelf presence in dairy and beverage categories. Bottles offer ergonomic advantages and can suit premium RTD products. Pouches can reduce material use and freight weight, making them attractive for certain sauces, soups, and foodservice formats. U.S. brands often choose packaging based on channel. Club and grocery may favor carton efficiency. Convenience and fitness channels may favor bottle portability. Foodservice and back-of-house applications may lean toward pouches. The right answer depends on case pack, pallet pattern, shelf impact, consumer use case, and filling platform compatibility. Packaging selection should be validated with actual distribution conditions. Products moving through humid Southeast summers, dry Southwest warehouses, or long port-to-inland routes from Long Beach or Savannah will not all experience the same abuse profile. Material choice, overwrap strategy, and secondary packaging must reflect the real U.S. supply chain. The comparison chart highlights why cartons and pouches often perform strongly in total value analysis. They score well when freight efficiency, shelf stability, and line economics are considered together, though brand strategy can still justify bottle formats. Aseptic lines can be capital intensive, but they can also be highly efficient when designed correctly. Energy recovery is one of the biggest cost levers. Regenerative heat exchange can recover a significant portion of thermal energy by using hot processed product to preheat incoming product. Steam system optimization, condensate return, hot water loop design, VFD-driven pumps, utility sequencing, and CIP chemical recovery further improve operating economics. In the United States, utility costs vary substantially by region. A plant in California may focus heavily on water and electricity management, while a Midwestern dairy processor may target steam efficiency and winter heat recovery. Facilities near Gulf Coast industrial zones may have different utility pricing than plants in the Northeast. Therefore, operational cost optimization should be location-specific, not generic. Good automation also lowers cost. Recipe control reduces startup waste. Better instrumentation limits overprocessing. Predictive maintenance prevents unnecessary sterile resets. Historian data helps engineering teams identify fouling rates, valve failures, and filler microstops that quietly erode margin. These gains become even more important in 2026 and beyond as labor availability, sustainability reporting, and energy volatility remain major operational pressures. DPS is well positioned in this area because its capabilities span process engineering, controls, SCADA, utility integration, installation, and project management. Rather than treating the sterilizer, filler, and boiler room as separate scopes, the company’s design-build-manage model aligns process performance with commercial profitability. Manufacturers exploring plant-wide optimization can review the DPS approach and leadership perspective to understand how that philosophy differs from a conventional equipment-only purchase. The trend shift toward aseptic is supported by rising interest in ambient distribution, product quality, and sustainable operations. By 2026, more buyers are expected to compare technologies through total delivered cost, carbon implications, and labor resilience rather than just installed equipment price. The most expensive aseptic failures usually come from weak interfaces, not obvious machine defects. Common issues include incomplete sterilization due to incorrect flow assumptions, package contamination, poor seal integrity, CIP dead legs, instrument drift, excessive fouling, and unplanned filler interventions that compromise sterile conditions. Many of these failures are preventable through better hygienic design, validation, operator training, and data review. A useful rule for U.S. manufacturers is to investigate failure in layers: product design, equipment design, utility stability, automation logic, operator behavior, and packaging consistency. For example, a short shelf-life event may actually begin with formulation solids variation that changes viscosity, which alters heat transfer, which increases fouling, which drives filler stops, which increases interventions. Without disciplined root-cause analysis, teams often fix the wrong problem. The table shows that prevention is multidisciplinary. Quality alone cannot solve a filler sterility problem, and maintenance alone cannot solve recurring fouling if the process design is wrong. Effective prevention requires coordinated engineering, operations, QA, and supply chain decisions. For buyers seeking practical examples, reviewing real project work is often more useful than reading brochures. DPS has supported food and beverage manufacturers across North America with integrated capital projects, and its project case studies provide a useful window into how execution strategy affects speed, cost, and long-term performance. Products with pumpable flow behavior and strong need for ambient shelf life are the best candidates. These include dairy beverages, plant-based drinks, protein shakes, creamers, broths, smooth soups, gravies, and many sauces. The final answer depends on viscosity, particle size, package format, and thermal sensitivity. Not universally. Aseptic is often better for fluid foods and beverages where quality retention and high continuous throughput matter. Retort remains very strong for products with larger particulates, meal components, or packaging formats that benefit from in-package sterilization. A full project can range from several months to well over a year depending on equipment lead times, building modifications, utility scope, process authority coordination, and startup complexity. Early planning reduces delays more than aggressive purchasing alone. The largest drivers are sterilization technology, filler type, package format, automation level, clean utility systems, building modifications, and overall integration scope. A line may look affordable until sterile air, water treatment, CIP, boilers, controls, and downstream packaging are included. Yes, for regulated aseptic low-acid applications in the United States, a recognized process authority is a critical part of validation and filing. Their involvement should begin early, before finalizing the process envelope and package assumptions. Cartons are very common for milk, creamers, broths, and plant-based beverages. Bottles are common for protein drinks and convenience-oriented products. Pouches are increasingly attractive for soups, sauces, and foodservice because of freight and material efficiency. Focus on regenerative heat recovery, steam and condensate optimization, smart CIP design, stable utilities, reduced filler downtime, better changeover planning, and stronger automation analytics. The lowest-cost plant is usually the one with the fewest repeated disruptions. Expect continued growth in sustainable packaging, stronger digital validation and data capture, more predictive maintenance, tighter water and energy management, broader use of automation in sterile operations, and increased scrutiny on project ROI. Policy and retailer pressure will also keep pushing manufacturers toward measurable sustainability outcomes rather than generic claims. Look for a company that understands process, packaging, utilities, controls, construction, compliance, and startup together. In practice, that means evaluating technical depth, field execution history, honesty during feasibility, and willingness to challenge weak assumptions. DPS is a strong fit for manufacturers that want engineering depth, installation capability, and disciplined project management in one accountable model, especially across complex food and beverage portfolios in the United States and Canada. Clear commercial objectives, realistic demand forecasting, early process authority input, thorough package testing, integrated utility design, operator training, and a startup plan that treats sterile reliability as a business outcome, not just an engineering milestone. In summary, aseptic processing systems can be powerful profit drivers when they are specified around product reality, compliance requirements, and distribution economics. For U.S. manufacturers balancing growth, quality, and operating cost, the winning strategy is rarely to buy the biggest machine. It is to design the right system, connect it to the right utilities and packaging, and launch it with the right operational discipline. -
Fermentation System Design Services
Fermentation system design in the United States is no longer just about buying a tank. It is about aligning vessel geometry, cooling, sanitation, controls, yeast handling, carbonation, utilities, and plant layout with a profitable production model. For breweries, distilleries, kombucha brands, RTD manufacturers, dairy fermenters, ingredient processors, and specialty food producers, the right system improves yield, reduces downtime, protects flavor consistency, and supports regulatory compliance. In practice, a well-designed fermentation platform should answer a few core questions early: What product are you making? How much heat will the process generate? Will the vessel hold pressure? How will you clean it? How will yeast or culture be harvested and reused? What data do operators need in real time? And how easily can the cellar scale from pilot runs to commercial output? Across major U.S. production corridors such as California, North Carolina, Texas, Illinois, Wisconsin, Colorado, and the Northeast beverage belt, manufacturers are investing in integrated fermentation systems that combine process equipment, controls, utilities, and installation planning. This is especially true near logistics hubs like Los Angeles and Long Beach, Houston, Chicago, Charlotte, and New York, where supply chain efficiency and plant uptime directly affect margins. The best fermentation system design depends on product style, batch size, residence time, pressure needs, sanitation strategy, and future expansion plans. Conical fermenters are often preferred for yeast collection and solids separation. Uni-tanks combine fermentation and carbonation or conditioning in one pressure-rated vessel, reducing transfers. Straight cylindrical vessels can be cost-effective for specific low-pressure or specialty applications. Most modern U.S. projects also require glycol jacket sizing, dissolved oxygen control, clean-in-place validation, automated monitoring, and a scale-up roadmap that matches utility capacity and floor space. For buyers evaluating a new cellar or process room, the most reliable path is an engineering-first approach. That means defining process goals before equipment selection, validating heat load and CIP coverage, modeling production throughput, and checking code, safety, and sanitary requirements before installation begins. The table above shows why fermentation design is best treated as a system, not a standalone vessel purchase. In many U.S. facilities, the real constraints are utilities, controls, operator access, and cleaning validation rather than tank volume alone. Fermenter geometry affects nearly every downstream outcome: yeast handling, sediment removal, carbonation options, cycle time, floor loading, and operator workflow. In U.S. beverage production, conical fermenters and uni-tanks dominate because they simplify solids collection and offer operational flexibility. However, straight-wall cylindrical tanks still have value in certain pilot, aging, blending, or specialty fermentation applications. Conical fermenters are especially useful when yeast harvesting matters. The cone promotes settling and concentrated collection, helping operators remove trub, recover healthy yeast, and reduce product loss. This makes conicals common in brewing, some cultured beverage applications, and fermentation steps involving biomass separation. Uni-tanks go further by combining primary fermentation and secondary conditioning in a single pressure-capable vessel. For breweries and carbonated fermented beverages, that means fewer transfers, lower oxygen pickup risk, and less cleaning labor. Uni-tanks are often favored by fast-growth regional producers in states like Colorado, Oregon, North Carolina, and Texas where throughput efficiency matters. Cylindrical vessels without a full cone may be selected where solids separation is less critical, where products are transferred quickly, or where the process is more focused on mixing, holding, or controlled conversion rather than repeated yeast cropping. These can also be useful in pilot systems or in hybrid food-and-beverage plants where multiple process uses are expected. This comparison shows that there is no universal “best” tank. The right choice depends on product behavior, turnover expectations, pressure requirements, and whether the vessel is part of a larger automated process line. For manufacturers seeking a broader systems view, it helps to evaluate tank selection alongside utilities, controls, and installation planning. A partner with integrated process engineering and project delivery services can usually identify hidden tradeoffs before procurement locks in the wrong platform. Temperature control is often the most underestimated part of fermentation design. Fermentation generates heat, and that heat must be removed at the right rate to maintain product quality. If cooling is undersized, the vessel may drift outside target temperature bands, leading to unwanted flavor development, inconsistent attenuation, stalled fermentation, or slow turnaround times. In most U.S. beverage installations, glycol is the preferred medium for vessel cooling because it supports low operating temperatures, stable control, and practical integration with cellar piping. A complete design should evaluate jacket zone placement, glycol supply temperature, return temperature, pump flow, control valves, insulation, and chiller redundancy. Large climate swings matter. A facility in Phoenix or Houston faces very different heat rejection conditions than one in Minneapolis or Portland. In the Southeast, summer ambient conditions can burden glycol systems and mechanical rooms if load assumptions are too optimistic. That is why thermal sizing should include batch overlap, crash cooling demand, pull-down targets, and future expansion. The table above highlights why “tank cooling” is really a plant utility design issue. Cooling must be sized not only for current tanks but also for future cellar additions, seasonal peaks, and simultaneous operations such as bright tank cooling, syrup room loads, or adjacent process demands. Engineering firms with broad utility experience can help align fermentation loads with chillers, cooling towers, pumps, PLC controls, and piping routes. DPS, for example, supports projects that combine process engineering with utilities, automation, and installation execution, which is especially valuable on expansion-heavy sites. Oxygen management can either support a healthy fermentation start or create flavor instability and shelf-life problems. The design goal is not simply “add oxygen” or “avoid oxygen.” It is to control when oxygen is introduced, how much is dissolved, and how exposure is prevented later in the process. For yeast-driven beverage fermentation, oxygen may be intentionally introduced before or at pitching to support growth and metabolic performance. Beyond that point, oxygen ingress usually becomes undesirable. Poor transfer design, leaky fittings, bad gasketing choices, and non-purged receiving tanks can all raise dissolved oxygen and damage product quality. U.S. producers increasingly specify sanitary inline aeration, sterile filtration, dissolved oxygen sensors, low-shear transfer pumps, and CO2 purging routines. These are especially useful in premium craft beverages, kombucha, functional drinks, and products destined for national distribution where shelf stability matters. In practical terms, oxygen management should cover inlet gas quality, transfer line design, tank purging, headspace management, valve specification, and instrument placement. Facilities shipping from coastal gateways such as Long Beach, Newark, Savannah, or Houston often prioritize this because transit time amplifies the cost of flavor drift. The explanation here is simple: oxygen must be managed as part of the process sequence, not treated as a standalone instrument issue. Good design reduces both biological variability early and oxidative damage later. Pressure-rated fermentation tanks create important flexibility for U.S. producers making beer, cider, kombucha, hard tea, sparkling wine-style beverages, or carbonated functional drinks. When the vessel is designed and certified for pressure service, operators can ferment, spund, condition, and sometimes carbonate in the same tank, reducing transfer steps and product exposure. However, pressure service is not an accessory. It affects vessel wall design, nozzles, manways, valves, relief protection, instrumentation, controls, and code compliance. Buyers should confirm the required operating pressure, test pressure, allowable temperature range, and intended gas service well before ordering. Carbonation integration also requires attention to stone placement, gas regulator stability, residence time, agitation or circulation strategy if used, and downstream transfer conditions. A pressure-capable tank without a well-designed carbonation system may still produce inconsistent dissolved CO2 results. For plants in the United States, pressure-rated tank decisions often intersect with insurance review, jurisdictional expectations, and maintenance procedures. This is why experienced project teams typically coordinate process goals with mechanical design and controls from the start. Manufacturing capability matters here. DPS not only supports engineering and integration but also develops branded process equipment such as storage and processing tanks and custom CIP systems. That equipment perspective can be useful when pressure design, utility tie-ins, and sanitation standards need to work together instead of being handled by disconnected vendors. Yeast management has a direct effect on cost, consistency, and fermentation speed. In facilities where yeast is reused, the design of the cone, dump ports, piping, storage vessels, and pitch lines becomes a critical operational issue. A strong system allows clean harvesting, controlled storage temperature, accurate pitching volumes, and minimal contamination risk. Harvesting starts with vessel geometry and bottom outlet design. The goal is to separate trub, non-viable cells, and healthy yeast fractions in a repeatable way. Once collected, yeast may move to brink tanks or other storage vessels with cooling and gentle agitation depending on the process. Pitching systems should then deliver accurate cell mass or slurry volume to the next batch under sanitary, low-stress conditions. For many mid-sized U.S. breweries and fermented beverage operations, the financial benefit is significant. Better yeast handling reduces culture waste, lowers batch variability, and decreases the chance of unplanned repitch failures. In larger plants, automation can extend these gains through recipe-linked pitch routines and digital records. The explanation behind this table is straightforward: yeast handling is one of the easiest places to lose value quietly. Good engineering prevents avoidable waste and supports consistent fermentation economics. Clean-in-place design is one of the most decisive factors in long-term fermentation performance. A vessel that ferments well but cleans poorly will eventually create downtime, contamination events, excessive chemical consumption, or difficult audits. CIP must be considered during vessel selection, nozzle placement, spray device choice, slope design, drainability review, and piping layout. Effective sanitation design includes verified spray coverage, correct flow and pressure, proper return routing, chemical compatibility, temperature capability, isolation strategy, and documented sequences. Dead legs, poorly oriented tees, trapped lines, oversized branch lengths, and inaccessible sample points are common sources of trouble in both legacy retrofits and rushed greenfield projects. For food and beverage plants in the United States, sanitation design also intersects with compliance expectations under FDA, USDA, SQF, and BRC frameworks depending on the application. Fermented dairy, cultured ingredients, alcoholic beverages, and mixed-use co-packing sites all carry slightly different sanitation priorities, but the underlying engineering principles remain the same. Service capability is especially important in this section. DPS operates with a design-build-manage approach that combines engineering, installation oversight, and execution management. For sanitation-intensive projects, that type of coordination helps ensure that the system designed on paper is the same system installed, tested, and handed over in the field. Well-designed CIP is not just a sanitation issue; it is a capacity issue. If cleaning takes too long or requires too much manual intervention, tank utilization drops. In high-throughput regions like Southern California, Central Texas, and the Carolinas, that lost capacity can quickly become the plant’s true bottleneck. Modern fermentation systems increasingly depend on real-time data rather than shift-end guesswork. The most useful variables often include temperature, pH, specific gravity or density, pressure, dissolved oxygen, level, and sometimes conductivity or flow depending on the system. When integrated into PLC and SCADA platforms, these points improve consistency, shorten troubleshooting time, and build more reliable batch records. Temperature remains the foundation, but pH and gravity trends are equally valuable. They reveal whether fermentation is starting on time, progressing normally, and reaching endpoint as expected. Inline or at-tank sensors can reduce manual sampling frequency and help operators catch deviations earlier. That matters for both pilot environments and large commercial cellars. Technology capability becomes a differentiator here. DPS supports controls engineering, PLC programming, automation, and SCADA integration across process systems. That matters because many fermentation issues are not caused by the vessel itself but by weak sequencing, poor alarms, lack of trend visibility, or manual data entry errors. In the U.S. market, manufacturers are also asking for remote visibility, recipe-linked control logic, historian functions, alarm escalation, and energy monitoring. These features become more important as labor constraints persist and multi-site operators seek standardized production methods across facilities. Scaling fermentation from pilot to commercial production is one of the most important challenges in process design. A successful pilot proves that a product can work. A successful production cellar proves that it can work profitably, repeatedly, and at the required service level. The gap between those outcomes is usually larger than expected. Scale-up affects thermal response, oxygen transfer, mixing behavior, hydrostatic pressure, residence time, cleaning coverage, utility demand, and operator workflow. A 5-barrel or 100-gallon pilot system may produce an excellent result that behaves differently in a 200-barrel or multi-thousand-gallon vessel. That is why scale-up planning should include engineering assumptions, control philosophy, utility infrastructure, and future capacity blocks. Across the United States, this challenge shows up in many forms: a kombucha company moving from local distribution in Austin to national retail; a craft brewer in Charlotte expanding into contract packaging; a dairy processor in Wisconsin launching cultured beverages; or a co-packer near Chicago adding fermentation to an existing blending and filling campus. Manufacturing and installation capability both influence scale-up success. DPS supports turnkey system integration and physical installation across North America, including utilities, process equipment, controls, and commissioning. That broader execution model helps clients connect pilot learnings to production-ready facility design instead of treating them as separate projects. This table shows why scale-up must be linked to capital planning. The most expensive mistake is often not overspending on a tank, but underplanning for utilities, controls, sanitation, and expansion sequence. When buyers compare suppliers, they should ask whether the provider can support only equipment sales or the full process path from feasibility through commissioning. Reviewing project examples and case experience can help clarify that distinction. What is the best fermenter design for a growing U.S. brewery?For many breweries, a pressure-rated uni-tank offers the best mix of fermentation, conditioning, and carbonation flexibility. If frequent yeast harvesting is central to the operation, conical geometry remains essential. How do I size a glycol system for fermentation tanks?Start with peak fermentation heat load, crash cooling demand, simultaneous tank usage, piping losses, insulation performance, and future capacity. Chiller sizing should be based on realistic operating scenarios, not nameplate tank volume alone. Do all fermentation tanks need to be pressure rated?No. Pressure rating is necessary when fermentation under pressure, carbonation, pressurized transfer, or integrated conditioning is part of the process. If the product and operating model do not require it, a lower-pressure design may be appropriate. Why is dissolved oxygen control so important?Because oxygen affects both fermentation health and finished product stability. Controlled oxygen at pitching may be beneficial, while uncontrolled oxygen later can reduce flavor quality and shelf life. What should I look for in a CIP-ready fermenter?Look for verified spray coverage, hygienic fittings, proper drainability, minimal dead legs, correct material finish, and a documented cleaning sequence that fits your plant chemistry and utility setup. Can fermentation controls be added later?Yes, but retrofits often cost more and may not fully solve sensor placement or wiring limitations. It is usually better to plan for temperature, pH, gravity, pressure, and key alarms at the beginning. How do I scale from pilot to production without losing quality?Use pilot data to define temperature profiles, oxygen strategy, sanitation requirements, and residence time assumptions, then validate those against utility loads and vessel geometry at production scale. What industries beyond brewing need fermentation system design?Kombucha, spirits, wine, cultured dairy beverages, ingredients, plant-based fermentation, specialty food production, and co-packing operations all benefit from engineered fermentation systems. What should I ask a fermentation system supplier in the United States?Ask about vessel code compliance, sanitary design, controls capability, CIP validation, utility integration, installation oversight, commissioning support, and whether they can support future expansion in multiple states. Who is a good fit for DPS?Manufacturers looking for process engineering, capital planning, installation integration, automation, and execution management under one partner are typically a strong fit. You can learn more about the company and its approach or review its process equipment capabilities. In the United States, demand for fermentation equipment and system design is expanding across alcoholic beverages, low- and no-alcohol innovation, cultured dairy, functional drinks, ingredient processing, and specialty food manufacturing. Buyers are no longer selecting vessels in isolation. They are evaluating entire production ecosystems: utilities, automation, sanitation, carbon footprint, labor efficiency, and expansion strategy. From a buying standpoint, the smartest process is to define business goals first. Are you building a pilot room, a regional production cellar, or a high-throughput co-packing facility? Are you producing in California for West Coast retail, in Texas for central distribution, or in the Carolinas for East Coast growth? Location affects labor availability, utility cost, permitting pace, logistics access, and climate load. Plants near ports like Long Beach, Houston, Savannah, and Newark may prioritize broader packaging and export flexibility, while inland hubs like Chicago, Kansas City, and Columbus may focus on truck distribution and network reach. Applications also vary. Brewing values yeast recovery and pressure conditioning. Kombucha may require precise acid balance and oxygen control. Distillation-related fermentation focuses on conversion efficiency and clean vessel turnover. Cultured dairy and food fermentation often demand tighter sanitary validation and compliance alignment. That is why the best supplier is often the one that understands the application, not just the hardware. Looking toward 2026, three trends stand out. First, automation will deepen, with more inline sensing, remote diagnostics, and historian-driven optimization. Second, policy and compliance pressure around water, wastewater, and energy use will push plants toward more efficient CIP loops, heat recovery, and right-sized utility infrastructure. Third, sustainability expectations will reshape capital projects, driving interest in lower chemical consumption, better insulation, modular expansion, and more resilient system design. For manufacturers planning new projects, it is worth choosing a partner that can bridge technological capability, manufacturing capability, and service capability. That means understanding controls and data, fabricating or supplying fit-for-purpose equipment, and managing the field execution required to turn design intent into operating reality. -
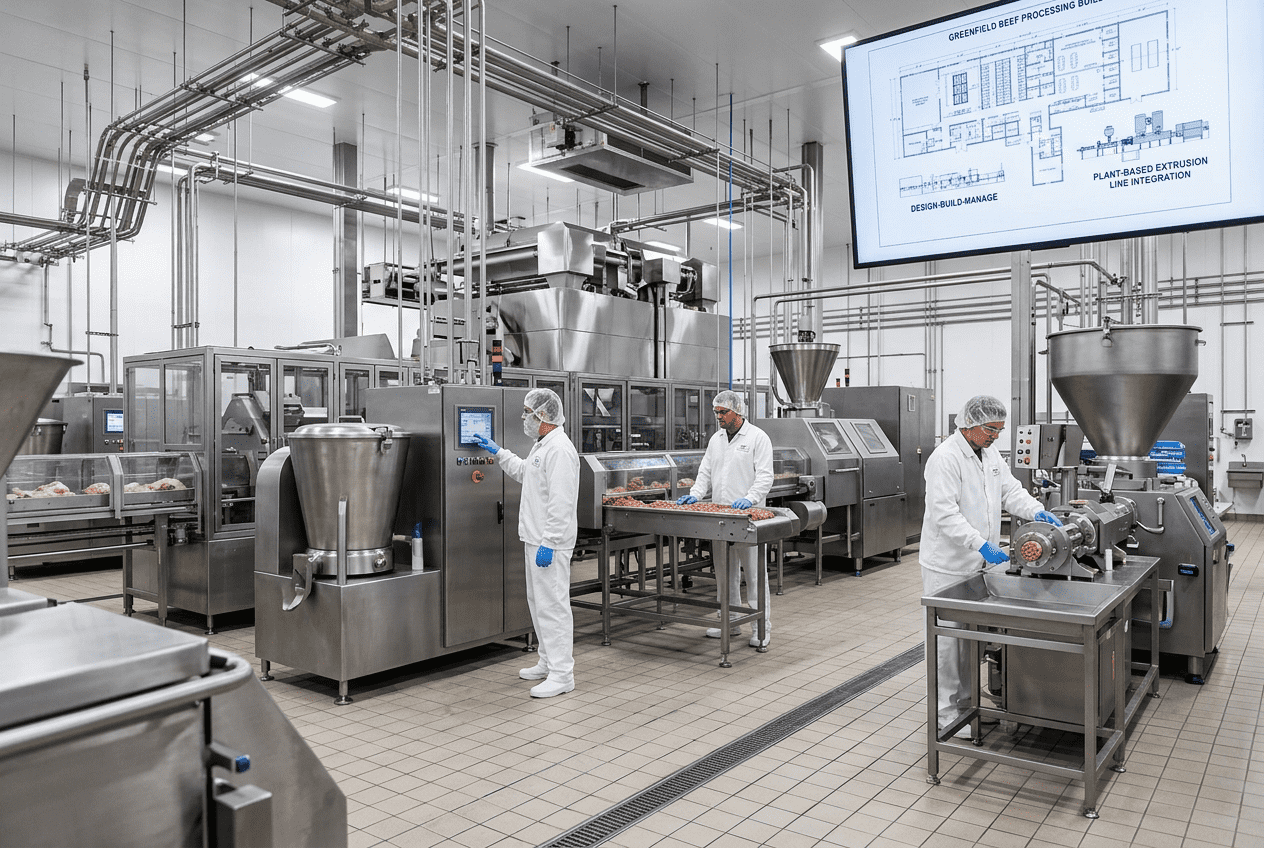
Historian Data Management for Food Plants: Time-Series Process Intelligence
Across the United States, food and beverage manufacturers are under pressure to improve yield, protect product quality, reduce downtime, prove compliance, and make faster capital decisions. A historian data management platform helps plants do that by collecting high-frequency process data from equipment, utilities, automation systems, and quality checkpoints into a structured time-series environment. In practical terms, it gives plant leaders a trusted operational memory: what happened, when it happened, why it happened, and how often it happens. For facilities in major production corridors such as Fresno, Chicago, Dallas-Fort Worth, Charlotte, Milwaukee, Houston, and the Central Valley, historian systems are becoming a core part of digital plant infrastructure. Whether the operation produces sauces, dairy beverages, protein products, fermented drinks, shelf-stable foods, or aseptic products, the value is similar: capture the data once, contextualize it correctly, and use it for operations, quality, maintenance, and continuous improvement. A historian data management system for food plants is a specialized time-series database that continuously captures process values such as temperature, pressure, flow, tank level, conductivity, Brix, pH, line speed, valve states, alarms, and batch events. In the United States market, the best solutions are built to support food safety, operational efficiency, traceability, and regulated recordkeeping. They connect with PLCs, SCADA, MES, LIMS, and ERP platforms so teams can trend performance in real time, investigate deviations, verify cleaning cycles, compare shifts, and support continuous process verification. Plants typically invest in historian architecture when they need to solve one or more of the following issues: For U.S. food plants, an effective historian should not be viewed as a standalone software purchase. It should be engineered as part of plant architecture, with clear tag strategy, network segmentation, cybersecurity controls, data retention design, reporting logic, and business ownership. That is especially true in facilities tied to large retail, foodservice, export, or co-packing networks near ports such as Los Angeles/Long Beach, Savannah, Newark, and Houston, where traceable process intelligence can directly affect customer acceptance and shipment continuity. The market is also evolving. By 2026, more U.S. processors are expected to combine historian data with predictive analytics, anomaly detection, sustainability reporting, and enterprise-wide digital twins. Plants planning upgrades today should choose an architecture that can scale beyond simple trending. The backbone of a historian platform is the time-series database. Unlike a traditional relational database, a time-series engine is optimized for storing millions of timestamped values efficiently. In a food plant, each signal, or tag, represents an observable process point. That may include a steam pressure transmitter on an HTST skid, a valve position on a CIP loop, a load cell under a blend tank, a filler speed counter, a pasteurizer chart signal, or a compressor discharge temperature. A strong tag-based design begins with classification. U.S. food manufacturers often benefit from grouping tags into these layers: This table matters because poor tagging is one of the most expensive hidden mistakes in historian projects. If a plant only logs alarms and a few analog values, it may still lack the process context needed to explain a deviation. Conversely, oversampling noncritical points can create unnecessary storage and administration burdens. The right approach balances speed, resolution, event logic, and business purpose. At architecture level, most U.S. installations include edge data collection from PLCs and SCADA nodes, buffering for network interruptions, a central historian server or clustered environment, and downstream dashboards or analytics tools. Facilities with multi-site operations often standardize on naming conventions such as area-line-unit-parameter-state to support corporate reporting across sites in North Carolina, California, Texas, Wisconsin, and the Midwest. For manufacturers planning expansion, it is wise to architect for future load. A greenfield beverage site may start with 8,000 to 15,000 tags, while a mature multi-line protein or dairy plant can exceed 50,000 tags once utilities, packaging, warehousing, and environmental systems are included. The chart above reflects the broader market trajectory: adoption of process historians in U.S. food and beverage is increasing as plants modernize around labor shortages, traceability demands, and smarter capital planning. Not every food facility falls under the same regulated framework, but the expectations around trustworthy records continue to rise. Historian systems used in aseptic processing, dairy, nutrition products, high-risk ready-to-drink lines, and certain pharmaceutical-adjacent environments must support a defensible data integrity strategy. In practical terms, that means complete audit trails, secure user access, synchronized timestamps, protected configuration changes, and retention policies aligned to product risk and regulatory obligations. For U.S. plants, the main concern is not simply storing data. It is proving that the data is attributable, legible, contemporaneous, original, accurate, and retained appropriately. A strong historian design should therefore include role-based permissions, electronic change logging, backup policies, time synchronization across automation assets, and documented procedures for review and exception handling. The explanation behind this table is straightforward: data integrity is both a compliance issue and a production issue. If a pasteurization record cannot be trusted, a plant may hold product. If CIP confirmation cannot be demonstrated, production restart may be delayed. If access rights are too broad, configuration mistakes can propagate unnoticed. The right historian platform reduces these risks. Retention policy design should be specific, not generic. Many U.S. processors define different retention windows for high-frequency critical control data, lower-frequency utility data, alarm history, batch records, and archived reports. Some also preserve longer-term compressed data for corporate benchmarking. This is especially useful for groups operating multiple sites across the Southeast, Midwest, and West Coast where common records support network-level quality comparisons. One of the fastest ways a historian creates value is through real-time trending and deviation detection. Instead of waiting for end-of-shift review or customer complaints, teams can see process drift while production is still running. In food plants, this can mean catching a heat exchanger fouling trend before lethality margins tighten, identifying unstable carbonation before package defects rise, or detecting underperforming glycol loops before tank cooling is compromised. Deviation detection should go beyond simple alarms. The best systems use layered rules such as limit checks, rate-of-change alerts, duration logic, state-based conditions, and cross-variable relationships. For example, a CIP cycle may be considered abnormal not only when conductivity drops below target, but when the low conductivity condition persists during a specific step while return temperature also lags expected profile. This table shows why event logic should be engineered around process knowledge, not just software capability. The most useful alerts are those tied to actionable root causes and commercial consequences. Demand is especially strong in beverage, dairy, and aseptic applications because these sectors rely heavily on high-resolution process verification and utility reliability. A historian only becomes a true operational intelligence platform when it is integrated well. In most U.S. food plants, SCADA provides live supervisory control, MES manages production execution and work order context, and LIMS handles lab and quality results. The historian sits between real-time control and higher-level analysis, making it a bridge for unified data flow. Integration with SCADA allows direct collection of analog, digital, alarm, and event data. Integration with MES adds production order, SKU, lot, batch, shift, and downtime context. Integration with LIMS connects in-process and final quality results such as micro, pH, solids, moisture, viscosity, or sensory release data. When these streams are aligned by time and batch, plants can compare what the process was doing against what quality ultimately measured. For example, a dairy beverage plant in California may correlate homogenizer pressure, UHT outlet temperature, and filler bowl level with final viscosity and package defects. A protein facility in Arkansas may tie smokehouse temperature uniformity, line speed, and cook yield to customer complaint trends. A co-packing beverage site near Atlanta may analyze utility loads, syrup room timing, and filler performance by customer SKU. None of that works reliably if the systems remain isolated. The explanation here is important: integration is not just connectivity. It is context engineering. Many failed digital projects technically connect systems but never standardize naming, batch timing, asset hierarchy, or exception handling. That leaves teams with more data but not more clarity. Companies seeking broader project support often benefit from partners that can align controls, utilities, process equipment, and execution strategy together. Firms with end-to-end engineering and integration experience, such as food and beverage engineering service teams, are often better positioned to avoid fragmented implementations than software-only vendors. Continuous Process Verification and Statistical Process Control are natural extensions of historian use. Once a plant trusts its process records, it can move from reactive troubleshooting to statistical management. Historical data enables baseline models, control charts, capability analysis, golden batch comparison, and predictive thresholds. In a U.S. food environment, CPV often focuses on parameters with direct impact on safety, consistency, shelf life, and cost. SPC is then applied to identify common-cause versus special-cause variation. Together, they help answer practical questions: Is the cooker drifting over time? Are line one and line three behaving differently for the same SKU? Is one shift consistently overfilling? Is a utility bottleneck creating hidden process variation during summer demand peaks in Texas or Florida? Adoption is rising because CPV and SPC convert historian data into measurable financial outcomes. Reduced product giveaway, tighter process capability, fewer holds, faster root-cause analysis, and better scheduling confidence all support margin improvement. The point of this table is that CPV and SPC are not abstract quality programs. They are use-case driven and should start where process variation has the greatest cost or compliance consequence. Technical specification matters as much as software selection. Plants should define engineering requirements before procurement so vendors are bidding against the same scope. That includes tag counts, polling rates, failover expectations, cybersecurity standards, ISA/IEC-aligned network boundaries, user roles, backup methods, report needs, and integration obligations. For food and beverage operations, three capability areas deserve special focus. First is technological capability: the historian environment must support controls integration, PLC communications, SCADA interoperability, secure remote support, analytics readiness, and utility monitoring. Second is manufacturing capability: the system must fit actual plant operations such as fermentation, distillation, pasteurization, retort, batching, CIP, refrigeration, compressed air, and packaging line synchronization. Third is service capability: successful implementation requires project management, commissioning, training, documentation, and long-term support—not just installation. Organizations with broad plant execution experience, including teams that handle process engineering, controls, utilities, and site coordination, can often design historian programs that align better with real production needs. That is one reason some manufacturers look to integrated partners with backgrounds in complete processing systems, project delivery, and automation rather than relying only on a software reseller. You can review examples of broader equipment and system capabilities at processing equipment and integration resources. Another key engineering requirement is environmental fit. Plants in humid Gulf Coast conditions, high-throughput Midwest protein operations, and West Coast aseptic beverage sites can have different utility patterns, washdown conditions, and network architecture needs. Historian implementation should reflect those realities rather than forcing one generic template across every location. This comparison highlights a recurring market lesson: platform success depends heavily on process understanding and implementation quality, not only the software license. The best historian projects in the United States follow a phased roadmap. They start with business outcomes, continue through data architecture and controls integration, and end with user adoption and governance. Plants that skip these steps often end up with dashboards nobody trusts. A practical roadmap usually includes assessment, design, pilot, rollout, optimization, and sustainment. During assessment, the team identifies critical process areas, existing automation assets, pain points, and compliance requirements. During design, the project defines tag standards, naming hierarchy, network architecture, redundancy, reports, and integrations. During pilot, a high-value area such as pasteurization, CIP, packaging, or utilities is implemented first. Rollout expands by line or unit operation. Optimization adds SPC, KPIs, and event analytics. Sustainment formalizes ownership, training, and change control. Best practices include: When selecting partners, plants should favor teams with direct food and beverage execution experience, not generic industrial automation alone. A project may need understanding of CIP chemistry, aseptic boundaries, retort records, glycol balancing, syrup room timing, smokehouse profiles, or blending logic. Integrated delivery firms can often bring those disciplines together with stronger accountability. For examples of project outcomes and field execution, see selected process project case studies. Looking toward 2026, project roadmaps should also include future-ready elements: energy intensity dashboards, water-use normalization, carbon reporting interfaces, AI-supported anomaly detection, and stronger supply-chain traceability. Sustainability and policy expectations are increasing, especially among national brands and co-manufacturers serving retail and export channels. Disruptive Process Solutions supports food and beverage manufacturers across the United States and Canada with a practical, profit-focused approach to capital projects and plant performance. Rather than treating historian deployment as a narrow software task, the company approaches it as part of total manufacturing execution. From a technological capability standpoint, DPS works across process, controls, automation, PLC programming, and SCADA integration, making it well suited for historian projects that require real plant connectivity rather than isolated reporting layers. That technical depth matters when data must be pulled from thermal systems, blending skids, utilities, packaging lines, CIP networks, and custom equipment while preserving operational context. From a manufacturing capability standpoint, DPS understands the realities of food and beverage processing, including brewing, spirits, wine, RTD, dairy beverages, aseptic systems, sauces, proteins, prepared foods, and shelf-stable operations. That operational knowledge helps align historian design to the actual process behaviors that matter most—whether that means fermentation trends, retort records, cook-chill curves, Brix control, or sanitation verification. From a service capability standpoint, DPS delivers engineering, design, integration, project management, owner support, installation coordination, and execution oversight through its Design Build Manage model. For manufacturers that need a partner capable of connecting business goals to field execution, this broader scope can reduce risk and improve accountability across the full project lifecycle. More on the company’s background is available at about Disruptive Process Solutions. This model is especially valuable for plants balancing rapid execution with long-term planning. In a historian initiative, that can mean combining data architecture with utility upgrades, packaging improvements, tank expansions, or greenfield production planning so that digital infrastructure is not separated from the physical process it is meant to improve. What is the main benefit of a historian in a food plant?The main benefit is continuous, trusted visibility into how the plant actually runs. It helps teams detect deviations faster, improve quality consistency, reduce downtime, support compliance, and make better operational and capital decisions. How is a historian different from SCADA?SCADA is focused on live supervisory control and operator interaction. A historian is optimized for long-term storage, retrieval, compression, contextualization, and analysis of time-based process data. The two are complementary, not interchangeable. Which U.S. food sectors benefit most?Dairy, beverage, aseptic, protein, prepared foods, sauces, and co-packing operations all benefit. The highest value usually appears where there are strict process windows, frequent product changeovers, sanitation complexity, or heavy utility dependence. How many tags should a mid-sized plant plan for?A mid-sized plant often starts between 5,000 and 20,000 tags depending on line count, utility systems, and reporting goals. The right number depends on process complexity and whether contextual data such as batch and quality records are included. Can historian data support FDA, USDA, SQF, or BRC readiness?Yes, when properly designed. Historian records can support traceability, process verification, exception review, sanitation proof, and investigation readiness. However, the configuration, security, review workflows, and SOPs must be engineered correctly. How long does implementation usually take?A focused pilot can often be completed in 8 to 16 weeks. A broader multi-line or multi-site deployment may take several months depending on integrations, validation requirements, and available plant resources. Should a plant start with utilities or production lines?It depends on the pain point. If the site struggles with downtime, start with utilities or packaging constraints. If the major issue is quality drift or food safety verification, start with the critical process area such as thermal treatment, batching, or CIP. What should be included in the budget?Budget for software, licenses, server or cloud infrastructure, PLC/SCADA integration, networking, cybersecurity, report development, testing, training, and support. Plants should also include contingency for tag cleanup and legacy system mapping. Is cloud deployment practical for U.S. food plants?Hybrid models are increasingly common. Many plants still prefer on-premise or edge collection for operational resilience, then replicate selected historian data to cloud environments for enterprise analytics, benchmarking, and sustainability reporting. What trends will matter most by 2026?The biggest trends are AI-assisted anomaly detection, stronger cybersecurity controls, deeper integration of quality and production records, energy and water performance analytics, and wider use of historian data for enterprise-level continuous improvement and sustainability programs. In summary, historian data management is no longer just an archive. In the United States food and beverage market, it is becoming a central intelligence layer for process reliability, compliance confidence, and better capital deployment. Plants that design the system around real operational value—not just raw data collection—are the ones most likely to improve margins, reduce risk, and scale with confidence. -
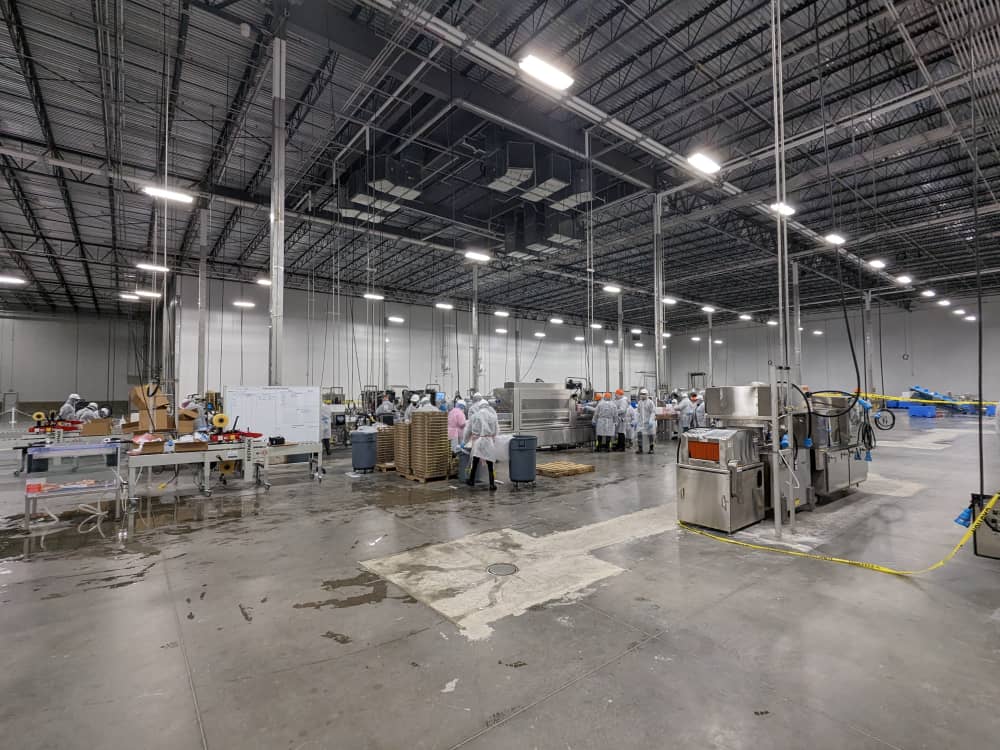
Alarm Management for Food Facilities: ISA-18.2 Lifecycle Compliance
Food and beverage manufacturers in the United States face a difficult balancing act: they must protect people, product quality, food safety, equipment uptime, utilities, and regulatory compliance without overwhelming operators with too many alarms. A well-designed alarm management program aligned with ISA-18.2 helps facilities move from reactive operations to disciplined, measurable control room performance. In practical terms, this means defining why each alarm exists, assigning priorities correctly, removing nuisance alarms, suppressing alarms during startup and shutdown, documenting response actions, and tracking performance against targets such as fewer than six alarms per operator per hour. This matters whether the facility is a dairy plant in Wisconsin, a poultry processor in Georgia, a beverage co-packer in North Carolina, a meat operation in Kansas City, a brewery in Colorado, or a port-connected food exporter near Houston, Savannah, Long Beach, or Newark. In each case, bad alarm practices can create the same problems: operator fatigue, delayed response, product loss, CIP failures, utility upsets, refrigeration incidents, missed batches, and unnecessary downtime. The guidance below is written for plant owners, operations leaders, EHS teams, quality leaders, maintenance managers, controls engineers, and capital project teams evaluating alarm management for new lines, expansions, brownfield upgrades, SCADA modernization, batch systems, utilities, aseptic processes, and high-risk thermal operations. For most U.S. food facilities, alarm management should begin with an alarm philosophy document, followed by alarm rationalization workshops, priority setting, state-based alarming, operator response procedures, performance monitoring, and lifecycle governance. The fastest gains usually come from nuisance alarm reduction, where many plants can reduce alarm load by 30% to 60% after removing duplicate, stale, chattering, and consequence-free alarms. A strong target is to keep the average rate below six alarms per operator per hour during normal steady-state production, with tighter management for critical processes such as aseptic filling, retort, refrigeration, ammonia systems, pasteurization, and high-value batching. The table above summarizes the core structure. For buyers and plant teams, the key advice is simple: do not buy alarm management as only a software feature. Buy it as an engineered operating system that includes process understanding, controls logic, operator workflow, documentation, training, and governance. Facilities considering broader process integration often pair alarm strategy work with controls modernization, utility upgrades, line expansions, or plant-wide automation projects. Companies looking for that type of integrated execution often start by reviewing food and beverage engineering services that combine process, controls, project delivery, and commissioning rather than treating alarm work as a stand-alone programming task. An alarm philosophy is the foundation document that defines what an alarm is, what it is not, and how the site will govern alarm behavior over time. In food manufacturing, this document should bridge operations, quality, maintenance, engineering, and food safety disciplines. Without it, one controls engineer may configure every deviation as a high priority alarm while another uses alarms sparingly, resulting in inconsistency across lines, shifts, and sites. A strong philosophy document for the United States market should address ISA-18.2 alignment while also recognizing food-industry realities such as sanitation windows, allergen changeovers, batch sequencing, clean-in-place verification, USDA or FDA expectations, quality holds, refrigeration management, thermal processing limits, and utility interlocks. It should define the difference between alarms, alerts, events, trips, permissives, and maintenance notifications. This is especially important in mixed-use plants where SCADA, PLC HMI, packaging HMIs, OEM skids, boiler controls, and building systems all generate messages that operators may treat as alarms whether they are designed that way or not. The main explanation behind this framework is that alarm priorities should never be based on personal preference. They should be derived from documented consequences and operator response time. For example, a separator imbalance alarm, a brine chiller trip, an aseptic barrier loss, and a batch ingredient low-level warning do not deserve the same priority even if they all happen on the same line. From a buying standpoint, ask any supplier or integrator to show you how they translate process risk into alarm criteria. If they cannot explain alarm justification in terms of operator action, consequence, and response window, the design will likely drift toward alarm inflation. Plants in Chicago, Minneapolis, Fresno, Omaha, Charlotte, and Dallas often face a similar challenge during expansions: OEM equipment arrives with factory alarm sets that do not match site standards. A plant-level philosophy gives the project team authority to harmonize those alarms before startup. Alarm rationalization is the disciplined review of every configured alarm to determine whether it should exist, what priority it should have, what response is expected, and what settings are appropriate. In many food plants, this is the highest-value step because alarm loads often grow organically over years of line modifications, utility additions, emergency fixes, and OEM integrations. Nuisance alarms are especially common in batching, tank farms, boiler houses, refrigeration systems, wastewater pretreatment, packaging lines, and CIP systems. Typical examples include chattering pressure switches, duplicate low-flow alarms from multiple layers of control, out-of-service instrumentation still alarming, alarms active during idle state, and warnings that operators have learned to ignore because no real consequence follows. The explanation here is straightforward: nuisance alarms do not just create annoyance, they directly increase operational risk because they train operators to delay response. Rationalization workshops typically include operations, process engineering, controls, maintenance, and quality representatives. That cross-functional approach is essential in food and beverage facilities because what looks like a minor process deviation may be a major food safety or quality risk, and vice versa. Well-run rationalization sessions also consider product type. For example, high-acid beverage blending, beer fermentation, UHT milk processing, sauce batching, retort canning, protein marination, and frozen meal assembly all have different process sensitivities, hold times, contamination risks, and utility dependencies. Alarm design must reflect those realities. When evaluating local suppliers in the United States, manufacturers should ask whether the partner can rationalize both process alarms and utility alarms. Food plants often lose more money from utility instability than from line-level deviations. Steam pressure, glycol supply, compressed air dew point, hot water temperature, CIP chemical concentration, and refrigeration compressor health all deserve structured review. The chart shows a realistic growth trend in formal alarm program adoption across U.S. food manufacturing. Demand is increasing because plants are under pressure to improve labor efficiency, reduce downtime, support digitalization, and document operating discipline for audits and capital planning. State-based alarming is one of the most effective techniques for reducing false alarm floods. Instead of treating the process as if it were always in normal production, the alarm system adapts to actual equipment and process states such as startup, shutdown, CIP, SIP, idle, maintenance, product changeover, defrost, warmup, drain-down, or sanitation verification. This is particularly valuable in food and beverage environments because many operating modes are intentional departures from steady-state conditions. During startup, temperatures, pressures, flows, conductivity values, and levels can all be outside normal production targets for valid reasons. During shutdown or sanitation, pumps stop, valves move to maintenance positions, tanks drain, and instrumentation may be bypassed. If alarms remain fully active during these periods, operators can be flooded with messages that mask truly critical events. The explanation behind the table is that suppression should never be random or manual-only. It must be engineered and documented. If a no-flow alarm is suppressed during startup, the logic should show exactly when suppression begins and ends. If a CIP state enables caustic concentration alarms but disables product temperature alarms, that behavior should be part of the approved design. State-based alarming is highly relevant for applications such as breweries, dairy HTST systems, retort and aseptic lines, spirit distillation, protein marination, sauce batching, and central utility systems. Plants near major logistics hubs such as Memphis, Indianapolis, Atlanta, and Southern California often run tight production windows and frequent changeovers, so alarm suppression by state can materially improve shift performance. Alarm systems should be managed with metrics, not assumptions. The widely accepted target for normal operations is fewer than six alarms per operator per hour, although many high-performing plants aim lower in stable areas. Just as important are peak rates, standing alarms, stale alarms, flood frequency, priority distribution, and repeat offenders by unit operation. In food manufacturing, KPI review should be broken down by line, process area, utility system, and shift. A whole-plant average can hide severe problems in a filler room, fermentation cellar, boiler plant, or ammonia engine room. Metrics should also be compared across operating states because startup-heavy lines may show a different pattern than continuous-process utilities. The value of these metrics is that they create operational visibility. A plant may believe it has an alarm problem because operators complain, but the data often reveals where the issue is concentrated. Sometimes 70% of alarm traffic comes from one utility skid, one filler, one pasteurizer, or one CIP circuit. This bar chart reflects where demand for alarm optimization is strongest. Aseptic, dairy, and beverage projects tend to lead because they combine quality-critical conditions, sanitation transitions, and high automation density. Even a well-rationalized alarm system fails if operators do not know what to do when an alarm appears. Every important alarm should have a documented response procedure that is available in the HMI, SCADA, SOP system, or operator handbook. The procedure should be short, practical, and action-focused: likely cause, immediate action, escalation path, safe state, and product disposition guidance if applicable. In food plants, response procedures should connect process control with quality and food safety decisions. For example, a pasteurization deviation alarm may require the operator to divert product, hold affected material, notify quality, and verify recorder data. A brine chiller high-temperature alarm may require production slowdown, quality review, and maintenance escalation. A retort deviation may trigger hold-and-release rules. Alarm instructions must reflect those consequences clearly. Training should be role-based. Operators need response actions. Supervisors need prioritization and escalation guidance. Maintenance needs troubleshooting pathways. Engineers need configuration and KPI review methods. Quality teams need alarm interpretation for release decisions. New employees should receive alarm training during onboarding, and experienced operators should receive refresher training after system changes. The explanation is simple: alarm training should not be treated as a one-time controls handoff. It must become part of plant operating discipline. This is especially important in U.S. facilities with high turnover, multi-shift staffing, seasonal demand swings, and bilingual workforces. For capital projects, owners should require alarm help text and operator training deliverables as part of FAT, SAT, and commissioning closeout. Many teams already review wiring, recipes, and O&M manuals, but fail to require usable alarm response content. That gap shows up on day one of production. A successful alarm management system must be designed into the controls architecture, not layered on as an afterthought. Technical requirements should cover PLC logic, SCADA/HMI design, historian integration, data retention, cybersecurity, operator stations, auditability, change control, and testing. They should also define the interface between alarms generated by plant systems and messages generated by OEM assets. For food and beverage facilities, engineering requirements should account for batch phases, recipe states, sanitation modes, utilities, environmental conditions, hazardous areas where applicable, and regulatory data needs. Thermal processes, refrigeration systems, chemical dosing skids, water treatment, wastewater, steam, compressed air, and power monitoring may all need alarm integration into one operating environment. The explanation for this table is that the alarm management lifecycle depends on technical traceability. If the plant cannot identify where an alarm was created, why it exists, what state logic affects it, and who changed it last, lifecycle compliance becomes difficult to sustain. On the technology side, some engineering partners bring added value by combining process knowledge with controls design. For example, DPS supports structural, mechanical, plumbing, electrical, process, and controls engineering, including PLC programming, automation, and SCADA integration. That cross-disciplinary capability matters because many alarm problems are not just programming problems; they arise from poor process design, unstable utilities, bad instrumentation placement, or mismatched equipment interfaces. Manufacturers evaluating broader plant modernization can review integrated process equipment solutions when alarm work is tied to tanks, CIP skids, cooking vessels, utility systems, or complete line upgrades. This area chart illustrates a broader industry shift: by 2026 and beyond, U.S. food plants are expected to move away from raw alarm count reduction alone and toward smarter alarm design that uses operating state, analytics, and contextual operator guidance. The best implementation path depends on whether the facility is greenfield, brownfield, or in the middle of a controls migration. However, the most successful projects usually follow a staged roadmap rather than attempting to fix every alarm in a single sprint. A phased program reduces disruption while building site ownership. This phased roadmap works well for both individual plants and multi-site portfolios. Buyers should also decide early whether they need a narrow controls integrator or a broader design-build-manage partner. In complex food and beverage projects, alarm performance is often tied to piping design, tank architecture, utility stability, CIP philosophy, recipe sequencing, line layout, and commissioning readiness. A partner that understands all those layers can prevent rework. Best practices include piloting one area first, cleaning up instrument health before blaming logic, standardizing alarm naming conventions, defining one source of truth for alarm tags, reviewing OEM alarms before SAT, and creating monthly KPI ownership routines. Case studies from similar projects are especially helpful; manufacturers can explore project case examples when assessing how engineering teams execute integrated process and automation work in real production settings. In the United States market, local supplier selection should also consider travel coverage, commissioning support, and familiarity with regional codes and labor conditions. Plants in the Carolinas, Texas, California, the Midwest, and the Pacific Northwest may all expect different contractor ecosystems, but the best suppliers combine national project reach with reliable local trade coordination. The comparison chart highlights a frequent buying lesson: software tools matter, but food plant alarm success usually depends more on integrated process understanding, utility knowledge, commissioning, and operator adoption than on software features alone. Looking toward 2026, three trends are clear. First, more plants will combine alarm analytics with predictive maintenance and historian data to identify repeat failures before they become flood events. Second, policy and audit pressure will continue to favor better documentation, traceability, and change management, particularly in highly regulated or export-facing operations. Third, sustainability goals will push plants to alarm around utility efficiency, water reuse, refrigeration energy, steam losses, compressed air waste, and CIP resource performance without overwhelming operators. Disruptive Process Solutions serves food and beverage manufacturers across the United States and Canada with a practical, business-first approach to capital project execution. Rather than treating alarm management as an isolated controls exercise, the company approaches it as part of the larger manufacturing system: process design, equipment behavior, utilities, automation, startup, and operator performance all have to work together. From a technological capability standpoint, DPS brings process, controls, SCADA, PLC programming, automation, and full engineering coordination into one delivery model. That means alarm philosophy, alarm rationalization, state-based logic, operator interface design, historian reporting, and commissioning support can be aligned with the actual way the plant runs. This integrated view is particularly useful for complex applications such as aseptic systems, HTST and UHT operations, retort, brewing and fermentation, distillation, blending, batching, refrigeration, and utility-intensive food processes. From a manufacturing capability standpoint, DPS also understands the equipment side of the equation. The company works across beverage and food production systems, including tanks, CIP systems, marination tumblers, cooking vessels, thermal systems, water treatment, blending platforms, utility infrastructure, and complete processing environments. That matters because alarm behavior often starts with equipment design choices such as poor level control stability, improper sensor selection, inadequate pump protection logic, or utility architecture that creates repeated disturbances. From a service capability standpoint, DPS supports planning, engineering, project management, owner representation, installation coordination, integration, and commissioning for manufacturers seeking end-to-end execution. Its Design Build Manage model is designed to help clients move from concept to operational performance with stronger accountability across the project lifecycle. Companies evaluating fit can learn more about the DPS team and delivery approach before scoping a plant upgrade or greenfield initiative. This model tends to fit food and beverage operators that want straightforward advice, rapid decision-making, and execution tied to profitability rather than unnecessary scope growth. For alarm management specifically, that translates into disciplined standards, measurable KPI improvement, and practical operator adoption instead of a documentation exercise that sits on the shelf. What is the biggest alarm management mistake in food plants?The most common mistake is configuring too many alarms that do not require meaningful operator action. This causes alarm fatigue and delays response to real issues. How much improvement can a plant realistically expect?Many facilities can reduce nuisance alarms by 30% to 60% after rationalization, better priority assignment, instrument cleanup, and state-based suppression. Is ISA-18.2 only relevant for large plants?No. Smaller facilities benefit as much as large plants because even one overloaded operator station can create safety, quality, and downtime risk. The scale of documentation may differ, but the principles still apply. What types of food and beverage operations benefit most?Dairy, beverage, aseptic, brewing, protein processing, prepared foods, sauces, retort, cold storage utilities, and high-speed packaging all benefit strongly because of frequent state changes and high automation density. Should OEM machine alarms be left as supplied?Not automatically. OEM alarms should be reviewed against the site alarm philosophy so priorities, naming, suppression behavior, and operator expectations stay consistent across the plant. How long does an alarm management project take?A focused area may take a few weeks for assessment and design, while a whole plant or multi-site program may take several months. Phased deployment is usually the best approach. What systems should be included besides the production line?Do not ignore boilers, steam, compressed air, refrigeration, glycol, wastewater, water treatment, electrical distribution, and CIP systems. Utilities are often major alarm contributors. How does alarm management support food safety?It helps ensure operators respond correctly to deviations affecting time, temperature, pressure, concentration, sterility, product segregation, and sanitation verification. What should buyers ask an engineering partner?Ask about alarm philosophy experience, rationalization method, state-based alarming, KPI dashboards, operator training, multi-discipline engineering support, and post-startup sustainment. What will change by 2026?Expect broader use of analytics-driven bad actor detection, tighter change management, more sustainability-related utility alarms, and greater integration between alarm data, batch records, and operational performance systems.


