-
Beverage Plant ROI Analysis
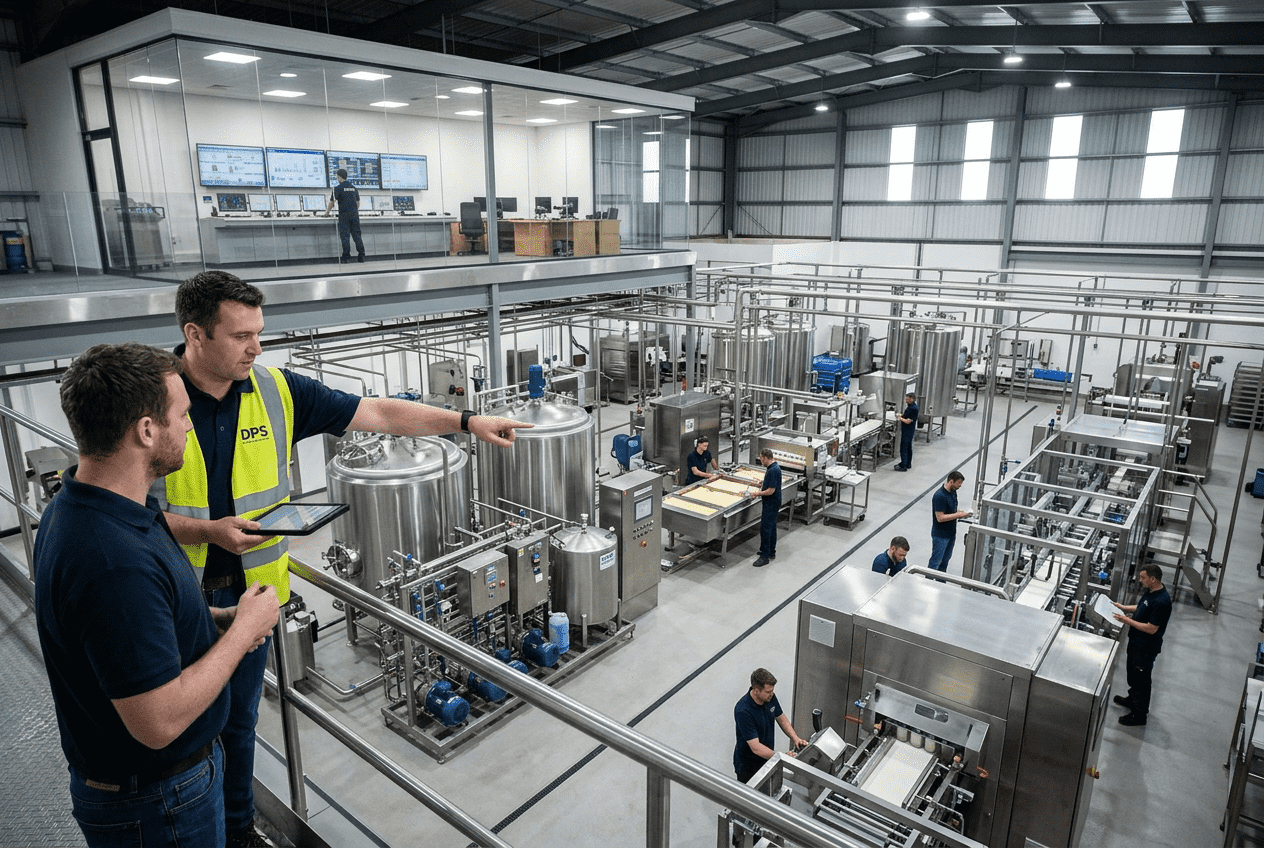
For beverage manufacturers in the United States, return on investment is not just a finance metric. It is the operating logic behind every tank, filler, boiler, syrup room, warehouse lane, and labor schedule. A strong beverage plant ROI analysis connects capital spending to throughput, margin, working capital, utility demand, and market access. Whether a company is evaluating a greenfield plant in Texas, an expansion in North Carolina, or a contract manufacturing strategy near Chicago or Los Angeles, the goal is the same: invest capital where the profit path is clearest and the operational risk is manageable. In practical terms, a U.S. beverage ROI model should answer five questions. First, how much volume can the plant realistically sell by SKU and channel? Second, what will it cost to make and deliver each unit? Third, how long until the project reaches break-even and positive free cash flow? Fourth, how sensitive is the investment to seasonality, freight, labor shortages, and packaging costs? Fifth, which project structure creates the best return: new build, plant expansion, or outsourcing production? This guide is written for beverage executives, private equity operators, plant managers, founders, controllers, lenders, and investors who need a usable framework, not a generic formula. It also reflects the way sophisticated engineering partners approach capital planning. Companies such as Disruptive Process Solutions work at the intersection of process design, construction execution, and profitability planning, helping clients align facility decisions with real commercial outcomes rather than simply installing equipment. Beverage plant ROI analysis is the process of measuring whether a manufacturing investment will generate enough operating profit and cash flow to justify its cost. In the United States, this usually means modeling capital expenditure, sales volume by product and channel, cost of goods sold, labor, utilities, logistics, maintenance, and financing costs over a multi-year period. A good model estimates payback period, internal rate of return, net present value, break-even volume, and downside risk under different operating scenarios. For most beverage projects, ROI improves when capacity is phased, SKU complexity is controlled, packaging is standardized, and utility infrastructure is sized to actual ramp-up rather than ultimate theoretical demand. Plants that look attractive on a simple revenue multiple often underperform if line changeovers are frequent, warehouse throughput is constrained, or the market mix shifts toward lower-margin channels. Conversely, some projects that appear expensive upfront create superior long-term returns because they reduce labor dependence, improve yield, and support higher-value product categories such as functional beverages, RTD cocktails, aseptic products, or premium co-packing. If leadership needs a quick rule of thumb, the investment should not be approved until management can explain: the expected annual contribution margin, the monthly cash burn during ramp-up, the exact break-even case volume, the utilization rate needed for target EBITDA, and the fallback plan if demand arrives six to twelve months later than forecast. Beverage plant ROI analysis is a structured financial and operational study used before a capital decision is made. It combines engineering assumptions with commercial assumptions. Finance teams often start with a formula such as annual net profit divided by total investment, but that is only the surface. In beverage manufacturing, ROI depends on line speeds, fill size mix, sanitation time, package availability, warehouse turns, route density, and compliance requirements. In the U.S. market, the analysis is especially important because production economics vary sharply by geography and product type. A carbonated soft drink line near Atlanta may benefit from access to distribution lanes across the Southeast. A functional beverage co-packer in Southern California may face higher labor and real estate costs but gain faster access to West Coast retail and import channels through Long Beach and Los Angeles. A Midwest operation near Columbus or Indianapolis may optimize freight and improve service levels to grocery, club, and e-commerce networks. ROI analysis also helps define the best project scope. Some investments fail not because the technology is wrong, but because the project is oversized, underutilized, or poorly sequenced. A business may not need a full new plant in year one. It may need debottlenecking, a revised controls strategy, a better CIP system, an upgraded blending room, or an additional packaging format that unlocks margin. This is where engineering discipline matters. The most effective project teams evaluate the plant as a profit engine, not just a collection of assets. From a capability standpoint, a strong engineering partner should understand process systems such as blending, batching, carbonation, pasteurization, aseptic handling, water treatment, utilities, automation, and SCADA. Those technological capabilities directly influence yield, uptime, labor productivity, and quality consistency, all of which feed the ROI model. A practical ROI framework for beverage manufacturing starts with four layers: capital costs, operating economics, cash flow timing, and risk adjustment. Capital costs include land, building, process equipment, utilities, controls, installation, startup, permitting, validation, and contingency. Operating economics include volume, net sales, gross margin, labor, maintenance, freight, overhead, and working capital. Cash flow timing reflects when spending occurs versus when revenue begins. Risk adjustment tests what happens if volume ramps slower, costs rise, or customer mix changes. The most common performance metrics include simple ROI, payback period, EBITDA margin, free cash flow, break-even units, net present value, and internal rate of return. In board discussions, payback and downside resilience often matter more than top-line enthusiasm. Lenders and investors also want to see how the business performs at 60%, 75%, and 90% of projected volume, not just at full utilization. The table above shows why ROI cannot be treated as a single percentage. In beverage plants, timing and operating detail matter as much as total spend. A line that runs at 600 bottles per minute on paper but loses capacity to flavor changeovers, carbonation variance, or downstream palletizing disruptions will not produce the modeled return. The chart above illustrates a realistic growth pattern in U.S. beverage capacity investment. The trend is supported by continued demand for functional drinks, RTD alcohol, low-sugar beverages, protein beverages, and premium private label programs. However, growth does not guarantee project success. Plants must still match technology and capacity to actual demand. Revenue modeling begins with a simple question: what exactly will the plant sell, in what package, through which channels, at what net realized price? Many beverage models fail because they forecast total annual cases without separating SKUs, package formats, line compatibility, retailer deductions, and channel-specific freight or slotting economics. In the United States, beverage demand can vary widely by channel. Grocery offers scale but heavy price pressure. Convenience stores favor single-serve formats and faster turns. Club stores reward pallet efficiency and larger pack sizes. Foodservice can be margin-rich but contract-dependent. E-commerce has different packaging damage risk and fulfillment costs. Contract manufacturing may provide base load volume but lower gross margin per case. A credible ROI model should allocate volume by SKU and channel month by month during the ramp period. It is also important to model product families separately: carbonated beverages, juices, dairy-based drinks, kombucha, sports nutrition, alcoholic RTDs, and aseptic products all behave differently. Shelf-life, process complexity, microbial risk, ingredient volatility, and package constraints affect both pricing and cost. The revenue table highlights why weighted average pricing alone is not enough. A plant serving Dallas, Charlotte, and Phoenix may sell the same brand in multiple formats, but each format creates different throughput, margin, and inventory implications. The best models translate commercial plans into operational load: required hours, changeover frequency, warehouse space, and ingredient procurement cycles. Manufacturing capabilities also matter here. A facility designed for blending, carbonation, hot fill, cold fill, fermentation, or aseptic packaging should be matched to the product portfolio. If the equipment architecture does not support the revenue mix, theoretical sales will not convert into profitable production. Companies often explore engineering and capital planning services at this stage to validate whether the line design truly supports the sales forecast. The demand chart shows how category momentum can shift ROI assumptions. Functional beverages, RTD alcohol, and aseptic nutrition continue to attract investment because they often support stronger pricing than legacy commodity segments. Still, higher-margin categories usually require tighter process control and more sophisticated validation. A beverage plant may win on revenue and still miss its return targets because costs are poorly understood. Cost structure analysis should separate variable costs from fixed costs and identify which items move with volume, which move with complexity, and which move with time. In most U.S. facilities, cost of goods sold includes ingredients, packaging materials, direct labor, utilities, sanitation chemistry, quality consumables, and line scrap. Operating expenses include supervision, maintenance, insurance, software, warehouse overhead, property taxes, and administrative support. Packaging is often the largest cost driver after labor and ingredients. Aluminum cans, closures, corrugate, labels, and PET resin can materially change project economics. Ingredient costs are also volatile in categories using sweeteners, dairy inputs, fruit concentrates, caffeine systems, nutraceuticals, or alcohol bases. Utilities matter more than many executive teams expect, especially where boilers, chillers, compressed air, tunnel pasteurization, or aseptic sterilization are involved. The explanation from this table is straightforward: not all costs scale the same way. Labor may rise faster than volume in a manual packaging environment, while utilities may be more efficient at higher throughput if the system is properly sized. This is why automation decisions must be evaluated in ROI terms, not only in engineering terms. Service capabilities are especially relevant in cost analysis. A full-scope partner that can combine process engineering, owner representation, project management, installation oversight, equipment integration, and commissioning can reduce hidden cost leakage during execution. That is one reason many manufacturers review both project strategy and equipment sourcing together, including specialized process equipment options that fit the production profile without overspending on unnecessary complexity. The area chart shows a broad industry shift toward automation. By 2026 and beyond, labor reliability, traceability, and energy management are expected to play larger roles in plant economics. Automation does not always reduce headcount immediately, but it can improve yield, shorten changeovers, strengthen data visibility, and reduce compliance risk. Break-even analysis identifies how many cases, production hours, or revenue dollars are needed before the plant covers all fixed and variable costs. For a new beverage facility, this should be mapped monthly, not just annually. The first twelve to twenty-four months often include training losses, vendor learning curves, working capital spikes, and customer onboarding delays. A useful break-even model includes at least three scenarios: conservative, base, and accelerated ramp. In the conservative case, launch customers order late, scrap is high, and freight is inefficient. In the base case, volume builds as expected. In the accelerated case, customer demand is strong but additional working capital and labor are required sooner. Management should know whether growth creates a cash need before it creates a profit benefit. This table shows that faster break-even does not always mean better long-term economics. A complex aseptic line may take longer to stabilize but deliver stronger margins once commercial volume is secured. An expansion within an existing plant may break even earlier because utilities, labor leadership, and quality systems are already in place. Case studies often reveal this clearly. In one type of real-world scenario, a manufacturer may assume that a multimillion-dollar capacity expansion is needed to unlock growth, only to discover that the actual bottleneck is controls logic, scheduling, or line synchronization. Evaluating debottlenecking before construction can dramatically improve ROI. Manufacturers comparing options often benefit from reviewing prior project case examples that show how engineering decisions changed commercial results. Seasonality is one of the most underappreciated risks in beverage economics. Demand for soft drinks, teas, sports beverages, and convenience-oriented products often builds ahead of spring and summer. Retail promotions, distributor inventory builds, and ingredient buys can force a plant to spend cash months before revenue converts into collections. If the model does not include seasonal inventory and receivable pressure, the project can appear profitable on paper while straining liquidity in practice. Seasonal cash flow analysis should track monthly raw material purchases, finished goods inventory, accounts receivable days, and the timing of promotional deductions. It should also account for planned shutdowns, maintenance windows, weather disruptions, and utility peaks. For alcoholic beverages, seasonality may tie to holiday demand or distributor ordering patterns. For functional drinks, social media campaigns and retailer resets can create lumpy order timing. The table makes clear that ROI is inseparable from cash timing. A plant can report solid annual margins while still requiring emergency financing if summer inventory builds are not funded. In the United States, this is particularly relevant for businesses shipping into large retail networks from hubs such as Atlanta, Chicago, Dallas-Fort Worth, the Inland Empire, or New Jersey distribution corridors. When beverage companies plan for growth, they usually face three strategic paths. The first is a new build, which offers control and long-term capacity but requires the most capital and the longest ramp. The second is expansion of an existing facility, which usually improves payback because utilities, workforce, and compliance systems already exist. The third is contract manufacturing, which minimizes initial capital but can reduce margin control and scheduling flexibility. The correct choice depends on commercial certainty, category complexity, geographic needs, and capital access. A greenfield facility may be ideal for a company with secured multi-customer demand and a long-term footprint strategy. An expansion is often best when an existing site already serves the market well and bottlenecks are identifiable. Contract manufacturing is useful when demand is uncertain, product development is still evolving, or leadership wants to preserve capital for sales and brand building. This comparison shows why many U.S. manufacturers do not jump directly to a new plant. A phased approach can preserve capital and reduce demand risk. For example, a brand may co-pack in the Midwest while validating East Coast grocery traction, then expand into owned capacity in the Carolinas once annualized demand is more predictable. Others may expand an existing Texas site to serve both regional growth and export adjacency through Gulf Coast logistics. The comparison chart reflects a common reality: expansions often produce the strongest risk-adjusted ROI, while new builds offer the highest strategic upside if utilization is secured. Hybrid models are becoming more popular as companies manage uncertainty while preserving future optionality. Lenders and investors do not fund enthusiasm; they fund disciplined assumptions. To secure financing for a beverage plant, management should present an ROI model that is operationally grounded, sensitivity-tested, and supported by realistic execution plans. The model should show revenue by customer and channel, not just by category. It should quantify line utilization, labor efficiency, gross margin by SKU family, and monthly cash flow through the ramp period. Strong financing packages typically include a base case, downside case, and mitigation plan. The downside case should address delayed customer wins, higher packaging costs, labor inefficiency, slower commissioning, or reduced throughput. The mitigation plan should explain how the company can phase equipment, adjust shifts, outsource overflow, or defer noncritical capital. This is also where a credible project partner adds value. Investors respond well when the engineering and construction approach is integrated with the business case. A design-build-manage mindset is useful because it connects concept, budget, execution, and operating performance. In practice, this means the plant is not being designed in a vacuum. It is being engineered around return targets, startup timing, compliance needs, and long-term maintainability. For 2026 and beyond, financing conversations increasingly include automation readiness, sustainability, and policy resilience. Lenders want to know whether a plant can manage energy use, water efficiency, traceability, and future regulatory requirements. Projects with heat recovery, efficient CIP design, better water treatment, stronger controls, and utility right-sizing may attract better support because they show lower long-term operating risk. Sustainability should not be treated as a branding add-on. In beverage manufacturing, it is increasingly tied to actual cash economics and investor confidence. When presenting to investors, include the following buying advice. First, do not overbuild for a five-year dream if the first two years are uncertain. Second, protect the project with flexible line design and clear debottleneck plans. Third, invest in automation where it solves a measurable cost or compliance problem. Fourth, anchor location strategy around customer density, labor quality, utility reliability, and freight access. Fifth, choose engineering and execution teams that understand both manufacturing reality and capital discipline. From an “our company” standpoint, Disruptive Process Solutions is relevant because it approaches projects as profitability platforms rather than equipment-only jobs. Its teams support beverage and food manufacturers across the United States and Canada with process engineering, capital planning, owner representation, project management, equipment integration, installation, and execution oversight. Its beverage experience spans brewing, distillation, wine, kombucha, RTD, carbonated and non-carbonated drinks, dairy beverages, and aseptic systems. That breadth matters because ROI improves when technical design, manufacturing fit, and service execution align from the start. What is the best ROI metric for a beverage plant?There is no single best metric. Most U.S. operators use a combination of payback period, EBITDA margin, free cash flow, break-even volume, and internal rate of return. For lenders, downside cash flow often matters more than headline ROI. How long does it usually take a beverage plant to break even?Many projects break even between 10 and 24 months after startup, depending on scale, category, existing customer commitments, and how much infrastructure already exists. Expansions usually break even faster than greenfield builds. Should I build a plant or use contract manufacturing first?If demand is still uncertain, contract manufacturing or a hybrid model is often safer. If volume is secured and margin control matters, an owned plant or expansion may create better long-term returns. What costs are most often missed in ROI models?Startup scrap, commissioning labor, utility upgrades, quality compliance costs, spare parts, inventory carrying costs, and seasonal working capital are frequently underestimated. How important is plant location in the United States?Very important. Freight density, labor availability, utility reliability, water access, tax structure, and customer proximity can materially change ROI. Cities and corridors such as Dallas-Fort Worth, Atlanta, Chicago, Charlotte, Columbus, Phoenix, and Southern California each offer different advantages. How does automation affect beverage plant ROI?Automation can improve yield, uptime, traceability, sanitation consistency, and labor efficiency. It works best when tied to a specific financial outcome, such as reducing overtime, shortening changeovers, or improving batch accuracy. What should investors want to see in a beverage ROI model?Investors should expect detailed revenue assumptions by SKU and channel, realistic throughput assumptions, monthly cash flow, working capital needs, downside scenarios, and a clear execution plan supported by experienced engineering and project teams. What trends will matter most in 2026?Expect more emphasis on energy efficiency, water reuse, data visibility, automation, traceability, domestic supply resilience, and sustainability-linked operating design. Functional beverages, premium RTD categories, and aseptic nutrition are likely to remain active investment areas. In summary, beverage plant ROI analysis in the United States is most effective when it connects market demand, product strategy, engineering design, and financial discipline in one model. The companies that outperform are usually the ones that ask the hardest questions before spending capital: where profit will come from, what operational constraints could delay it, and which investment structure creates the best risk-adjusted return. -
Food Factory Expansion Feasibility Study
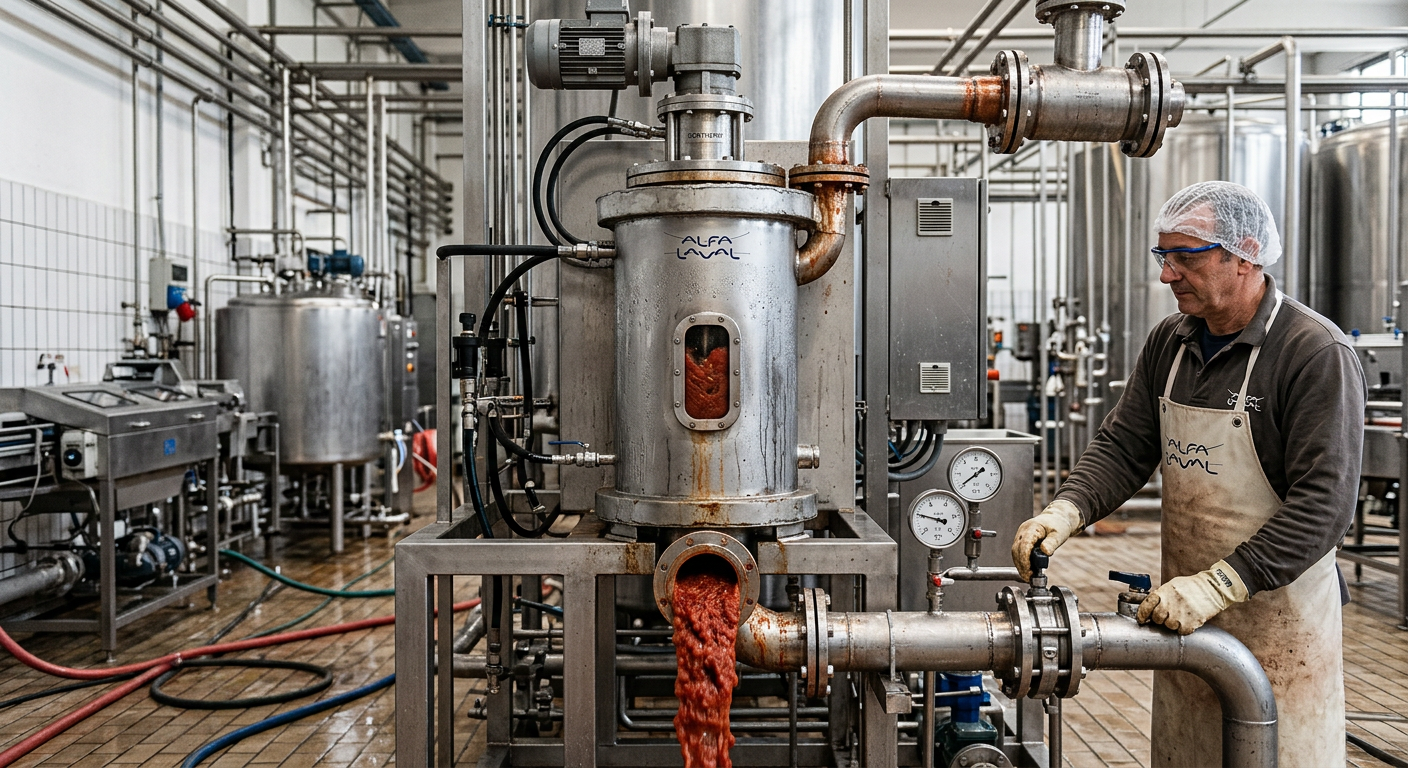
Food manufacturers in the United States often reach a point where demand rises faster than plant capability. At that moment, leadership must decide whether to expand an existing facility, reconfigure production, add utilities, or pursue a new greenfield site. A sound food factory expansion feasibility study reduces capital risk, protects uptime, and ties engineering decisions to actual profit. For operators producing protein, dairy, sauces, ready-to-drink beverages, aseptic products, or contract-packed goods, the right path depends on production targets, site limits, utility headroom, labor access, compliance obligations, and return on invested capital. Across major U.S. manufacturing corridors such as the Midwest, Texas, the Southeast, California, and the Carolinas, expansion projects are being driven by reshoring, retailer service-level pressure, co-manufacturing growth, and stricter sustainability expectations. Facilities near Chicago, Dallas-Fort Worth, Charlotte, Fresno, Atlanta, and ports such as Savannah, Houston, Long Beach, and Newark often gain logistics advantages, but they also face higher complexity around permitting, utilities, and phased construction. A detailed feasibility process turns those variables into a practical expansion roadmap. For many manufacturers, the best answer is not automatically “build bigger.” In some cases, debottlenecking controls, utilities, sanitation flow, batching logic, or packaging line balance can unlock double-digit capacity gains before heavy construction begins. That business-first mindset is central to how capital projects should be evaluated in the U.S. food and beverage market. If your food factory has strong market demand, a structurally sound building, utility reserve, and room for process flow improvement, expanding the current plant is often faster and more capital-efficient than constructing a new facility. If your site is landlocked, utility-constrained, labor-challenged, or operationally incompatible with future product mix, a new build may deliver better long-term economics. The fastest way to determine the right path is to compare five factors: current capacity utilization, forecasted throughput, site expansion envelope, utility loading, and financial payback. A feasibility study should also test whether lower-cost changes such as automation updates, line balancing, scheduling redesign, or targeted equipment replacement can close the capacity gap first. In the United States, this step is critical because construction costs, power interconnection lead times, and wastewater permit requirements vary widely by state and municipality. The table above shows why expansion decisions should be framed as a business case, not just a construction question. In many U.S. projects, a hybrid approach works best: debottleneck immediately, add modular utilities next, and reserve greenfield planning for a later phase. The expansion-versus-new-build decision usually starts with timing, but it should end with lifecycle value. Expanding an existing plant can preserve tax advantages, labor continuity, supplier routes, and established certifications. It also avoids the learning curve of starting up at a new location. For plants near distribution hubs like Memphis, Kansas City, Indianapolis, or Allentown, maintaining the current freight network may be a major advantage. However, not every plant is expandable in a practical sense. Older facilities may suffer from low clear heights, poor raw-to-ready separation, undersized drainage, outdated ammonia or glycol systems, or limited truck queuing. A new build becomes attractive when the legacy site forces inefficient flow or recurring compliance risk. This is especially common for processors shifting from regional production to national scale or adding aseptic, retort, USDA-inspected protein, or allergen-segregated operations. Disruptive Process Solutions approaches this question from a profitability perspective rather than a generic construction lens. The company’s teams support food and beverage manufacturers across the United States and Canada with planning, engineering, installation, integration, and execution oversight. That practical range matters because the right answer may involve process redesign, equipment relocation, owner’s representation, or a phased design-build-manage strategy instead of a single large capital event. You can learn more about the company’s planning approach on its company overview page. The comparison above is useful when management needs a board-level recommendation. In practice, the decision should be backed by modeled throughput, utility load calculations, construction phasing plans, and a realistic commissioning schedule. This growth trend reflects the broader U.S. push toward automation, domestic production resilience, and higher-throughput processing systems. By 2026, capital spending is expected to remain focused on facilities that improve labor productivity, energy efficiency, and service reliability. A capacity gap analysis measures the difference between what your plant can consistently produce today and what the business must produce in the future. This includes not only nameplate equipment ratings, but also changeover losses, sanitation windows, labor availability, yield loss, maintenance reliability, and utility support. Many plants overestimate capacity because they use theoretical hourly rates rather than true OEE-based output. A strong analysis separates bottlenecks by process area: receiving, batching, thermal processing, filling, packaging, warehousing, and shipping. For example, a beverage site may have enough blending volume but insufficient bright tank turnover or filler speed. A prepared foods plant may have enough cook capacity but limited chilling, slicing, or case packing. Protein facilities often hit constraints in wastewater, refrigeration, or USDA inspection flow before core equipment appears full. DPS frequently helps clients look beyond equipment count and into system balance. Its technological capabilities span process, structural, mechanical, plumbing, electrical, and controls engineering, including PLC programming, automation, SCADA, batch control, and utility integration. That matters because hidden capacity is often buried in control logic, CIP sequencing, recipe timing, or poor synchronization between upstream and downstream assets. More on these integrated offerings can be found on the services page. This table illustrates why a plant can miss demand even when some equipment still appears underutilized. The gap may sit in labor, support systems, or sanitation frequency rather than in the main processing asset. The sector demand chart shows why capacity planning should be product-specific. Ready-to-drink beverages, protein processing, and aseptic lines are among the most active categories in U.S. capital expansion discussions due to retail velocity, shelf-life demands, and co-packing growth. Site feasibility answers whether the plant can physically grow without creating flow conflicts or code issues. This includes building envelope, ceiling height, column spacing, floor loading, access roads, employee circulation, raw and finished segregation, maintenance access, and room for future utility yards. In U.S. food manufacturing, site feasibility is often constrained by truck flow, stormwater rules, neighboring parcels, or municipal setback requirements. Manufacturers near dense metros such as Los Angeles, Northern New Jersey, or greater Boston often find land expansion difficult, while sites in Texas, the Carolinas, Tennessee, or parts of the Midwest may have better expansion envelopes. Yet more land does not automatically mean easier expansion if electrical service, water supply, or sewer discharge permits are limited. For food and beverage operators, space must be judged by hygienic zoning as much as square footage. A plant may have open floor area but still lack room for proper ingredient staging, allergen control, forklift segregation, or maintenance access. That is why process flow modeling and adjacency planning should be part of the site review. The explanation here is straightforward: most “space problems” are really flow problems. A site with disciplined master planning can often outperform a larger but poorly organized facility. Production line integration is where good feasibility work protects revenue. Expansions fail when new systems are treated as standalone purchases rather than connected process networks. Tie-ins affect utilities, controls, sanitation, scheduling, operator training, and startup stability. The key goal is to sequence work so the plant stays commercially functional while upgrades occur. Best practice is to identify shutdown-critical activities early: process piping cutovers, electrical switchgear upgrades, controls migration, roof penetrations over active production, steam tie-ins, wastewater reroutes, and refrigeration shutdown windows. For many U.S. processors, holiday demand cycles, retailer promotions, or harvest seasons determine the only acceptable installation window. DPS is especially relevant in this area because it combines design, installation, integration, and project management under one execution model. Its manufacturing capabilities include custom tanks, CIP systems, cooking vessels, and specialty process equipment that can be engineered to fit retrofit conditions. Its teams also manage turnkey installation and system integration, reducing handoff risk between design intent and field execution. Equipment-related capabilities are outlined on the equipment solutions page. When line expansion is phased correctly, plants can install utility backbone first, stage new skids off-line, test controls in parallel, and execute final tie-ins during short planned outages. That approach reduces startup surprises and shortens the path to stable production. The area trend reflects a growing U.S. preference for phased retrofits over full plant shutdowns. As labor costs rise and customer service penalties tighten, producers increasingly favor staged integration strategies that preserve production continuity. Utility capacity is often the hidden governor of food factory growth. A plant may have room for more production equipment yet lack the electrical service, steam generation, chilled water, refrigeration tonnage, process water treatment, compressed air, or wastewater discharge capacity to support it. In many U.S. municipalities, utility upgrades have lead times longer than process equipment procurement. Power capacity should include transformer loading, switchgear condition, spare breaker space, motor starting impact, standby generation needs, and utility-provider interconnection schedules. Water reviews should cover peak flow, pressure stability, pretreatment needs, seasonal restrictions, and product-contact quality where applicable. Wastewater feasibility must analyze flow, BOD, TSS, fats, oils, grease, pH, and local surcharge structures. For protein, dairy, beverage, and prepared food plants, wastewater can become the decisive project constraint. DPS’s technological capabilities extend deeply into utility infrastructure, including CIP, boilers and steam, compressed air, cooling towers, glycol and refrigeration support, water treatment, wastewater planning, HVAC, controls, and energy management. That breadth matters because utility systems should be sized for process reality, not just generic rule-of-thumb assumptions. This table shows why utility feasibility should be completed early. Late-stage discovery of a sewer limit or switchgear replacement can radically change project economics and timing. A food factory expansion should be judged by incremental EBITDA, not just by installed cost. Financial feasibility requires a complete view of direct CAPEX, soft costs, utility upgrades, permitting, contingencies, startup losses, working capital, maintenance burden, and labor impact. The right model should also compare multiple scenarios: debottleneck only, phased expansion, major retrofit, and new build. In the United States, financing assumptions matter more than many teams expect. Interest rates, depreciation treatment, local incentives, utility rebates, and tax abatement can materially alter project payback. States competing for food manufacturing investment, such as North Carolina, Texas, Tennessee, Georgia, Indiana, and parts of the Midwest, may offer grants or infrastructure support that improve returns. Expansion economics should also reflect avoided costs: reduced co-manufacturing spend, lower freight, lower scrap, lower labor per unit, and fewer service failures. For some plants, the best ROI comes from digital controls upgrades, utility optimization, or packaging automation rather than from adding entirely new process trains. The table above highlights why ROI is only credible when both cost and operational realism are included. A low-budget project with weak commissioning planning can produce a worse return than a higher-CAPEX project with stronger execution certainty. This comparison suggests a common U.S. pattern: debottlenecking and targeted line expansion frequently generate the fastest payback, while full retrofits and new builds are better justified when strategic growth or compliance needs outweigh near-term return speed. Regulatory feasibility is a major part of expansion planning in the United States. Depending on the product category, facilities may need to address FDA, USDA, state environmental agencies, local building departments, fire marshals, wastewater authorities, and third-party certification bodies such as SQF or BRC. Expansion plans should be reviewed for food safety zoning, air handling, personnel flow, allergen management, sanitary design, labeling impact, thermal process validation, and utility compliance. Protein and dairy expansions may face especially rigorous oversight around drainage, refrigeration, sanitation, and wastewater. Beverage and aseptic projects require close attention to process controls, fill environment, CIP validation, and water quality. Plants adding retort or shelf-stable systems must also consider process authority review and documentation discipline. DPS has experience supporting projects that align with FDA, USDA, SQF, and BRC expectations, which is valuable because compliance must be built into equipment layout, utility design, and operating procedures from the beginning. Manufacturers assessing options can review relevant execution examples in the company’s project case studies. Beyond current compliance, 2026 trends point toward tougher expectations around energy intensity, water stewardship, wastewater pretreatment, refrigerant strategy, digital traceability, and worker safety. Expansion feasibility should therefore include future-proofing for automation, data visibility, sanitation verification, and sustainability reporting. A phased expansion strategy reduces both operational and financial risk. Instead of trying to solve every capacity issue in one large project, the manufacturer sequences improvements based on business urgency, cash flow, and site logic. Typical phases include immediate debottlenecking, utility backbone upgrades, process line additions, warehouse or cold storage expansion, and long-range site redevelopment. This approach is especially useful for co-packers, multi-SKU food plants, and beverage manufacturers with seasonal demand volatility. It allows leadership to validate market growth, preserve optionality, and incorporate lessons from early phases into later investments. It also supports better contractor scheduling and less disruptive tie-in planning. DPS’s service capabilities are well suited to this model because the company acts across capital planning, feasibility analysis, owner’s representation, project and program management, general contracting where licensed, equipment supply, installation, and integration. Its design-build-manage framework helps align engineering, field execution, and stakeholder decision-making, which is often the difference between a controlled phased rollout and a fragmented expansion effort. The value of this phased table is that it turns growth into a managed sequence rather than a single all-or-nothing bet. It also fits the realities of U.S. permitting lead times, labor availability, and financing windows. As a practical buying guideline, manufacturers should select engineering and integration partners that understand both food process realities and capital discipline. Look for a team that can challenge assumptions, quantify utility impacts, model downtime, coordinate local trades, and tie every major scope item to profit, compliance, and scalability. That is particularly important for enterprises expanding in multiple states or standardizing facility platforms across a network. For product categories such as sauces, dressings, RTD beverages, dairy, plant-based proteins, meat, poultry, seafood, and aseptic foods, feasibility should never be generic. Each category has distinct thermal, sanitary, storage, and utility implications. The strongest expansion plans are product-specific, location-aware, and phased to match real commercial demand. Local supplier strategy also matters. U.S. food plants benefit when regional fabricators, electrical contractors, mechanical installers, and automation specialists are coordinated through a clear project governance structure. Whether the project is in North Carolina, California, Illinois, Texas, or Ontario-border logistics territory, local trade execution needs to be aligned with process-critical design intent. How long does a food factory expansion feasibility study usually take in the United States?Most studies take from 4 to 12 weeks depending on scope, data quality, and whether utility providers, environmental agencies, or multiple production scenarios must be evaluated. When is expansion better than a new build?Expansion is usually better when the current site has utility headroom, good labor access, workable hygienic flow, and enough space to add process or support infrastructure without major operating disruption. What is the biggest hidden risk in plant expansion?Utility limitations are among the most common hidden risks, especially electrical service, wastewater discharge, refrigeration, and sanitation support capacity. Can controls upgrades really increase capacity without major CAPEX?Yes. In some plants, PLC logic, recipe timing, CIP sequencing, line balancing, and packaging synchronization create larger bottlenecks than core equipment size. Which industries most often need detailed expansion studies?Protein, dairy, ready-to-drink beverages, sauces, prepared foods, aseptic processing, and co-packing operations frequently require detailed studies because of high throughput pressure and strict compliance requirements. How should a manufacturer compare suppliers or project partners?Compare them on food-industry experience, utility expertise, retrofit integration capability, project management discipline, compliance familiarity, and willingness to challenge weak assumptions. What trends will shape expansion planning in 2026?Expect stronger focus on automation, energy efficiency, water reuse, wastewater reduction, digital traceability, modular utility systems, and phased projects that protect production continuity. What role can DPS play in this process?DPS can support feasibility studies, capital planning, process and utility engineering, owner’s representation, equipment integration, installation, and managed execution for food and beverage manufacturers across North America. -
Beverage Factory Expansion Feasibility
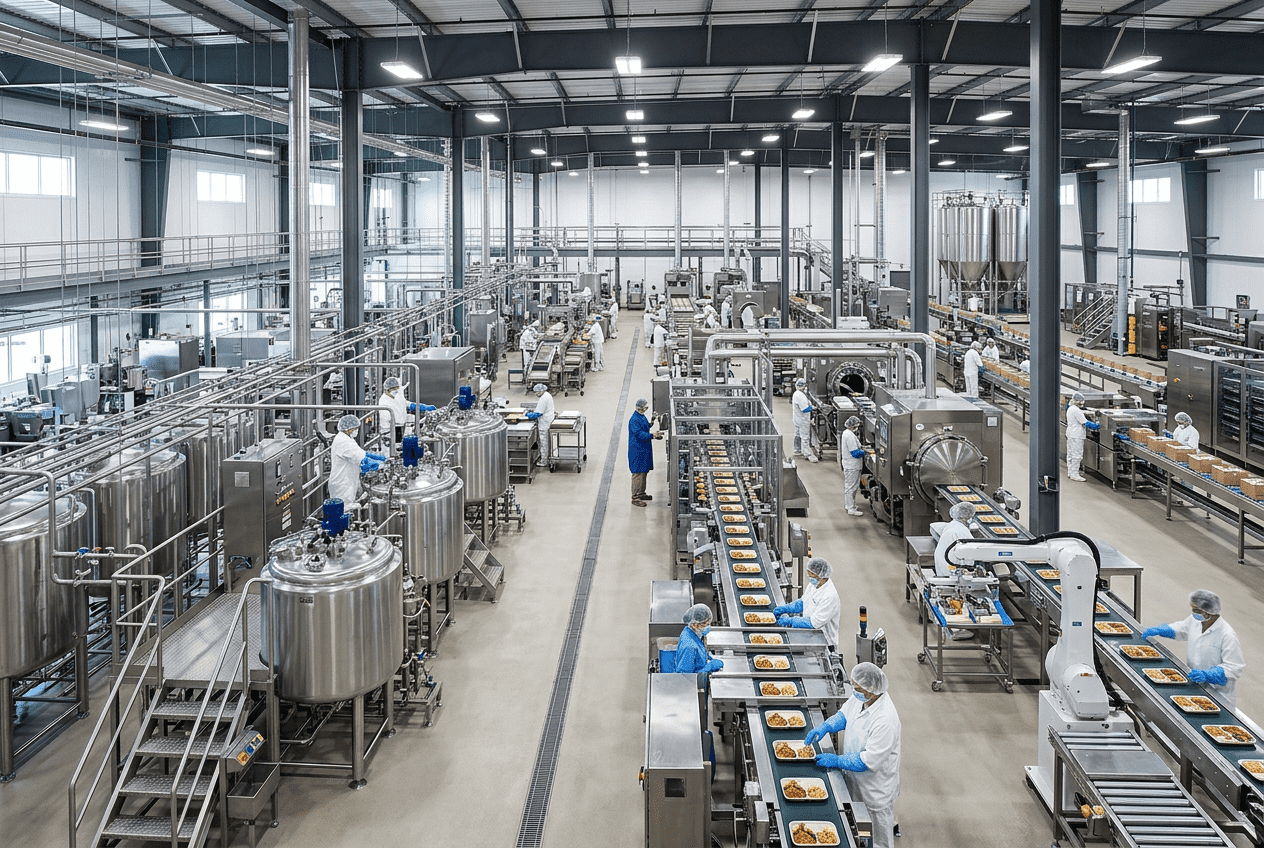
Expanding a beverage plant in the United States can create major profit upside, but only when capacity, utilities, layout, labor, automation, and financial returns are evaluated together. Many manufacturers assume they need a new line, a larger syrup room, or additional packaging equipment, when the real limit is often hidden inside controls logic, CIP scheduling, wastewater treatment, compressed air, or warehouse flow. A disciplined expansion review helps beverage producers avoid overbuilding and directs capital toward the true constraint. For U.S. manufacturers producing soft drinks, ready-to-drink beverages, spirits, juices, kombucha, dairy beverages, brewing products, and aseptic formats, expansion decisions are increasingly tied to regional distribution strategy, retailer service levels, freight economics, and utility resilience. Plants near major trade corridors such as Chicago, Dallas-Fort Worth, Atlanta, Los Angeles/Long Beach, Savannah, Houston, and New Jersey often see strong scale opportunities, but they also face tight labor markets, more demanding municipal utility rules, and increasingly complex compliance expectations. This guide explains how to assess whether a beverage facility is truly ready for expansion, what technical and financial criteria matter most, and how to build a smarter project plan that protects long-term profitability. Yes, a beverage factory is ready for expansion only when five core conditions are met: current bottlenecks are clearly identified, the building and site can physically support additional process and packaging assets, water and wastewater systems have sufficient reserve capacity, the expansion delivers acceptable payback under realistic demand scenarios, and the project can be executed without destabilizing seasonal production commitments. In practice, that means a U.S. beverage producer should validate: If one or more of these areas is weak, expansion can still happen, but the project scope must be adjusted. Often, a targeted debottlenecking effort produces better returns than a full line addition. The table above shows why beverage plant expansion cannot be judged by sales growth alone. Even when customer demand is strong, utility or process limitations can turn a seemingly simple growth project into an expensive underperformer. The first step is separating market demand from operational readiness. A factory may have enough orders to justify more output, but if uptime, changeover discipline, sanitation windows, or tank utilization are weak, adding equipment may only magnify inefficiency. In the United States, where labor, construction, and utility costs vary sharply by region, expansion readiness must be measured with operating data, not assumptions. Producers serving retailers, foodservice channels, club stores, and contract manufacturing customers should review at least 12 to 24 months of operating history. This should include hourly performance by SKU family, downtime causes, shift staffing, utility peaks, warehouse turnover, and customer service penalties. Plants in high-growth beverage categories such as energy drinks, functional beverages, alcohol alternatives, premium mixers, and aseptic RTD coffee should also stress-test demand against packaging supply lead times and regional freight patterns. Useful readiness criteria include: U.S. beverage plants near major logistics hubs often have an advantage. For example, distribution from Indianapolis, Memphis, Kansas City, and Columbus can reduce outbound freight to broad regions of the country. However, those savings can be erased if the plant lacks wastewater permit flexibility or cooling capacity during summer production surges. At this stage, many manufacturers benefit from an outside engineering perspective. A firm like Disruptive Process Solutions approaches readiness from a business-first standpoint, focusing on whether capital will improve profitability rather than simply increase installed equipment. That mindset matters because the best answer is not always “build bigger”; sometimes it is “fix the process first.” This readiness matrix helps teams decide whether expansion capital should go into new production assets, utility reinforcement, software integration, or operational discipline first. The market growth trend above reflects a realistic view of continued U.S. beverage investment. Growth is not uniform across all categories, but the broader direction supports careful capacity planning, especially in high-value packaged beverage segments. The most important expansion question is simple: what is actually limiting throughput today? In beverage operations, the bottleneck is often dynamic. On one SKU run it may be blending, on another it may be filler speed, tunnel pasteurization, label application, secondary packaging, or palletizing. In some facilities, the true bottleneck is not hardware at all. It may be CIP turnaround time, PLC logic, changeover sequencing, or operator staffing. A good bottleneck study maps the full production path from ingredient receiving through batching, blending, treatment, filling, packaging, palletizing, warehousing, and loadout. It should look at both peak rate and sustained rate. Advertised equipment speed is rarely the number that matters; sellable output over an entire shift is what drives economics. For example, a carbonated soft drink plant in Texas may have a filler rated at 600 bottles per minute, yet only average 68% of theoretical output because syrup changeovers, CO2 management, capper stoppages, and downstream accumulation issues reduce run efficiency. In that case, buying a faster filler would not solve the problem. A better answer may be controls reconfiguration, accumulation redesign, or improved line balancing. This is where practical engineering experience matters. DPS has built a reputation by identifying hidden constraints before clients commit unnecessary capital. The company’s technology depth includes process engineering, controls engineering, PLC programming, automation, SCADA, and integration across utilities and production systems. In one representative situation, the real bottleneck was controls-related, and resolving the PLC limitation created a significant capacity gain without forcing a multimillion-dollar expansion. That kind of analysis protects capital and often improves payback more than a new asset purchase. This table shows that not every bottleneck requires major construction. Some can be solved through sequencing, controls, and process optimization, which usually produce faster returns. The bar chart highlights where expansion demand is strongest across beverage segments. High-growth categories typically justify faster investment decisions, but they also require more disciplined risk screening because product mix can shift rapidly. Even when demand and utilities support growth, the building may not. Space and layout feasibility is more than finding enough floor area for a new filler or canning line. U.S. plants must also consider access for installation, code-required clearances, sanitation zoning, traffic separation, mezzanine loading, forklift flow, ingredient staging, spare parts access, and future maintenance. Layout failures are expensive because they create lasting inefficiency. A line inserted into an already crowded building can generate chronic congestion between depalletizing, packaging material feed, QA hold zones, and finished goods staging. It can also compromise food safety design by crossing raw and finished traffic paths or by creating hard-to-clean dead spaces. For beverage categories such as kombucha, dairy beverages, and aseptic products, hygienic zoning becomes even more important. Additional tanks, valves, transfer piping, and CIP return routing must be evaluated as a system, not as isolated pieces of equipment. DPS supports this kind of planning through integrated engineering disciplines that include structural, mechanical, plumbing, electrical, process, and controls design. That matters during line addition studies because the “space” question often becomes a roof loading question, a utility corridor question, or an access and constructability question. For manufacturers reviewing possible reconfiguration or equipment relocation, the broader engineering and project delivery services available from an experienced design-build-manage partner can reduce coordination gaps and change-order risk. Layout reviews often reveal that minor relocation of existing assets can unlock better value than a building addition. In dense urban or suburban U.S. sites where land costs are high, reflowing operations may be more economical than expanding the footprint. Water and wastewater are among the most underestimated factors in beverage expansion planning. Beverage plants consume water for product, CIP, sanitation, boiler feed, cooling tower makeup, and general operations. The plant may be able to fit a new line physically, yet still fail expansion feasibility because municipal water pressure, pretreatment, or discharge permits cannot support added volume. This issue is particularly important in regions facing infrastructure or sustainability pressure, including parts of California, Arizona, Colorado, and fast-growing areas of the Southeast. Plants near major metros like Phoenix, San Diego, Charlotte, and Austin may encounter stricter water management expectations, rising rates, or longer permitting timelines. Wastewater is just as critical. Increased sugar loads, pH swings, suspended solids, alcohol content, dairy loads, or cleaning chemical discharge can overwhelm existing pretreatment systems. Municipal surcharges can quickly erode the economics of expansion if not modeled in advance. Strong beverage expansion planning therefore includes incoming water quality analysis, treatment capability review, peak-day and peak-hour demand modeling, sewer discharge characterization, and resilience planning. DPS brings relevant capabilities here through complete utility system integration, including process water systems, reverse osmosis, disinfection, CIP, boilers and steam, glycol systems, compressed air, refrigeration, cooling towers, and wastewater coordination. This is especially valuable for beverage manufacturers adding more complex products or high-sanitation processes. The main lesson is that beverage growth frequently depends on utility resilience as much as production equipment. A plant with strong water and wastewater planning is better positioned to support expansion, compliance, and sustainability goals at the same time. The area chart illustrates a clear shift toward water efficiency, reuse, and sustainability-driven utility planning through 2026. This is becoming a strategic advantage, not just a compliance checkbox. Once bottlenecks and utilities are understood, the next question is which equipment and technology investments will create scalable gains. In many U.S. beverage plants, a successful expansion requires more than just adding primary process equipment. It may involve packaging automation, inline quality monitoring, recipe control, data collection, energy management, or upgraded CIP architecture. Technology requirements vary by product type: Manufacturing capability should be reviewed holistically. DPS supports beverage manufacturers with system design and integration across fermentation systems, pasteurization and sterilization technologies, carbonation, blending and batching, filtration, aseptic processing, filling support, and broad utility infrastructure. In addition, the company manufactures selected process equipment such as tanks and custom CIP systems, giving clients a practical path when standard off-the-shelf solutions do not match project requirements. More on those equipment options can be found through the company’s process equipment capabilities. For 2026 and beyond, upgrade decisions are being shaped by three trends: higher automation adoption, tighter sustainability expectations, and stronger demand for operating data. Producers increasingly want systems that can scale without proportional labor growth. That means more attention to SCADA visibility, remote diagnostics, batch reporting, predictive maintenance, and energy tracking. These upgrade categories matter because expansion decisions should strengthen future competitiveness, not only solve today’s capacity gap. Every beverage plant expansion should be tested against realistic economics, not optimistic top-line assumptions. The financial model should compare at least three paths: debottleneck only, partial expansion, and full expansion. It should also model a downside case where demand grows more slowly than forecast, input costs rise, or startup takes longer than expected. In the United States, the cost of expansion is affected by location, labor rates, local permitting complexity, utility connection fees, sanitary design requirements, and whether the project includes a building expansion. A line installed in North Carolina or Tennessee may have a different cost profile than a similar line in Southern California or the Northeast corridor. Key financial categories include: Service capabilities are especially important here. DPS supports capital planning, feasibility studies, owner’s representation, project and program management, general contracting where licensed, and turnkey installation and integration. That end-to-end model helps manufacturers connect financial assumptions to actual execution realities, which is critical when estimating startup risk and payback timing. This example shows why payback can vary dramatically based on project type. Many of the strongest returns come from solving constraints before adding full-scale assets. The comparison chart reflects a common market reality: integrated project delivery tends to produce stronger outcomes because engineering, construction, controls, and startup decisions are aligned earlier. Timing can make or break an expansion. Beverage demand in the United States is often seasonal, with strong summer peaks for soft drinks, flavored waters, energy beverages, beer, and many RTD formats. Holiday demand can also drive spikes for spirits, mixers, and promotional packs. If a plant schedules installation during peak selling periods, revenue loss and customer service failures can outweigh the long-term benefit of the project. The best timing strategy starts with customer commitments, promotional calendars, weather-sensitive demand, packaging material lead times, and utility availability. A plant serving southeastern states through Atlanta or Florida lanes may face very different summer risks than one serving the Pacific Northwest from Portland or Seattle. Likewise, a brewery supplying Midwestern stadium and event channels may need winter shutdown windows, while a juice or dairy beverage plant may align around harvest cycles or school-year demand patterns. Expansion timing should also consider contractor access, equipment lead times, municipal permitting schedules, and startup labor readiness. U.S. utility interconnection or wastewater approval can take longer than the mechanical installation itself. A strong strategy usually includes phased implementation: By 2026, producers are also expected to factor in resilience planning. Heat stress, water restrictions, power instability in some regions, and stricter sustainability reporting can affect the ideal expansion window. Plants that sequence projects around these risks will be better prepared for long-term operating stability. A practical example helps illustrate how expansion feasibility should work. Consider a U.S. beverage manufacturer operating a multi-SKU facility near a major distribution corridor in the South. Sales growth from private label and co-packing customers suggested the need for a multimillion-dollar capacity expansion. Initial thinking focused on adding major new process equipment and increasing packaging speed. However, the feasibility review showed that the plant’s actual limits were more nuanced. The primary issues included inefficient controls logic, poorly sequenced CIP activity, and utility coordination gaps during product changeovers. Packaging assets were not fully synchronized, and realized throughput lagged theoretical capacity by a meaningful margin. Rather than immediately installing the largest possible expansion package, the team first corrected the real bottlenecks. Controls and sequencing improvements increased output, stabilized line performance, and improved labor effectiveness. Only after the plant captured those gains did it move into the next phase: targeted equipment and utility upgrades sized to realistic future demand. This phased approach is consistent with how DPS typically supports manufacturers: engineer the solution, manage execution, and keep profitability at the center of the decision. The company’s project model is built around aligning capital with operational reality, whether the need is a feasibility study, utility upgrade, equipment integration, relocation, or a complete growth plan. Additional project examples and outcomes can be explored through the firm’s case study portfolio. The core lessons from this case are clear: For U.S. beverage producers, this is often the difference between a profitable expansion and a costly underperforming project. What is the first sign that a beverage plant should consider expansion?The first sign is sustained sold demand that consistently pushes the plant near practical capacity, not just occasional sales spikes. That signal should be confirmed with OEE data, downtime records, and utility usage. How much reserve utility capacity should a plant have before adding a line?There is no single number for every site, but many plants aim for meaningful headroom in water, wastewater, compressed air, cooling, steam, and electrical systems. If current loads are already close to peak, utility upgrades should be part of the project. Can debottlenecking replace a full expansion?Often, yes. Controls improvements, CIP redesign, line balancing, tank utilization changes, and packaging upgrades can deliver significant gains at lower cost and with faster payback than a complete line addition. Which U.S. regions are attractive for beverage manufacturing expansion?That depends on market access, labor, freight, utilities, and permitting. Regions around Dallas-Fort Worth, the Carolinas, Tennessee, the Midwest logistics belt, and parts of the Southeast are frequently attractive, but each project must be evaluated site by site. How long does a beverage expansion feasibility study usually take?A focused study may take several weeks, while a more complex review involving utility modeling, multiple product types, building constraints, and capital staging may take longer. The right duration depends on risk and project size. What product categories most often require advanced hygienic design?Aseptic beverages, dairy beverages, kombucha, functional products with sensitive ingredients, and certain shelf-stable RTD products usually require more rigorous hygienic design and process control. Should expansion planning include future sustainability requirements?Yes. By 2026, water efficiency, energy performance, wastewater reduction, and broader reporting expectations will increasingly shape project approvals and operating costs in the United States. What kind of project partner is best for beverage expansion?The strongest partner is one that can evaluate process, utilities, controls, installation, and financial implications together. That integrated view reduces the risk of solving one problem while creating another. In summary, beverage factory expansion feasibility in the United States depends on rigorous assessment, not enthusiasm alone. The best projects begin with a direct answer to the real operating constraint, then move through layout, utilities, technology, capital modeling, and timing in a disciplined way. Manufacturers that take this approach are far more likely to add profitable capacity, protect service levels, and create a plant platform ready for the next phase of growth. -
7-Step Food Plant Equipment Installation Guide
Installing processing equipment in a U.S. food or beverage plant is not just a rigging exercise. It is a coordinated sequence of engineering review, utility planning, sanitary execution, controls integration, startup validation, and documentation handoff. Whether a manufacturer is adding a single tank in Wisconsin, moving a protein line in Texas, or commissioning a beverage co-packing facility in North Carolina, the installation process has to protect food safety, line efficiency, code compliance, and capital returns. A practical food plant equipment installation guide usually follows seven core steps: prepare the site, unload and position equipment, connect utilities, complete mechanical and electrical installation, calibrate and test the system, run startup and commissioning, and finalize documentation. In the United States, successful projects also require attention to OSHA access, FDA or USDA sanitary expectations, local building rules, electrical inspections, and production readiness. Plants that plan these steps in advance reduce downtime, prevent rework, and accelerate time to first saleable product. For buyers, operators, and project managers, the biggest mistake is treating installation as the last phase of a purchase order. In reality, installation begins when layout, utilities, drainage, floor loading, controls architecture, sanitation design, and operator workflow are reviewed before the equipment ships. This is especially important in major U.S. manufacturing corridors such as Chicago, Dallas-Fort Worth, Fresno, Omaha, Atlanta, Charlotte, and Southern California, where construction sequencing, freight timing, and labor coordination can materially affect project cost. Market conditions also matter. U.S. manufacturers are expanding beverage capacity, protein throughput, prepared foods automation, dairy processing, and aseptic systems. More projects are also being executed around tight shutdown windows, particularly near trade and logistics hubs such as the Ports of Los Angeles and Long Beach, Houston, Savannah, Newark, and Seattle-Tacoma. That makes installation planning as commercially important as engineering design. The chart above reflects a realistic growth pattern for food and beverage installation activity, driven by capacity expansion, reshoring, utility upgrades, automation, and sustainability programs. Through 2026, plants are expected to invest more heavily in controls, energy recovery, water reuse, and modular processing skids. This table shows why there is no universal installation template. A retort line in New Jersey, a brewery cellar in Oregon, and a marination system in Arkansas all require different execution plans even if the seven-step framework stays the same. Pre-installation site preparation determines whether the project will run smoothly or become an expensive sequence of field changes. Before equipment arrives, the plant should confirm final approved drawings, utility load calculations, floor loading, sanitary zoning, drain locations, ceiling clearances, access routes, and rigging points. This is also when teams verify whether the project area is classified for wet washdown, dry processing, allergen segregation, or hazardous vapor control. For U.S. plants, local requirements vary by jurisdiction. A project in Cary, North Carolina may move differently through permitting than one in Lake Forest, California, Houston, Texas, or Milwaukee, Wisconsin. If boilers, ammonia refrigeration interfaces, compressed air headers, or high-voltage additions are involved, lead times for inspection and utility tie-ins can shape the whole construction sequence. That is why a site-readiness review should include engineering, operations, maintenance, quality, EHS, and finance stakeholders. From a buying perspective, this is the phase where owners should ask whether the chosen equipment truly matches production goals. A plant may not need a larger filler, vessel, or cooker if the bottleneck is in PLC logic, CIP cycle time, changeover losses, or packaging discharge. Good installation planning should therefore include a bottleneck analysis, not just a layout walkdown. The most valuable output of this step is a signed site readiness package. That package should include current drawings, utility schedules, shutdown windows, contractor rules, safety plans, and a punchlist of unresolved items. Plants near major ports often benefit from using temporary laydown space because imported tanks, pumps, or process skids may arrive ahead of floor completion. Once equipment reaches the site, unloading and positioning need to be controlled with the same rigor as fabrication. Every crate, tank, skid, valve bank, and control panel should be inspected for freight damage, tagged against the bill of materials, and staged according to installation priority. Plants in freight-dense corridors such as Houston, Inland Empire, Chicago, and New Jersey often face narrow dock schedules, so receiving plans should define who inspects, who signs, where equipment is staged, and how preservation is maintained before set-in-place. Product type influences rigging strategy. Stainless tanks may require spreader bars and surface protection. Distillation columns need vertical lift planning and elevation control. Retorts, ovens, and tumble systems can require slab reinforcement or special skates. Compact skids for CIP, filtration, or blending may fit through existing openings, while larger cookers, fermenters, or bright tanks may need roof access or temporary wall removal. Plants should also think locally when selecting cranes, forklifts, and rigging contractors. A supplier with strong experience unloading standard packaging equipment may not be the right choice for sanitary process vessels or aseptic modules. Local knowledge around congested urban sites like Boston, Philadelphia, or Los Angeles can reduce risk substantially. A receiving log is essential. It supports warranty claims, tracks shortages, and helps commissioning teams know what can be tested immediately. If any sanitary components are exposed during storage, they should be re-cleaned and inspected before installation. Utility connection and alignment is where many projects either gain speed or lose it. At this stage, installers connect process water, hot water, steam, condensate return, compressed air, vacuum, glycol, refrigerant interfaces, wastewater, power, and controls wiring. Alignment includes not only mechanical centerlines but also pump orientation, motor coupling accuracy, valve accessibility, sensor placement, and slope for cleanable process piping. Food and beverage applications vary widely. Breweries and RTD plants often prioritize glycol, carbonation, clean steam, and Brix control. Protein facilities focus more on washdown power, drainage, compressed air, hot water, and hygienic raw-to-cooked segregation. Dairy systems require exact thermal integration, reliable CIP coverage, and validated flow paths. Aseptic systems demand the most disciplined utility design because pressure balance, sterilization pathways, and instrumentation reliability are mission-critical. By 2026, more U.S. plants are expected to invest in utility intelligence: smart meters, leak detection, batch-level energy monitoring, condensate recovery, and water reuse. That means installation teams should leave room for sensors, network drops, and future integration even if phase one does not activate all digital tools. This stage should end with a utility verification walkdown. Every line, valve, motor, and instrument must be tagged, tested for proper service, and cross-checked against as-built drawings. A beautiful installation can still fail if utilities are connected to the wrong destination or left unbalanced. The bar chart highlights current demand by industry segment. Beverage, co-packing, and protein remain especially active in the U.S. because they are closely tied to throughput gains, automation, and fast capacity additions. Mechanical and electrical installation is where fabrication intent becomes an operating line. Mechanically, this includes setting frames, supports, pipe bridges, pumps, valves, heat exchangers, conveyors, vessels, CIP loops, and clean utility components. Electrically, it includes power distribution, motor terminations, VFDs, safety circuits, panel checks, field I/O, instrumentation, and communication with PLC and SCADA platforms. At this point, quality of workmanship matters as much as schedule. Weld finish, passivation, gasket selection, conduit routing, cable segregation, washdown protection, labeling, and lockout provision all affect long-term reliability. U.S. buyers should ask installers for sanitary weld documentation, calibration plans, software version control, and startup support before mechanical completion is declared. Plants choosing between suppliers should evaluate more than bid price. The lowest-cost installer can become the highest-cost outcome if they lack food-grade piping experience, controls integration ability, or local trade coordination. This is especially true when multiple scopes overlap, such as HVAC, refrigeration, process piping, and controls in one high-care room. A disciplined mechanical and electrical phase should also include daily installation reports, redline markups, field issue logs, and quality hold points. That record becomes extremely valuable during commissioning and future audits. After installation is physically complete, the system needs calibration and testing before startup. This step verifies that instruments, actuators, motors, controls, and interlocks work as intended. Typical activities include loop checks, instrument calibration, pressure testing, leak checks, rotation checks, VFD parameter setup, valve stroke tests, temperature verification, load simulation, and dry runs. Testing should be sequenced from simple to complex. Start with standalone devices, move to skids, then to integrated process modules, and only then to production runs. For thermal systems such as HTST, UHT, retort, or cooking systems, testing must confirm control accuracy, hold conditions, alarms, and fail-safe behavior. For beverage and blending operations, calibration of flowmeters, Brix instrumentation, level transmitters, and carbonation controls has a direct effect on yield and consistency. This is also where plants can identify whether the original specification truly matches the application. For example, pumps sized for water may not perform well with viscous sauces, dairy concentrates, meat slurries, or high-particulate products. Proper FAT and SAT planning reduces these surprises, but field testing is still the real proof. Strong testing discipline lowers startup risk, protects regulatory readiness, and provides evidence for insurers, auditors, and future maintenance teams. The area chart reflects a growing trend toward smarter installations. By 2026, more owners will expect installed systems to support real-time diagnostics, batch records, energy tracking, and remote troubleshooting from day one. Startup and commissioning turn a tested system into a productive manufacturing asset. This phase typically includes sanitation verification, pre-op inspection, utility balancing, control sequence review, operator training, initial product runs, process tuning, performance acceptance, and final punchlist closure. In food and beverage plants, the first successful run is not enough; the system must prove repeatability, cleanability, and commercial viability. Commissioning should be based on agreed acceptance criteria. That may include rate per hour, fill accuracy, temperature profile, yield, CIP completion, utility consumption, OEE targets, or alarm performance. In a co-packing environment, startup also needs to account for recipe flexibility, package changeovers, and customer-specific quality protocols. Case studies across the U.S. show that the best commissioning outcomes happen when project teams include operations from the start. A technically perfect skid can still underperform if maintenance access is poor, HMI language is confusing, or sanitation crews cannot efficiently clean around support members and cable routes. Plants should therefore involve shift leaders, mechanics, QA supervisors, and line operators during SAT and startup runs. Future trends through 2026 will shape commissioning protocols as well. Expect more digital punchlists, remote OEM support, augmented troubleshooting, energy baseline tracking, and sustainability metrics such as water-per-batch or steam-per-pound-of-product. Policy pressure around water use, energy reporting, and resiliency planning will likely make these metrics more standard in larger U.S. facilities. This comparison chart illustrates why product and supplier fit matters. For complex food and beverage applications, the value is often in integrated engineering, controls, and commissioning support rather than in labor alone. Post-installation documentation is often underappreciated until a plant faces an audit, a troubleshooting event, a spare parts order, or a future expansion. A proper turnover package should include as-built drawings, panel schedules, I/O lists, software backups, instrument certificates, weld logs where required, O&M manuals, spare parts lists, training records, startup reports, and punchlist closure evidence. Documentation is not just administrative. It protects uptime, supports training, and preserves capital value. In regulated environments, it can also support FDA, USDA, SQF, or BRC expectations for traceability and controlled change. For multi-state operators, standardized turnover documents simplify maintenance across sites from California to Georgia to Ontario. Owners should insist that turnover records be searchable, current, and matched to the installed condition rather than buried in generic vendor manuals. If a line was field-modified during installation, the as-built set must reflect that reality. This is especially important for plants expecting future debottlenecking, automation upgrades, or sustainability retrofits. Plants that maintain strong turnover packages can also benchmark future projects better. They know what worked, what changed in the field, and where hidden costs appeared. Disruptive Process Solutions supports food and beverage manufacturers across the United States and Canada with engineering-led installation and integration services. The company operates from North Carolina and California while executing projects nationally, giving manufacturers access to a lean decision-making structure paired with broad project reach. You can learn more about the team on the company background page. From a technological capability standpoint, DPS works across structural, mechanical, plumbing, electrical, process, and controls engineering. That includes PLC programming, automation, SCADA integration, utility design, CIP systems, steam, compressed air, refrigeration interfaces, water treatment, thermal processing, aseptic applications, and recipe or batch control. This breadth matters because installation success depends on how well utilities, equipment, and controls work together rather than as separate scopes. From a manufacturing capability standpoint, DPS also provides branded process equipment such as storage and processing tanks, custom CIP systems, marination tumblers, and cooking vessels. That manufacturing perspective improves installability because equipment can be developed with field realities in mind, including footprint constraints, operator access, sanitary maintenance, and integration with upstream and downstream systems. Manufacturers exploring available systems can review the process equipment portfolio. From a service capability standpoint, DPS supports capital planning, feasibility studies, owner’s representation, project management, general contracting functions, system integration, installation, and commissioning under a Design Build Manage approach. This is especially useful for clients that want one accountable partner from concept through startup rather than fragmented trade management. Details on those capabilities are available on the service offerings page. The company is especially relevant to U.S. food and beverage operators that need practical business-minded execution: beverage plants scaling RTD or carbonated products, breweries expanding cellar systems, protein processors upgrading throughput, dairy sites modernizing thermal systems, and co-packers balancing flexible production with first-year profitability. For examples of real project execution and outcomes, see the project case studies. A useful illustration of this model is the way DPS approaches bottlenecks. Instead of automatically recommending more equipment, the team evaluates the real production constraint first, whether that is a vessel, a utility, a controls sequence, or a packaging handoff. That kind of honesty matters because the best installation project is not the most expensive one; it is the one that improves profitability with the right level of capital. For local suppliers and trade coordination, DPS works with vetted partner networks across the U.S. This matters in markets where local code interpretation, labor availability, and shutdown timing can vary widely. A project in California may require a different execution strategy than one in Tennessee or Alberta, but the operating philosophy remains the same: engineer the right solution, build it effectively, and manage it tightly so stakeholders reach startup with fewer surprises. How long does food plant equipment installation usually take?Simple skid installations may take a few days, while full line integrations or greenfield startup packages can take weeks or months. Schedule depends on utility readiness, shutdown windows, controls complexity, and inspection timing. What is the most common cause of installation delays in the United States?Incomplete site preparation is the biggest cause. Typical issues include missing utilities, inaccurate field dimensions, delayed permits, unavailable cranes, and late control panel approvals. Should a plant buy equipment first and plan installation later?No. Buying advice for most U.S. facilities is to evaluate layout, utility loads, sanitation needs, controls integration, and operator workflow before release to fabrication. Installation planning should begin early. Which industries need the most detailed commissioning?Aseptic, dairy, beverage, thermal processing, and ready-to-eat food applications usually require the most structured testing and commissioning because process control and sanitation performance directly affect product safety and shelf life. What documents should be handed over after startup?At minimum: as-built drawings, electrical diagrams, software backups, calibration certificates, O&M manuals, spare parts lists, training records, and a signed commissioning report. How can a plant choose between local suppliers and national integrators?Use local suppliers when the scope is narrow and site conditions are straightforward. Use an engineering-led national integrator when utilities, controls, sanitary design, and multi-trade coordination are central to project success. What trends will shape installation projects in 2026?Expect more automation, sustainability metrics, water reuse systems, energy monitoring, remote support, cyber-aware controls integration, and stronger policy pressure around resource efficiency and resiliency. Is relocation of used equipment a good option?It can be, especially when lead times are long. But the equipment must be inspected, requalified, and matched to current utility, code, and throughput requirements. Relocation often succeeds when paired with controls and utility upgrades. What applications benefit most from turnkey installation?Brewing, spirits, RTD, juice, dairy, sauces, prepared foods, protein lines, CIP systems, retort, and aseptic processing all benefit because the risk sits at the integration points between utilities, equipment, and controls. Why is post-installation documentation so important?Because production teams inherit the system long after the construction crew leaves. Good documentation lowers downtime, speeds training, supports audits, and improves future expansion planning. -
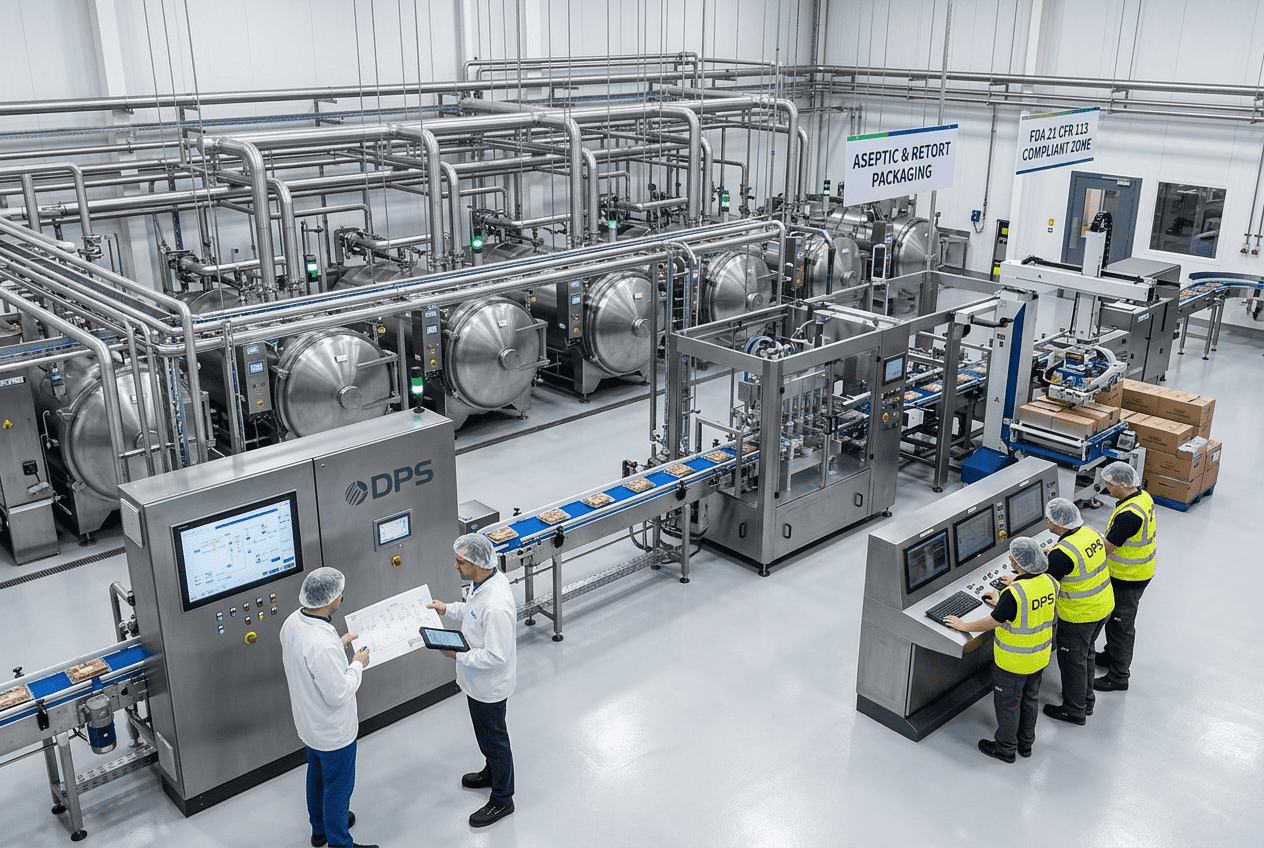
Food Facility Equipment Validation Process
Food and beverage manufacturers in the United States cannot treat equipment startup as a simple installation task. When a system affects product safety, shelf life, sanitation, throughput, or regulatory compliance, it needs a structured validation approach. That is where design qualification, installation qualification, operational qualification, and performance qualification come together. A disciplined IQ OQ PQ program helps confirm that equipment is correctly specified, properly installed, consistently operated, and capable of producing acceptable product under routine plant conditions. In U.S. facilities, this is especially important for aseptic lines, pasteurization systems, retorts, CIP skids, fillers, blending systems, fermentation vessels, distillation assets, dairy processing equipment, protein processing lines, and utility systems that directly influence process control. Whether a project is located near Chicago, Fresno, Dallas-Fort Worth, Atlanta, Charlotte, Houston, or the Port of Los Angeles and Long Beach logistics corridor, the same principle applies: validation protects output, reduces startup risk, and supports FDA, USDA, SQF, and BRC expectations. The food facility equipment validation process is the structured method used to prove that a new or modified system is fit for its intended purpose in a U.S. manufacturing environment. In practical terms, the process usually follows four qualification stages: For most food and beverage plants in the United States, a strong validation package also includes risk assessment, calibration review, sanitation verification, training records, preventive maintenance setup, spare parts planning, and change control. If the line later undergoes significant modification, relocation, software revision, throughput increase, or formula change, revalidation may be required. Companies planning capital projects should treat validation as a business tool, not just a compliance step. A well-written protocol shortens commissioning time, reduces waste, protects brands, and gives operations teams confidence that startup data can stand up to customer and regulatory scrutiny. This table shows why food equipment validation is more than a single approval event. It is a lifecycle discipline that begins in design and continues through operation, maintenance, and future modifications. IQ OQ PQ protocols form the backbone of a defensible equipment qualification strategy. In the United States, food manufacturers often borrow terminology and rigor from pharmaceutical validation, then adapt it to food, beverage, dairy, protein, and aseptic production realities. The exact level of documentation depends on product risk, customer standards, and the criticality of the process step. IQ focuses on whether the system is installed correctly. This includes verification of model numbers, materials of construction, weld quality where relevant, utility connections, slope and drainability, instrument calibration, electrical power, grounding, guarding, and software or firmware versions. OQ confirms the system functions correctly through defined tests. Examples include pump speed ranges, flow rate verification, temperature control response, valve sequencing, recipe management, emergency stop logic, alarm acknowledgment, password controls, and sanitation cycle timing. PQ goes one step further and asks whether the process performs reliably in real production. For a ready-to-drink beverage line, this may include fill weight consistency, carbonation control, dissolved oxygen targets, package integrity, and line efficiency. For a protein cooking line, it may include lethality parameters, belt speed consistency, yield, and post-cook microbiological acceptance. The strongest protocols are risk based. A low-risk utility skid may need a lighter package than an aseptic filling line or a retort system handling shelf-stable products. U.S. plants serving national retail, foodservice, or export markets often apply more robust protocols because customer audits increasingly expect documented proof of process control. Validation scope also varies by product type. Beverage operations in California, Oregon, North Carolina, and Texas often emphasize blending accuracy, thermal treatment, carbonation, and CIP effectiveness. Meat and poultry facilities in the Midwest and Southeast may focus more on cook validation, chilling control, sanitation design, metal detection, and packaging integrity. The line chart illustrates a realistic market trend: more U.S. food and beverage projects are adopting formal qualification protocols as automation, customer audits, and traceability expectations increase. This comparison helps buyers align validation depth with actual process risk. Not every skid needs the same burden of testing, but high-consequence food safety systems should always receive a rigorous protocol. Design Qualification is where many successful projects are won or lost. If the design basis is weak, later IQ, OQ, and PQ work becomes expensive and reactive. Design Qualification should translate commercial goals into engineering requirements before procurement and fabrication move too far forward. A complete DQ package in the United States usually starts with a user requirements specification. This document should define product type, capacity targets, changeover expectations, sanitation method, ingredient characteristics, utility availability, automation integration, data capture needs, packaging format, safety needs, environmental constraints, and relevant regulatory standards. For example, a dairy processor in Wisconsin may need hygienic design suitable for allergen segregation and frequent washdown. A beverage co-packer near Dallas may prioritize high-speed filling, syrup room integration, compressed air reliability, and future line expansion. A protein processor in Arkansas or Georgia may place special emphasis on drainage, hygienic welds, temperature control, and robust cleanability. Key design qualification requirements include: Buying advice matters at this stage. Manufacturers should not choose equipment solely on purchase price. The better question is total lifecycle value. A lower-cost asset may create higher sanitation labor, more downtime, poor parts availability, or difficult controls integration. In trade hubs like Chicago, Houston, and New Jersey, the fastest delivery option may still not be the best fit if the design misses local utility realities or plant workflow constraints. This table shows the purpose of DQ: preventing avoidable problems before equipment reaches the floor. Early review is usually the cheapest and fastest form of validation. Many U.S. manufacturers also use DQ to align local supplier selection. Imported equipment may be excellent, but buyers should confirm domestic support, spare parts availability, and local field service response. Plants operating near Savannah, Memphis, Kansas City, or the Inland Empire often prioritize suppliers that can support both logistics and startup schedules without long waits for replacement components. Installation Qualification verifies that the approved design was actually executed in the plant. This step becomes especially important on multi-trade projects where mechanical, electrical, controls, refrigeration, utility, and sanitary piping work are installed by different teams. In practice, IQ should not begin only after complete installation. Good projects create pre-IQ punch lists during construction so the final qualification phase is faster and cleaner. Typical IQ steps include: Installation Qualification is also where local code considerations enter the picture. Facilities in California may need closer review of energy and utility impacts; facilities in the Southeast often plan around washdown conditions and humidity; Gulf Coast plants may evaluate corrosion resistance and storm resilience more carefully. If equipment is installed in older buildings near legacy manufacturing corridors such as Philadelphia, Cleveland, or St. Louis, existing infrastructure limitations can also affect IQ outcomes. This IQ table translates installation work into objective checks. Plants that skip these details often discover issues later during OQ, when troubleshooting is more expensive and disruptive. When buying from local or regional suppliers, manufacturers should ask whether the vendor supports SAT participation, startup technicians, training documentation, and as-built closeout. These factors can materially reduce the time between delivery and qualified operation. Operational Qualification testing proves the equipment functions properly throughout its intended operating range. This is where protocols become highly detailed, because the goal is to challenge the system under expected and boundary conditions while documenting objective outcomes. OQ normally covers both normal and abnormal conditions. For a CIP skid, that could include setpoint verification, temperature hold timing, chemical concentration confirmation, return conductivity switching, low-level alarms, pump interlocks, and emergency stop behavior. For a beverage blending line, OQ may test dosing accuracy, Brix control, inline meter response, batch sequence logic, recipe permissions, and failed instrument scenarios. OQ should include controls and automation testing in modern U.S. plants. Many line failures are not mechanical but logical: wrong alarm limits, incorrect permissives, weak data historian setup, recipe mismatch, or poor interface with upstream and downstream equipment. Facilities operating sophisticated SCADA or MES layers should verify data transfer, user access, audit-style event recording, and backup recovery capability. The bar chart reflects where operational qualification tends to be most demanding. Aseptic, beverage, and dairy projects often have tighter automation and control requirements because product safety and consistency depend on narrow operating windows. Operational testing should not be reduced to a symbolic startup exercise. This table shows how a credible OQ creates evidence that the equipment is controllable, predictable, and safe before full production begins. From a buying perspective, this is where strong suppliers stand out. Vendors that provide clear functional descriptions, complete I/O lists, alarm schedules, and FAT records make OQ faster. Weak documentation from a supplier often transfers cost directly to the plant during startup. Performance Qualification verifies that the process delivers acceptable production results under real operating conditions. Unlike OQ, which often focuses on function, PQ proves routine capability. The line should run with normal operators, approved raw materials, established sanitation procedures, and realistic production scheduling. PQ requirements differ by product category: PQ should use preapproved acceptance criteria and statistically meaningful evidence where practical. One good run is rarely enough. Many U.S. facilities require multiple successful batches or production runs, especially if the equipment is critical to food safety or supports major retailer programs. The area chart highlights a clear 2026 trend: Performance Qualification is becoming more data driven. More plants are using historian data, digital batch records, automated trend review, and integrated quality systems to prove repeatability instead of relying only on paper records. This table connects validation to plant economics. PQ is not only about compliance; it proves the equipment can support margin, schedule, and customer expectations. Case experience across the U.S. shows that many apparent capacity problems are not equipment-size problems at all. Controls logic, sequencing, or line balance issues can limit output. Reviewing documented startup history and the lessons from prior integration work can save capital and help teams avoid overbuying. A useful way to evaluate this is to review practical execution examples and project outcomes through detailed food and beverage project case studies before committing to a major equipment package. Validation does not end when PQ is approved. Equipment remains in a validated state only if changes are controlled. Revalidation may be partial or full depending on what changed and how the change affects risk. Common triggers for revalidation in U.S. food facilities include: A practical change control system should classify changes by risk. Minor non-product-contact modifications may need only documented review, while changes to critical control points, thermal process logic, or aseptic barriers may require repeating significant portions of OQ and PQ. By 2026, revalidation is increasingly tied to digital maintenance and automation platforms. Plants are using version control, electronic deviation management, and system backups to decide when a change crosses the threshold into requalification. Sustainability is also influencing change control: heat recovery upgrades, water reuse systems, energy monitoring, and chemical optimization projects can affect process conditions and should be reviewed for validation impact. Policy expectations are also moving toward stronger traceability and documented preventive control evidence. Even where a regulation does not explicitly require the phrase IQ OQ PQ, the ability to prove design intent, installation correctness, functional control, and performance consistency remains highly valuable during customer audits and regulatory inspections. The comparison chart illustrates a common buying reality in the United States: integrated project partners often provide better validation support than equipment-only sellers, especially on complex capital programs that involve utilities, controls, and commissioning. Good documentation is what turns qualification activity into defensible validation evidence. In the United States, food manufacturers may need to satisfy internal quality systems, external customer standards, and regulatory expectations at the same time. Documentation should therefore be accurate, legible, complete, approved, and easy to retrieve. Typical validation documentation includes: Documentation should match the regulatory environment. FDA-regulated beverage, dairy, and ready-to-eat food operations may focus heavily on preventive controls, sanitary design, and process records. USDA-regulated meat and poultry facilities often require strong operational support for lethality, sanitation, and process integrity. GFSI-benchmarked schemes such as SQF and BRC also raise expectations for documented evidence and controlled procedures. Plants should avoid creating protocols that are too generic. A validation package for a brewery in Colorado should not look identical to one for an aseptic dairy plant in upstate New York or a protein processor near Omaha. Records must reflect actual product risk, actual equipment function, and actual plant operating conditions. For manufacturers planning large upgrades, it often helps to involve a partner that can bridge engineering, installation, integration, and compliance. Teams that understand capital planning, owner representation, commissioning, and field execution can usually create cleaner turnover packages and better audit readiness. Companies looking for broader project support can review integrated food and beverage engineering services as part of their validation planning, rather than treating qualification as an isolated paperwork exercise. This final documentation table explains why record structure matters. Good execution without good records is difficult to defend. Good records without real execution are even worse. The goal is alignment between what was planned, what was installed, what was tested, and what is now being run in production. Disruptive Process Solutions supports food and beverage manufacturers across the United States and Canada with a practical, execution-focused approach to capital projects. Rather than acting only as a contractor, the company is built around the idea that engineered projects should improve long-term profitability, not simply complete a scope on paper. On the technology side, DPS works across process, mechanical, structural, plumbing, electrical, and controls disciplines. That includes automation, PLC programming, SCADA integration, batching logic, utility systems, and process design for applications such as pasteurization, aseptic processing, carbonation, blending, filtration, water treatment, fermentation, retort, dairy processing, protein systems, and plantwide CIP. This technical breadth is valuable during qualification because IQ OQ PQ success often depends on how well process equipment, controls, and utilities perform as one integrated system. On the manufacturing side, DPS also supplies branded process equipment, including storage and processing tanks, custom CIP systems, marination tumblers, and cooking vessels. That perspective matters because qualification begins well before site startup. It starts with equipment design choices, material selection, access for sanitation, controls readiness, and fabrication details that influence field acceptance. Manufacturers considering packaged systems can explore selected process equipment solutions when evaluating validation-ready designs. On the service side, DPS provides process engineering, capital planning, owner’s representation, project and program management, general contracting where licensed, installation oversight, and full system integration. The company’s Design Build Manage model is intended to reduce gaps between concept, procurement, construction, and startup. For clients, that can mean better visibility into schedule risk, cleaner coordination among trades, and stronger project closeout documentation. More background on the team and execution philosophy is available through the company’s about page. DPS serves both beverage and food manufacturers, from brewing, spirits, wine, kombucha, juice, dairy beverages, and ready-to-drink products to proteins, prepared foods, sauces, dairy foods, aseptic applications, and co-packing operations. Because many projects involve a mix of utilities, sanitation constraints, automation, and regulatory pressure, the company emphasizes direct problem solving and transparent decision making. That is especially valuable when validation reveals that a process bottleneck is caused by controls logic or line integration rather than by the need for more capital equipment. For U.S. manufacturers planning greenfield, brownfield, relocation, or emergency execution work, the most successful validation outcomes usually come from integrating design review, installation oversight, startup strategy, and documentation planning from the beginning rather than trying to reconstruct the record at the end. 1. Is IQ OQ PQ legally required for every piece of food equipment in the United States?No. The exact terminology is not mandated for every asset, but the underlying expectation to verify suitability, correct installation, controlled operation, and consistent performance is widely aligned with good manufacturing practice, customer audits, and risk management. 2. Which systems most often need full validation?High-risk or high-impact systems usually justify the most formal protocols, including pasteurizers, retorts, aseptic lines, CIP systems, fillers, batching systems, and critical utilities that directly affect product safety or quality. 3. What is the difference between commissioning and validation?Commissioning proves that a system is started up and functioning. Validation proves, with documented evidence, that it is suitable for its intended purpose and consistently performs under defined conditions. The two activities should be coordinated but not confused. 4. How long does the validation process take?It depends on project complexity. A simple skid may be addressed in days, while a large integrated line or thermal process can require weeks of preparation and staged execution across FAT, SAT, IQ, OQ, and PQ. 5. Should validation begin after installation?No. The best results come when validation planning begins during concept and design. User requirements, risk assessment, acceptance criteria, and documentation structure should be established before procurement and fabrication are complete. 6. How many successful runs are needed for PQ?There is no universal number. The requirement should be based on risk, process variability, customer standards, and product type. Critical food safety systems often need multiple successful runs with clearly defined acceptance criteria. 7. When is revalidation necessary?Revalidation is typically needed after major changes to formulas, capacity, controls software, utilities, sanitary design, process timing, or critical instruments. A formal change control review should decide the level of repeat testing. 8. Can local suppliers support validation, or do we need a national partner?Either can work, but support capability matters more than geography alone. Ask whether the supplier provides field startup, documentation, controls support, spare parts access, training, and help with site acceptance and qualification records. 9. What are the biggest causes of validation delays?Late document collection, unclear user requirements, missing calibration records, unfinished field punch items, poor controls documentation, and changing acceptance criteria during startup are among the most common causes. 10. What should buyers ask before purchasing a new system?Ask for a clear design basis, hygienic design details, utility requirements, controls architecture, FAT scope, installed support expectations, documentation package, training plan, spare parts list, and how the vendor will support IQ OQ PQ execution in the United States. -
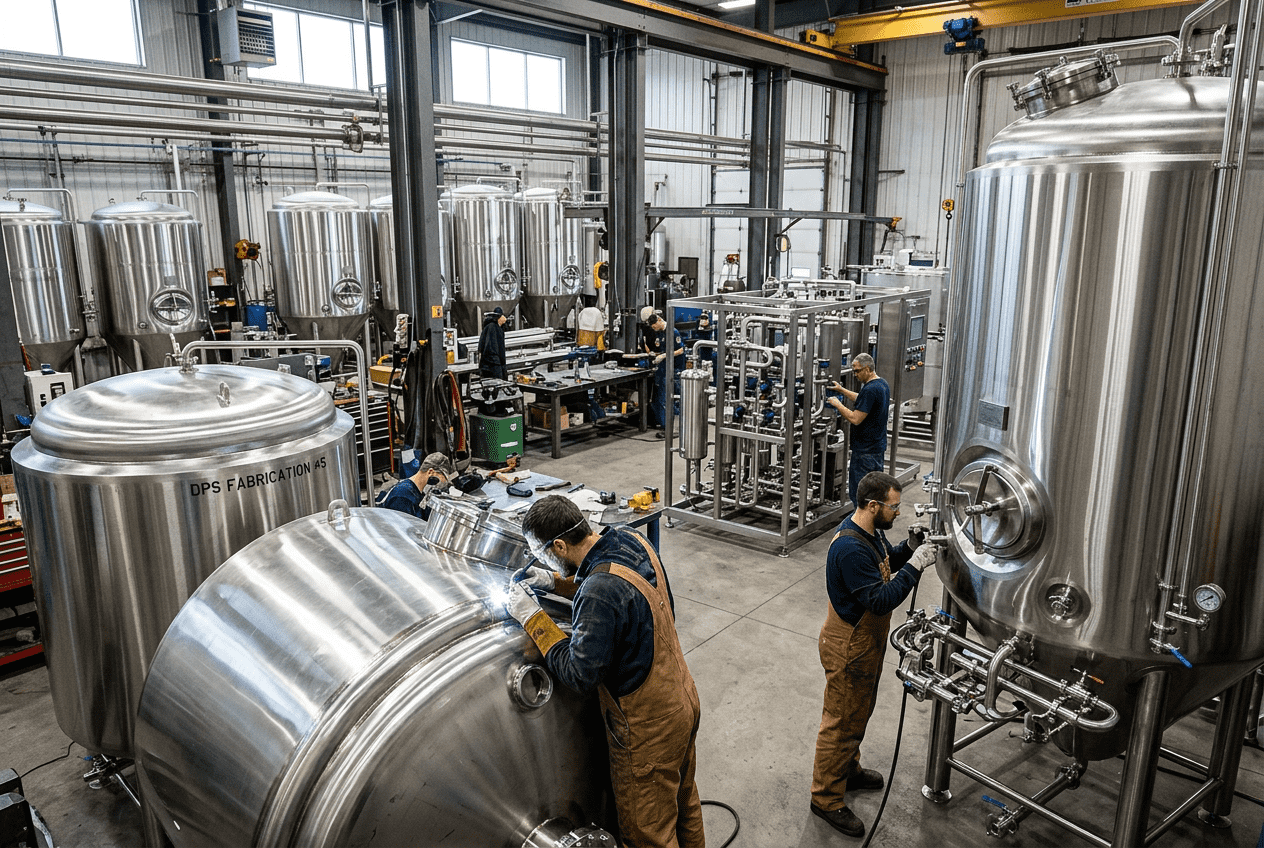
Food Plant ROI Modeling for Capital Projects
Food plant ROI modeling helps manufacturers decide whether a capital project will create measurable financial value. In the United States, food and beverage operators use ROI models to test expansion plans, utility upgrades, automation investments, new processing lines, facility relocations, and greenfield builds before committing capital. A strong model combines revenue assumptions, production throughput, labor efficiency, utility demand, maintenance costs, downtime risk, financing structure, tax effects, and resale or terminal value into one decision framework. For food processors in hubs such as Chicago, Dallas-Fort Worth, Fresno, Los Angeles, Atlanta, Charlotte, Kansas City, and the New Jersey distribution corridor, ROI modeling is no longer optional. With rising labor costs, volatile ingredient prices, stricter food safety compliance, and pressure to scale quickly, management teams need a disciplined method to compare projects and allocate capital where it produces the highest return. Companies that approach capital planning carefully often outperform those that buy equipment first and justify it later. That is especially true in regulated sectors such as dairy, proteins, prepared foods, sauces, aseptic processing, and beverage production, where layout, utilities, controls, sanitation, and commissioning all affect commercial outcomes. A well-built ROI model does not simply answer, “Will this project pay back?” It answers, “When, under which assumptions, and what operational conditions must be true for the project to be profitable?” At a practical level, food plant ROI modeling is a structured financial analysis used to estimate the expected return from a capital project over a defined period, usually five years. The model converts engineering choices into business outcomes. For example, a new HTST pasteurizer, a high-speed filling line, a retort upgrade, a protein marination line, or an automated CIP system changes throughput, labor needs, scrap, energy use, maintenance frequency, and product mix. Each of those variables affects cash flow. The quickest way to think about it is this: a manufacturer estimates total project cost, projects annual benefits, subtracts annual operating costs, applies taxes and financing where needed, and then calculates investment metrics such as NPV, IRR, payback period, and cash-on-cash yield. If those outputs clear the company’s hurdle rate and strategic requirements, the project is worth deeper development. In the U.S. market, the strongest models also reflect regional realities. A plant in California may face higher utility and labor costs than a facility in the Midwest. A Gulf Coast beverage operation tied to Houston logistics may have different freight assumptions than a Northeast co-packer shipping through the Port of Newark. A poultry plant in Arkansas may prioritize labor reduction, while a beverage project in North Carolina may emphasize fast commissioning and first-year profitability. Food manufacturers should also separate direct savings from strategic gains. Direct savings include labor reduction, yield improvement, waste reduction, energy savings, and lower maintenance. Strategic gains include higher capacity, entry into new channels, better food safety compliance, more reliable customer service, and the ability to attract larger retail or co-manufacturing contracts. The table above matters because many weak ROI models focus only on a single savings line and ignore the broader operating system. In food processing, the project is rarely just the machine. It includes utility loading, process integration, sanitation design, line balance, controls logic, startup performance, and workforce adoption. Food plant ROI modeling is the bridge between engineering design and capital decision-making. In a food or beverage environment, return on investment analysis must reflect the plant as an interconnected system, not a collection of standalone assets. A sauce blending line impacts vessel sizing, CIP duration, steam demand, batching accuracy, operator staffing, hold times, and finished goods scheduling. A dairy expansion affects homogenization, cooling, filler uptime, storage capacity, and sanitation windows. A protein system can alter labor, throughput, USDA inspection workflow, and waste streams all at once. Because of that complexity, ROI modeling should start with a business case, not a quote. Management teams need clarity on the commercial objective: increase volume, reduce conversion cost, improve product quality, enter a new package format, create redundancy, meet food safety requirements, or consolidate multiple sites. Once that objective is defined, the model should map each financial driver to a measurable plant outcome. For U.S. manufacturers, food plant investment analysis is often used in these situations: An effective partner can help align these operational questions with the financial model. Disruptive Process Solutions approaches capital projects from a profit-first perspective, helping food and beverage manufacturers evaluate whether a project is commercially smart before the project gains momentum. That matters because the best ROI model often reveals that the original scope is not the best use of capital. In real projects, it is common to discover that a throughput bottleneck sits in automation logic, line balancing, utility constraints, or material flow rather than in the piece of equipment a client initially wants to buy. That is why financial modeling should happen alongside process review, facility planning, and execution strategy. The line chart above illustrates a realistic upward trend in U.S. food plant capital spending, driven by reshoring, automation, compliance upgrades, and network expansion. For operators near major logistics hubs such as Memphis, Savannah, Long Beach, and Dallas, that trend raises the cost of delay and increases competition for contractors, long-lead equipment, and skilled trades. Most food plant ROI models in the United States use four primary metrics. Each metric answers a different executive question, so none should be used in isolation. Net Present Value (NPV) measures the present value of future cash flows minus the upfront investment. It tells you how much value the project creates in today’s dollars after accounting for the cost of capital. If a project has a positive NPV, it is creating value above the company’s hurdle rate. Internal Rate of Return (IRR) is the discount rate at which the project’s NPV equals zero. It is useful for comparing projects of different sizes, although it should not replace NPV when choosing between mutually exclusive alternatives. Payback Period measures how long it takes for cumulative cash flow to recover the initial investment. Many privately held manufacturers still rely heavily on payback because it is intuitive and linked to risk tolerance. Cash-on-Cash Yield compares annual pre-tax cash flow to the initial cash invested. This metric is especially useful when financing structure, phased rollouts, or staged equipment purchases affect how much actual cash leaves the business. The best practice is to use all of these together. For example, a large UHT beverage project in California may show a longer payback but still produce strong NPV because of durable multi-year cash flow. A lower-cost automation upgrade in Tennessee may have a very fast payback but a smaller absolute value contribution. Senior leadership needs both perspectives. For lender presentations, it is also useful to show debt service coverage impact, because banks and private credit groups want to understand whether the project strengthens the borrower’s ability to service obligations. Investor audiences often focus more on IRR, margin expansion, and scalability. A five-year model is common because it balances visibility with uncertainty. In food manufacturing, customer contracts, category shifts, ingredient volatility, and labor conditions can change materially over longer periods, so a five-year horizon often produces the most actionable forecast. The recommended structure includes these blocks: The most reliable models begin with physical process assumptions. If a new packaging line adds 120 units per minute, the model should test whether upstream blending, storage, utilities, labor, and warehouse flow can support that volume. A projected revenue increase is not credible if the full plant cannot run at the assumed rate. Below is a simplified structure for a five-year model that a food or beverage plant could use for a new process line, utility system, or expansion package. This example shows why five-year models are useful. Year 1 often includes ramp-up inefficiency, operator learning, validation work, and lower utilization. By Year 3 or Year 4, the project may generate its most meaningful returns. A model that only looks at Year 1 can badly undervalue a strategic investment. When manufacturers need support translating process design into a finance-ready model, the combination of engineering insight and project execution matters. DPS’s food and beverage engineering services are often relevant here because process engineering, capital planning, owner’s representation, and project management all influence the credibility of the financial forecast. Forecasting CAPEX and OPEX accurately is one of the hardest parts of ROI modeling. Many disappointing projects do not fail because the concept was poor; they fail because budgets overlooked integration, utilities, site readiness, controls, or startup support. CAPEX in a food plant model should include far more than equipment price. It typically covers process equipment, utility systems, structural work, MEP trades, controls integration, freight, rigging, installation, commissioning, validation, permitting, contractor conditions, contingency, and working capital effects if inventory grows. In retrofit projects, shutdown planning and temporary operations should also be considered. OPEX forecasting should account for labor, ingredients and packaging tied to added volume, water, wastewater, electricity, natural gas, steam, refrigerants, chemicals, CIP cycles, maintenance labor, spare parts, compliance testing, and sanitation time. For some product categories, waste disposal and giveaway can materially affect ROI. The explanation behind this table is simple: every underestimated line item weakens ROI credibility. In protein, dairy, and aseptic applications, utility and sanitation loads can be just as important as the core process equipment. A beverage line may require not only fillers and bright tanks, but also syrup rooms, carbonation control, compressed air, cooling towers, and water treatment to achieve promised throughput. This is where technological capability matters. DPS supports projects that require structural, mechanical, plumbing, electrical, process, and controls engineering, including PLC programming, automation, and SCADA. Those capabilities are important to ROI modeling because capital returns depend on integrated system performance, not just on equipment nameplate ratings. Manufacturing capability also affects ROI. Custom tanks, CIP systems, tumblers, and cooking vessels can reduce lead times or improve fit to the process if designed correctly. Manufacturers evaluating equipment alternatives can review process equipment solutions to compare packaged versus customized approaches in their business case. Every ROI model should include sensitivity analysis. Food manufacturing assumptions are inherently uncertain. Ingredient costs move. Retail demand changes. Labor markets tighten. Yields fluctuate. Utilities spike during hot summers or cold winters. A project that only works under one perfect assumption set is not a robust investment. Sensitivity analysis tests how outputs such as NPV and payback change when a single variable moves while others remain constant. The most common variables in food plant capital models are: For a beverage co-packer near Atlanta or Phoenix, volume attainment and startup timing may be the biggest risks. For a protein processor in Omaha or Sioux Falls, labor efficiency and yield may dominate. For a dairy plant in Wisconsin or Idaho, utility and refrigeration assumptions may be more material. The table shows that not all variables are equally important. Executives should identify the two or three assumptions that most heavily influence value and focus diligence there. If startup delay destroys the model, invest more in project management, commissioning, and operator readiness. If yield drives the economics, validate process performance before final approval. The bar chart indicates where capital demand is likely to be strongest across major U.S. food and beverage segments. High co-packing and beverage demand is consistent with current market behavior, especially in Sun Belt growth markets and major consumer distribution zones. Sensitivity analysis changes one variable at a time. Scenario planning changes several together to show realistic operating conditions. Every food plant ROI model should include at least three scenarios: base, optimistic, and pessimistic. This is especially important when project outcomes depend on customer wins, labor availability, commodity markets, or regulatory timing. The base case should reflect the most likely operating outcome using defendable assumptions. The optimistic case should not be fantasy; it should represent a plausible upside if commercial execution, startup, and utilization all go well. The pessimistic case should capture realistic downside risks such as delayed commissioning, lower contract volumes, higher utility cost, or slower labor savings capture. For U.S. manufacturers, scenario planning is particularly useful in these cases: The explanation behind scenario planning is that capital allocation is as much about resilience as upside. If the downside case still preserves positive value and acceptable leverage metrics, the project may be a strong candidate. If the downside case turns sharply negative, leadership should revisit scope, phasing, or contracting strategy. The area chart highlights a major 2026 trend: more food plant ROI models now assign explicit value to automation, data visibility, energy efficiency, water reuse, and sustainability-linked compliance. Companies in states with higher utility costs or ESG reporting pressure are increasingly quantifying those benefits rather than treating them as secondary. Most bad ROI models fail in predictable ways. They either overestimate benefits, underestimate installed cost, ignore operating complexity, or rely on assumptions that plant operations do not support. The first common mistake is using equipment vendor throughput numbers as if they were plant throughput numbers. A filler may run at a certain speed in a factory acceptance test, but actual plant output depends on product characteristics, changeovers, sanitation, upstream supply, operator skill, and downstream packaging constraints. The second mistake is excluding indirect costs. These include shutdown losses, permitting, freight, local code upgrades, foundation work, controls integration, spare parts, cybersecurity, or training. In retrofit projects, demolition and temporary production workarounds can materially affect total cost. The third mistake is assuming all added capacity will sell immediately. Revenue forecasts should reflect contract status, customer concentration, seasonality, freight economics, and market access. Plants serving the Midwest may have different margin assumptions than those shipping into coastal metropolitan areas such as New York, Los Angeles, or Miami. The fourth mistake is ignoring commissioning risk. In food and beverage, startup often determines ROI more than the design itself. Delays in water treatment, steam quality, CIP tuning, controls debugging, or operator training can move payback materially. The fifth mistake is building the model without operations input. Finance teams need plant managers, maintenance leaders, quality teams, and engineering stakeholders involved from the beginning. The comparison chart illustrates a common ROI tradeoff. Standard packages may look cheaper upfront, but integrated engineered solutions often outperform in lifecycle cost, customization, startup support, and scalability. In many food plants, that difference is what separates a quoted project from a profitable project. Service capability plays a direct role here. A design-build-manage approach can reduce the disconnect between concept, execution, and operating reality. When engineering, general contracting, equipment supply, installation, and project management are coordinated, the ROI model usually becomes more reliable because scope gaps are discovered earlier. Readers looking for implementation examples can review capital project case studies to see how execution strategy affects commercial outcomes. An ROI model is only useful if decision-makers trust it. Investors and lenders want clarity, discipline, and transparency. That means your presentation should be concise, assumption-based, and backed by plant logic. Start with the business problem. Explain whether the project is solving a capacity constraint, reducing conversion cost, entering a new category, improving compliance, or enabling geographic expansion. Then show the current-state operational bottleneck and the proposed future-state workflow. Next, present the cost summary and assumptions. Break CAPEX into equipment, installation, utilities, controls, building work, contingency, and startup. Show volume assumptions, margin assumptions, and ramp-up timing. Then walk through the base case, downside case, and upside case. For lenders, include financing needs, debt service impact, collateral considerations, and key project milestones. For investors, emphasize EBITDA uplift, scaling path, IRR, and strategic option value. Both groups appreciate a clear risk register that identifies what could go wrong and what management is doing to mitigate it. Use charts, but do not overwhelm the audience. One page on investment summary, one on assumptions, one on scenario outcomes, one on risks, and one on execution plan is often enough for the initial review. Also remember that credibility comes from humility. If your assumptions rely on winning a major account not yet signed, say so. If utility pricing is uncertain in a high-cost region, identify the range. If the project depends on specialized trades in a tight market like Southern California or parts of Texas, discuss that openly. Transparent models are funded more often than perfect-looking ones. For companies preparing a capital request, it also helps to work with a partner that understands both manufacturing realities and project delivery. In the U.S. market, that means engineering knowledge, execution management, compliance fluency, and an honest view of what the project should cost and when it can realistically come online. What is a good payback period for a food plant capital project in the United States?It depends on the project type and company strategy. Many private manufacturers seek payback within two to four years for automation or line upgrades. Larger strategic projects, such as greenfield facilities or aseptic expansions, may justify longer paybacks if they create durable margin and capacity benefits. Should food manufacturers use NPV or IRR?Use both, but prioritize NPV when selecting between alternatives. NPV measures actual value creation in dollars. IRR is useful for comparing attractiveness, especially when projects differ in scale. How detailed should CAPEX be in an ROI model?Very detailed. Include process equipment, utilities, controls, freight, installation, building work, commissioning, contingency, and local code or compliance upgrades. Many weak models fail because “soft” or indirect costs are left out. How do I model revenue for a capacity expansion?Start with realistic sell-through assumptions, not nameplate capacity. Build in utilization ramp, customer timing, seasonal effects, freight economics, and margin by product mix. If demand is uncertain, run multiple scenarios. What industries benefit most from food plant ROI modeling?Nearly all food and beverage sectors benefit, including protein processing, dairy, prepared foods, sauces, spirits, brewing, RTD beverages, juices, aseptic products, plant-based foods, co-packing, and shelf-stable operations. Does compliance spending belong in ROI analysis?Yes. Even if a project is primarily risk-reduction driven, the model should quantify avoided downtime, avoided non-compliance costs, improved audit readiness, insurance implications, and customer retention effects where possible. How often should the model be updated?At least at concept stage, budget validation stage, and pre-approval stage. It should also be updated during execution if installed cost, lead time, or startup assumptions change materially. How does 2026 affect food plant ROI modeling?2026 planning is increasingly shaped by automation, labor scarcity, digital controls, energy management, water stewardship, and sustainability-driven policy pressure. Models should include utility resilience, emissions-related upgrades, data visibility, and long-term operational flexibility. Why is integration so important in ROI?Because food plants operate as systems. A new vessel, filler, retort, or mixing line only creates returns if utilities, controls, sanitation, material flow, and staffing all support the expected performance. Integration errors often erase projected returns. When should a manufacturer bring in an external engineering and project partner?Early, ideally before scope is finalized. Early involvement improves feasibility, identifies hidden costs, tests bottlenecks, and creates a more defensible investment case. That is especially valuable for multi-discipline projects involving process, automation, utilities, and installation. In summary, food plant ROI modeling is most valuable when it is grounded in plant reality, commercial logic, and disciplined execution planning. For U.S. manufacturers competing in fast-moving categories and high-stakes production environments, a rigorous financial model is not just a finance document. It is a strategic operating tool that helps companies invest smarter, scale faster, and protect profitability. -
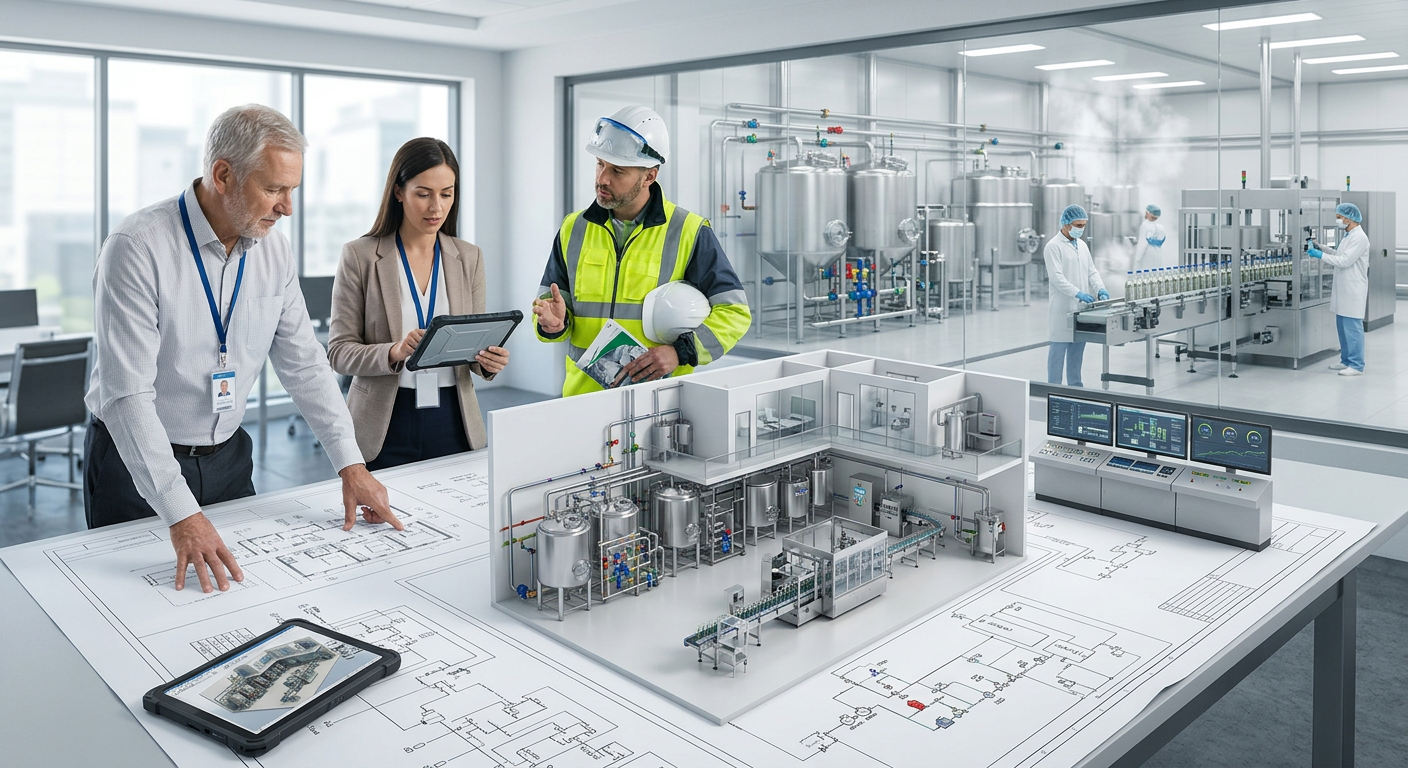
Food Facility Equipment Procurement Best Practices
Procuring food facility equipment in the United States is not just a purchasing task. It is a capital decision that affects throughput, food safety, labor efficiency, utility consumption, compliance exposure, and long-term profitability. The best results come from aligning engineering, operations, quality, maintenance, finance, and procurement before issuing bids. Whether the project involves a new dairy line in Wisconsin, a beverage expansion near Atlanta, a protein upgrade in Kansas, or an aseptic packaging installation in California, buyers that define scope clearly, compare suppliers objectively, and manage installation and startup with discipline consistently outperform buyers that focus only on the lowest initial price. The most effective approach to food facility equipment procurement in the United States is to treat the process as a structured project lifecycle rather than a series of purchase orders. Start with a realistic business case, define process and utility requirements, prepare a detailed specification, run a disciplined request for quotation process, compare suppliers on technical fit and execution capability, negotiate commercial and performance protections, coordinate delivery and installation around plant readiness, and close the project with documented commissioning and handover. This reduces cost overruns, change orders, startup delays, and compliance risk. In practical terms, the procurement team should answer six questions before contacting vendors: What production outcome is required? What product and regulatory standards apply? What utilities and building constraints exist? What labor model will support the line? What is the total installed budget, not just the equipment price? What is the expected return on investment? In food and beverage manufacturing, those questions matter because a mixer, filler, retort, pasteurizer, still, fermenter, or CIP system never operates in isolation. It must fit the process, the building, the sanitation plan, and the commercial model. Across U.S. manufacturing hubs such as Chicago, Charlotte, Houston, Fresno, Minneapolis, and Philadelphia, capital buyers increasingly prioritize procurement methods that integrate process engineering with construction and startup planning. That shift is especially important at facilities near major logistics gateways such as the Port of Los Angeles, Port of Long Beach, Port of Savannah, Port of Houston, and Port of New York and New Jersey, where inbound lead times and freight complexity can materially affect project schedules. The table above shows why the strongest procurement programs connect commercial decisions to execution milestones. Each stage has a different owner, but success depends on a single integrated plan. Procurement planning and budgeting should begin with product demand, not equipment brochures. A facility producing sauces in New Jersey needs a very different design basis than a beverage co-packer in Texas or a poultry processor in Arkansas. The project team should forecast volumes, define SKU mix, identify sanitation requirements, evaluate labor availability, and estimate utilities such as steam, glycol, chilled water, compressed air, process water, wastewater, and power capacity. For U.S. buyers, budgeting errors often come from leaving out indirect costs. The quoted purchase price may represent only 35 to 60 percent of the total installed cost, depending on the system. Foundations, mezzanines, rigging, freight, tariffs, controls integration, validation, startup support, spare parts, operator training, and local permitting can materially increase the final investment. This is especially true for high-complexity systems such as UHT skids, aseptic fillers, retorts, distillation systems, full CIP networks, and automated batching lines. Another best practice is to classify the project by investment purpose: replacement, capacity expansion, quality upgrade, compliance correction, energy reduction, or product innovation. That classification helps executives compare projects more accurately. A replacement project may protect uptime, while an automation project may lower labor costs and improve batch consistency. Both can be worthwhile, but they should not be evaluated with the same assumptions. The explanation behind this budgeting structure is simple: capital decisions fail most often because teams underestimate everything around the equipment. In the U.S. market, a disciplined budget is a scope document with numbers attached, not a rough quote multiplied by a guess factor. Market conditions also matter. Stainless steel pricing, controls lead times, labor shortages, and regional contractor availability can shift budgets materially. For example, projects in high-demand manufacturing corridors around Raleigh-Durham, Dallas-Fort Worth, and Southern California may face tighter scheduling pressure than projects in smaller secondary markets. Buyers should also plan for 2026 trends including stronger energy reporting expectations, rising demand for water reuse, more cybersecurity scrutiny for industrial controls, and wider adoption of modular skid fabrication to reduce field labor. The line chart illustrates a realistic upward trend in U.S. food equipment capital spending, reflecting expansion in automation, sanitation upgrades, and resilience investments. Vendor selection and evaluation should be based on evidence, not brand familiarity alone. A well-known OEM may still be the wrong fit if its design assumptions, support model, or spare parts availability do not match your plant. Likewise, a smaller supplier can be the better choice if it demonstrates stronger process knowledge, cleaner documentation, faster decision-making, and a better startup team. In food and beverage plants, vendor evaluation should cover at least six categories: technical compliance, sanitary design, execution capability, service support, financial/commercial strength, and cultural fit. Technical compliance includes throughput, product viscosity range, heating or cooling profile, cleanability, automation compatibility, and changeover performance. Sanitary design includes weld quality, drainability, dead-leg control, seal selection, allergen management, and compliance with FDA, USDA, SQF, or BRC expectations where relevant. Execution capability often separates successful projects from disappointing ones. A supplier may build excellent hardware but lack field coordination, FAT discipline, or documentation quality. In the United States, buyers should request U.S.-based references, ask about technician coverage by region, and confirm how the vendor supports plants in different time zones. Support expectations for a facility in North Carolina are not identical to those for a site in Washington state or Alberta. This evaluation framework works because it converts supplier selection from subjective preference into a transparent decision model. It also helps procurement defend recommendations internally when competing vendors are close on price. Local supplier strategy is another important factor. For standard utility items, fabricated piping supports, simple tanks, and field services, U.S. regional suppliers may offer faster response and lower freight. For specialized aseptic systems, tunnel pasteurizers, advanced fillers, or custom retort systems, national or international suppliers may still be necessary. The right approach is usually hybrid: source specialized process technology from proven OEMs and pair it with local execution resources where appropriate. The bar chart shows relative equipment demand by sector, with beverage and protein continuing to drive strong capital activity in the U.S. market. The request for quotation process is where procurement quality is either created or lost. If the RFQ package is vague, every supplier will make different assumptions, and the buyer will receive prices that cannot be compared fairly. A strong RFQ creates an apples-to-apples comparison by defining scope, performance requirements, interfaces, standards, schedule expectations, commercial terms, and documentation needs. A proper RFQ package for food facility equipment should include process descriptions, product characteristics, target throughput, utility data, site drawings, required materials of construction, automation standards, sanitary requirements, FAT expectations, delivery windows, installation responsibilities, startup obligations, warranty requirements, and training expectations. If the project involves U.S. regulatory exposure, the package should also note any requirements tied to FDA, USDA inspection environments, allergen zoning, or customer audit standards. Buyers should issue a bid tab template with the RFQ. That forces vendors to disclose inclusions and exclusions consistently. Without this step, one quotation may include valves, instrumentation, and startup support while another excludes them, making the lower price misleading. A clarification log is equally important. All bidders should receive the same answers so the process remains fair and auditable. The explanation for this table is straightforward: every missing RFQ element becomes a future clarification, a future change order, or a future schedule risk. Good RFQs reduce all three. For imported equipment arriving through ports such as Long Beach, Houston, Savannah, or Newark, the RFQ should define Incoterms, customs responsibilities, site delivery conditions, storage requirements, and crane or rigging assumptions. Plants in urban areas such as Boston or Seattle should also address access limitations, staging areas, and restricted delivery hours. These details have real cost consequences. Contract negotiation strategies should protect performance and execution, not only purchase price. Many buyers focus heavily on headline discounts while overlooking delivery guarantees, installation support, software access, spare parts availability, and acceptance criteria. In food equipment projects, those overlooked terms often matter more than a small reduction in unit price. The first negotiation principle is to align payment milestones with evidence of progress. A typical structure might include deposit, approved drawings, fabrication completion, factory acceptance test, shipment, mechanical completion support, and final acceptance. Buyers should avoid front-loaded terms that transfer too much cash before performance is proven. The second principle is to define acceptance clearly. Factory acceptance testing should confirm core functions before shipment. Site acceptance testing should confirm integrated performance under real plant conditions. If acceptance language is vague, disputes become more likely. The contract should also define punch list closure, response times for defects, and software or controls obligations. The third principle is to negotiate support, not just hardware. That includes operator training, maintenance training, spare parts recommendations, remote diagnostics, emergency service response, and post-startup optimization days. For plants with demanding production schedules, like beverage facilities in the Southeast or protein plants in the Midwest, those support commitments can protect revenue far more than a modest upfront discount. The value of this approach is that it converts negotiation into risk allocation. The best contract is not the one with the fewest words; it is the one that makes project responsibilities unmistakable. By 2026, contract language in the U.S. is also likely to evolve around sustainability reporting, equipment energy performance, refrigerant management, cybersecurity for connected controls, and data access for predictive maintenance. Buyers planning multi-site portfolios should begin incorporating these requirements now. Delivery and installation coordination is where procurement becomes reality. Many projects that look successful on paper lose value during field execution because equipment arrives before the site is ready, the utilities are incomplete, the controls contractor is not aligned, or the rigging plan is inadequate. This phase requires strong project management, especially in active plants that cannot stop production for long. Best practice is to build a site readiness checklist before the first shipment leaves the vendor. That checklist should confirm foundations, drains, overhead clearances, utility stubs, floor conditions, sanitation zoning, electrical disconnects, access routes, permits, and safety plans. It should also define who owns unloading, storage, preservation, and damage inspection. For coastal or humid environments such as Florida, the Gulf Coast, or Pacific Northwest sites, preservation planning is especially important for stainless systems, motors, and controls panels. Installation coordination should also consider sequence. In many food projects, utility backbone work, drains, structural steel, and controls rough-in must happen before process skids can be set. If the sequence is wrong, crews interfere with each other and productivity drops. This is one reason many owners prefer an integrated partner that can connect engineering, construction oversight, and process installation. An additional U.S. consideration is local trade availability. Mechanical and electrical labor conditions differ widely between Phoenix, Milwaukee, Nashville, and the Inland Empire. Lead project teams should align contractor strategy with local market realities instead of assuming labor is interchangeable nationwide. The area chart reflects a growing shift toward modular and preassembled systems, a trend driven by schedule compression, field labor constraints, and quality control needs. Commissioning and handover should begin long before startup week. The most successful projects define commissioning strategy during procurement so vendors know what tests, documents, and training outputs will be required. In food facilities, this process typically includes mechanical completion checks, loop checks, dry testing, wet testing, CIP verification, performance trials, alarm testing, safety verification, operator training, maintenance training, and final document turnover. For regulated or highly audited environments, handover should include calibration records, material certificates where required, as-built drawings, IO lists, software backups, recommended spare parts, preventive maintenance tasks, SOP support, and equipment manuals. Plants that skip structured handover often struggle months later when troubleshooting or preparing for audits. Commissioning should verify more than whether the machine turns on. It should test whether the integrated system produces the product at the expected rate and quality. For example, a mixing system may meet speed criteria but still fail yield or viscosity consistency targets. A filler may run but underperform on changeover time. A retort may heat correctly but create packaging issues under real loads. The handover process should capture these realities before final acceptance. Case studies across U.S. manufacturing show that startup outcomes improve when the owner appoints a single accountable leader to coordinate OEMs, utilities, controls, operators, and sanitation. That structure keeps decision-making fast during the most dynamic phase of the project. Total cost of ownership analysis is one of the most important and least used best practices in equipment procurement. Two systems with similar purchase prices can produce dramatically different long-term costs. The more complete analysis includes not only acquisition cost but also utilities, labor, cleaning chemistry, water use, maintenance parts, service support, downtime exposure, yield loss, training needs, and expected useful life. In many food and beverage applications, the higher-priced option can be more profitable if it reduces cleaning time, improves first-pass yield, lowers changeover losses, or simplifies maintenance. This is particularly true in high-volume categories such as ready-to-drink beverages, dairy processing, protein forming, and sauce batching where small percentage improvements compound into major annual savings. The explanation here is critical: total cost of ownership analysis reframes procurement from “What does it cost to buy?” to “What does it cost to own and operate?” That perspective is essential for executives managing plant profitability. The comparison chart shows how a supplier with a slightly lower technical score may still be the better procurement choice if service coverage, documentation, and startup support are materially stronger. When evaluating applications by product type, buyers should adapt TCO models accordingly. Fermentation systems should emphasize temperature control stability and cleanability. Distillation systems should emphasize safety, throughput, and utility efficiency. Dairy systems should emphasize product recovery and hygienic design. Protein lines should emphasize uptime, washdown durability, and labor efficiency. Aseptic systems should emphasize sterility assurance, validation, and specialized support. For manufacturers seeking a partner rather than a transactional seller, Disruptive Process Solutions supports food and beverage capital projects across the United States and Canada with a business-first mindset. The company is built around helping clients make smarter capital decisions, execute cleanly, and protect long-term profitability rather than simply pushing scope. From a technological capabilities perspective, DPS works across structural, mechanical, plumbing, electrical, process, and controls engineering, including PLC programming, automation, and SCADA integration. That matters because equipment procurement decisions must fit real process conditions, utility systems, and control architectures. Whether a project involves fermentation, blending, carbonation, pasteurization, retort, aseptic processing, water treatment, or advanced batching, DPS helps connect process design to execution so equipment selections work in practice, not only in quotations. From a manufacturing capabilities perspective, DPS also provides proprietary equipment for selected applications, including tanks, CIP systems, marination tumblers, and cooking vessels. That manufacturing perspective helps the team evaluate fabrication quality, sanitary design details, and field integration requirements more rigorously. Buyers looking at custom systems can review relevant process equipment capabilities while still keeping the focus on fit-for-purpose design. From a service capabilities perspective, DPS delivers process engineering and design, capital planning, feasibility studies, owner’s representative support, project and program management, general contracting functions where applicable, installation oversight, and system integration. The company’s Design Build Manage model is especially useful for clients that want one accountable team connecting procurement, field execution, and startup. Organizations evaluating project delivery options can explore available engineering and project services or review selected project examples and outcomes for context. That integrated structure is particularly valuable in U.S. projects where schedule pressure, contractor coordination, and utility integration drive major risk. Instead of treating procurement as separate from design and commissioning, DPS helps align the commercial decision with the full lifecycle of the plant asset. What is the biggest mistake in food equipment procurement?The most common mistake is buying based on the lowest quoted price without fully defining scope, utilities, controls integration, startup support, and total cost of ownership. How many suppliers should be invited to quote?For most projects, three to five qualified suppliers is enough. Fewer may limit competition; more can create unnecessary administrative work without improving decisions. Should buyers prefer local U.S. suppliers?Not always. Local suppliers may offer faster response and lower freight, but specialized equipment may require national or international OEMs. The best choice depends on technical fit, support model, and lifecycle value. What should be included in a food equipment RFQ?Include process data, product characteristics, throughput targets, utility information, sanitary requirements, controls standards, documentation expectations, FAT and SAT criteria, schedule milestones, and commercial terms. How long does a typical procurement cycle take?For moderate complexity equipment, 8 to 16 weeks is common from specification to order. Larger integrated systems can take several months longer, especially if imported or highly customized. How should commissioning be managed?Use a formal plan with mechanical completion, dry and wet testing, utility verification, operator training, maintenance training, and documented acceptance criteria. Assign one owner-side leader to coordinate the process. What are the key 2026 trends in the United States?Expect more automation, stronger energy and water efficiency expectations, expanded use of modular skid systems, greater cybersecurity attention for controls, and tighter focus on sustainability and lifecycle reporting. Which industries benefit most from structured procurement?Beverage, dairy, protein, sauces, prepared foods, aseptic processing, and co-packing operations all benefit because they depend on uptime, sanitary performance, and rapid startup. When should an owner’s representative or engineering partner be involved?As early as possible, ideally before the RFQ is issued. Early involvement improves scope definition, budget accuracy, vendor comparison, and installation planning. How can a buyer compare product types fairly?Use a weighted matrix that scores technical fit, sanitary design, controls compatibility, lead time, service support, warranty, and total cost of ownership for each equipment type and supplier. In summary, food facility equipment procurement best practices in the United States depend on disciplined planning, clear technical definition, balanced vendor evaluation, strong contracts, coordinated execution, and a lifecycle view of asset value. When these elements are managed together, manufacturers gain more reliable startups, stronger compliance outcomes, and better returns on capital. -
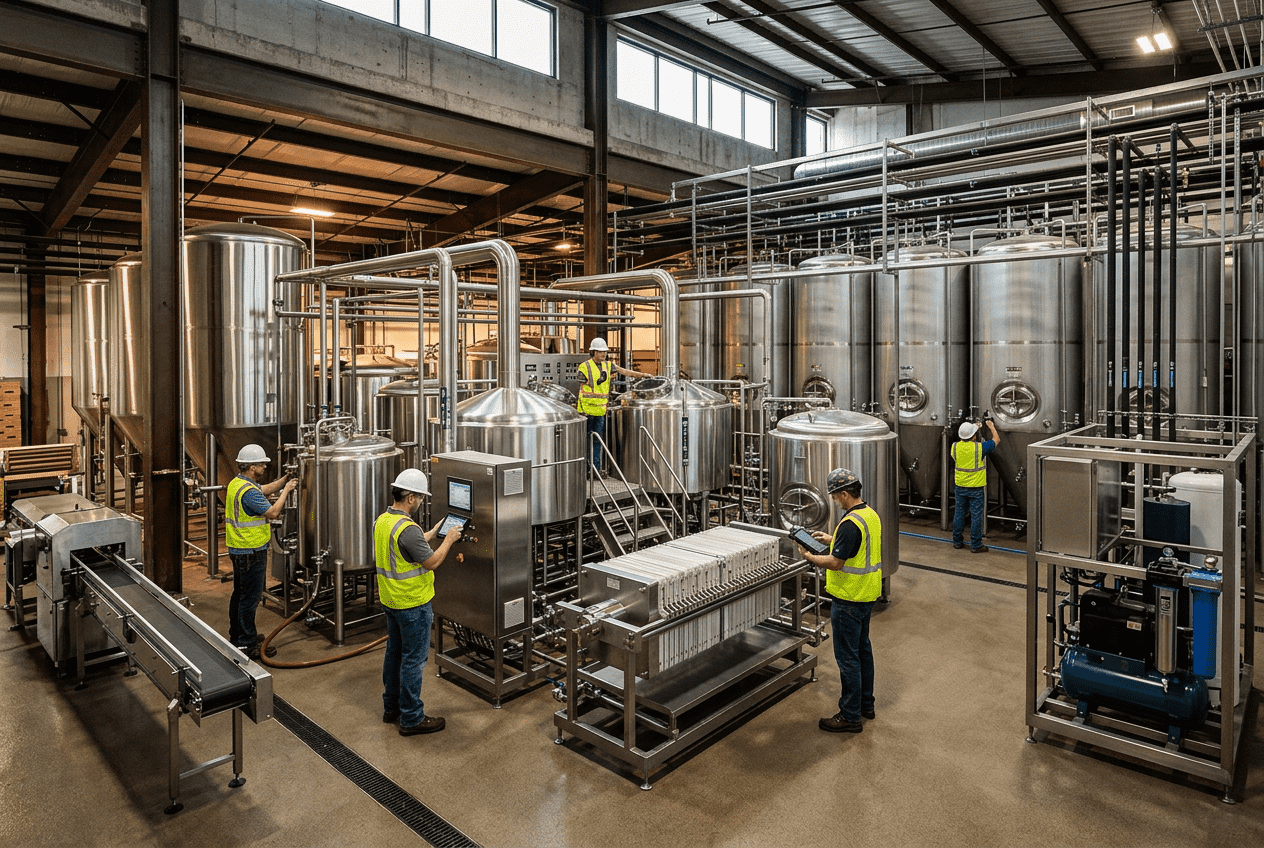
Beverage Manufacturing Capital Planning
Beverage manufacturers in the United States are under constant pressure to grow output, protect margins, improve reliability, and meet tighter sustainability and food safety expectations. Capital planning is where those goals are translated into projects, sequencing, budgets, and measurable business returns. In practice, strong beverage manufacturing capital planning aligns commercial demand with process capability, packaging throughput, utilities, labor, compliance, and resilience. It is not just a budgeting exercise. It is a disciplined method for deciding when to replace aging filling lines, when to expand syrup rooms, whether to add refrigeration capacity, how to stage wastewater upgrades, and which projects should move first. Across major beverage hubs such as Chicago, Dallas, Atlanta, Los Angeles, Charlotte, and the New Jersey corridor near the Port of Newark, producers are reevaluating CapEx through a wider lens. They are no longer looking only at direct output gains. They are also asking how a project affects changeover time, sanitation performance, energy intensity, operator safety, utility constraints, warehouse flow, and future product mix. This is especially important in segments such as craft brewing, spirits, RTD cocktails, juice, dairy beverages, aseptic products, carbonated soft drinks, and functional beverages, where demand patterns can change quickly. For manufacturers that need a practical partner, Disruptive Process Solutions approaches capital projects with a business-first mindset. Rather than forcing unnecessary spend, the company is known for identifying the true bottleneck, validating feasibility, and delivering projects through an integrated design-build-manage model. That approach is highly relevant in the United States market, where regional utility costs, local permitting, labor availability, and logistics access can materially alter the economics of a beverage expansion. Beverage manufacturing capital planning is the structured process of selecting, prioritizing, funding, and executing investments in production assets, process systems, packaging lines, utilities, automation, buildings, and compliance improvements. In the United States, it typically includes five core decisions: what the plant needs now, what demand will require later, which assets create the highest business value, what infrastructure must support those assets, and how projects should be phased to protect cash flow and operational continuity. A strong capital plan for a beverage facility should answer the following questions directly: When done well, beverage CapEx planning reduces reactive spending, avoids stranded capacity, and increases the odds that each project contributes to first-year profitability rather than creating hidden overhead. Beverage manufacturing capital planning is the long-range management of fixed-asset investment across process equipment, packaging machinery, utilities, plant infrastructure, controls, quality systems, and site improvements. In a beverage operation, these investments may include blending systems, bright tanks, unitanks, pasteurizers, fillers, cappers, conveyors, labelers, palletizers, CIP systems, boilers, cooling towers, ammonia or glycol systems, RO water systems, compressed air packages, wastewater treatment upgrades, and automation platforms. The reason this discipline matters is that beverage plants are tightly interconnected. A new filler does not create value if depalletizing, syrup batching, tunnel pasteurization, case packing, chilled water, or air supply cannot support it. Likewise, adding fermentation tanks in a brewery does not guarantee sellable output if filtration, packaging windows, or cold storage become the next constraint. Capital planning therefore looks at the entire operating system rather than individual machines in isolation. In the United States, capital planning also has to reflect local realities. A carbonated soft drink plant near Houston may have different steam economics and labor access than a co-packer in Southern California. A brewery in the Pacific Northwest may face different wastewater discharge requirements than a dairy beverage producer in the Midwest. Sites near logistics corridors such as I-85 in the Carolinas, the Inland Empire in California, or distribution nodes around Memphis and Columbus often make different packaging and warehouse investments than plants serving primarily local distribution. For many producers, the process starts with feasibility and data collection. This is where a multidisciplinary engineering partner adds value. Through its services, DPS supports owners with capital planning, feasibility studies, owner’s representation, project management, general contracting coordination, system integration, and execution oversight. That structure is useful because beverage projects usually require alignment between process engineering, mechanical and plumbing design, electrical distribution, controls, structural support, sanitation, and commissioning. The table above shows why capital planning is broader than maintenance replacement. It connects demand, risk, compliance, and flexibility into one investment framework. Most beverage facilities should rank projects in a disciplined order instead of approving them on urgency alone. In many cases, the best sequence is to stabilize reliability first, remove the largest capacity bottleneck second, upgrade enabling utilities third, and then invest in strategic flexibility and cost optimization. This order is not universal, but it often prevents a plant from buying visible production assets before addressing hidden infrastructure limitations. Priority setting should vary by product type: DPS brings useful depth here because its team works across both beverage and food environments and supports processing systems ranging from fermentation and carbonation to pasteurization, sterilization, water treatment, and automation. On the technology side, that means the ability to connect process, utilities, controls, and plant systems rather than treating them as separate scopes. On the manufacturing side, DPS also designs and supplies selected proprietary process equipment, including tanks and CIP systems, which can simplify integration when speed and fit matter. This prioritization table is especially helpful for portfolio reviews because it separates projects that must happen from those that should happen if capital remains available. The line chart reflects a realistic pattern for U.S. beverage manufacturing CapEx: steady expansion driven by automation, utility modernization, packaging flexibility, and sustainability-related projects. Lifecycle planning is one of the most overlooked parts of beverage capital planning. Many plants continue operating aging assets until failure, especially if the equipment still “runs.” The problem is that technical life and economic life are not the same. A filler may still operate, but if parts are difficult to source, controls are obsolete, changeovers are slow, sanitation time is high, and micro-stoppages are constant, the asset may already be destroying margin. Lifecycle planning should cover core production systems and enabling infrastructure together. In beverage plants, that usually includes: The right replacement decision often depends on four variables: downtime risk, cost to maintain, impact on performance, and compatibility with future product needs. For example, an outdated refrigeration system may not only be expensive to maintain; it may also limit tank turns and packaging schedules during peak summer demand. Likewise, an older filler may be acceptable for a narrow SKU set but become a severe constraint once slim cans, variety packs, or higher sanitation standards are introduced. The key message from the table is that lifecycle planning is not just about age. It is about the operational cost of continuing to defer action. The bar chart shows where demand for capital projects is currently strongest: RTD, aseptic, and spirits-linked growth continue to drive utility, blending, and packaging investment. One of the hardest choices in beverage capital planning is deciding whether to build for near-term demand or future scale. A phased investment model reduces initial cash outlay and may fit uncertain demand curves. A full-scale model can lower total installed cost, avoid disruption from repeat construction, and position the plant for major customer wins. The correct answer depends on market certainty, customer contracts, utility lead times, floor space, and the cost of being late. In the United States, phased investments are common in co-packing, brewing, and emerging beverage categories where SKU volatility is high. Full-scale investment is more common when a site has anchor customers, clear regional distribution plans, or strategic access to major freight lanes and ports such as Savannah, Long Beach, Houston, or Newark. DPS has direct experience supporting facilities designed to scale significantly over time, which is exactly where planning discipline matters. Instead of only sizing visible production equipment, the smarter approach is often to prepare the backbone infrastructure early: pad locations, utility corridors, electrical capacity, control architecture, and wastewater allowance. That prevents the second phase from becoming far more expensive than expected. This table is useful when presenting options to leadership because it makes the tradeoffs visible beyond simple sticker price. Utilities are where many beverage projects succeed or fail. Process and packaging teams may focus on production assets, but water treatment, steam, compressed air, electrical distribution, cooling, refrigeration, and wastewater are often the real gatekeepers of growth. In carbonated, brewed, dairy, and aseptic operations especially, utility shortfalls can create hidden bottlenecks long before a production line reaches nameplate speed. Water and wastewater deserve special attention in the United States because municipal conditions vary dramatically by region. A plant in Arizona or Southern California may face water cost and scarcity pressures that change the economics of reuse systems. Facilities in the Midwest may have different discharge structures than sites in North Carolina or Georgia. Steam needs also vary by product mix, with hot-fill, pasteurization, sanitation, and thermal processing driving larger boiler and condensate requirements. For utility-heavy projects, manufacturers should assess peak and average demand separately, identify single points of failure, and plan for 2026-era sustainability expectations. These include lower water intensity, heat recovery, energy monitoring, improved insulation, variable frequency drives, refrigeration optimization, and smarter control integration. This table highlights a critical truth: utility CapEx is rarely optional if a site expects reliable expansion. It is often the enabling investment that makes process and packaging projects viable. The area chart illustrates a realistic trend shift: a larger share of beverage capital portfolios is moving toward infrastructure, sustainability, and resilience rather than production machinery alone. A CapEx proposal should be easy for executives to compare across projects. The best business cases combine financial returns with operational logic and execution risk. Too many proposals focus narrowly on equipment cost and expected output without documenting assumptions, utility dependencies, labor effects, startup risk, sanitation implications, or sensitivity to demand. A practical business case template for beverage manufacturing should include: Manufacturers often improve approval quality by using a standard scorecard. That allows a filler replacement in Ohio to be compared fairly with a wastewater upgrade in California or a syrup room expansion in Texas. The table above works well as a template foundation because it forces proposal authors to think beyond purchase price and document the full operating impact. When organizations need support building stronger project cases, an integrated partner can help connect engineering assumptions to financial logic. That is one reason many manufacturers involve specialists early rather than after the budget is approved. From concepting through execution, DPS supports that bridge between technical feasibility and investment justification, while its equipment capabilities and integration knowledge help define realistic scope boundaries. Not every project should be funded only because it has the shortest payback. In beverage manufacturing, several categories deserve a formal non-financial score even when ROI appears modest. The most important are safety, quality protection, business continuity, customer service reliability, ESG performance, and resilience against utility, labor, or supply disruptions. For example, a wastewater pretreatment project may not show the same payback as a packaging-speed upgrade, but it can protect the site’s operating license and community standing. A backup refrigeration loop may not maximize IRR, but it can prevent catastrophic product loss. A controls migration may not add visible capacity, yet it may eliminate serious cyber or obsolescence risk. By 2026, more U.S. beverage producers will be expected to show progress on water intensity, energy performance, emissions visibility, and plant resilience. Major retailers, co-man customers, and private equity sponsors are increasingly asking for data on these issues. As a result, capital planning should explicitly score: On the service side, this is where experienced owner’s representation and project management are valuable. Strong project teams keep non-financial priorities from being cut during value engineering. That discipline is central to how DPS structures project oversight and execution support for food and beverage manufacturers. The comparison chart shows why many U.S. manufacturers prefer an integrated project model for complex beverage investments: it typically improves safety, scalability, and infrastructure coordination even if the equipment itself is not the cheapest line item. Capital planning should not happen once a year and then sit untouched. Beverage markets move too quickly for that. Ingredient costs change, customer demand changes, municipalities revise utility conditions, and equipment lead times shift. Best practice is to manage a living capital portfolio with quarterly or at least semiannual reviews. A dynamic portfolio review should revisit: This approach is especially useful for multi-site beverage companies in the United States. A project in the Southeast may suddenly outrank one in the Midwest if customer concentration shifts or if a utility upgrade creates a much faster path to volume. Portfolio discipline also helps organizations avoid chasing visible projects while ignoring less glamorous infrastructure needs. Continuous improvement becomes stronger when lessons from completed work are fed back into future planning. Manufacturers should track not only whether projects were on time and on budget, but also whether the expected OEE, labor, water, or quality gains actually appeared. Real post-audit data makes future business cases more credible. For companies seeking examples of how disciplined project execution translates to operating value, DPS shares practical experience through selected case studies. These kinds of examples matter because they show how smart capital planning often starts by identifying the real root cause rather than assuming new equipment is the only answer. The portfolio review table shows how capital planning should remain tied to actual plant performance and strategic context, not just annual budget cycles. In the current U.S. environment, local supplier and contractor strategy also matters. Plants in regions such as the Carolinas, Texas, the Midwest, and California often face different installation labor dynamics, code interpretations, and permitting timelines. That is why manufacturers benefit from a partner with broad North American reach but enough agility to coordinate local trades effectively. DPS operates that way, combining national beverage and food engineering experience with project-based execution tailored to site conditions. What is the biggest mistake in beverage manufacturing capital planning?The most common mistake is buying visible production equipment before validating utilities, controls, sanitation, and downstream handling. Many projects underperform because the real bottleneck was elsewhere. How far ahead should a U.S. beverage plant plan capital projects?Most facilities should keep a 3-year actionable plan and a 5-year strategic view. Utility-intensive sites may need even longer horizons because power, wastewater, and boiler-related upgrades can have long lead times. Should replacement projects always compete with growth projects on ROI alone?No. Replacement projects often protect continuity, food safety, and maintenance risk. They should be evaluated with both financial and non-financial criteria. What data should be collected before approving a capacity expansion?At minimum: current OEE, changeover time, true bottleneck analysis, utility loading, labor model, customer demand scenarios, floor-space constraints, and startup outage requirements. When is phased investment better than full-scale investment?Phased investment is often better when demand uncertainty is high, capital is constrained, or product mix is likely to change. Full-scale investment is often better when demand is contract-backed and infrastructure can be built more economically once. How important are wastewater and water systems in beverage CapEx?They are critical. In many beverage facilities, wastewater discharge, process water quality, and peak flow conditions are the hidden constraints that determine whether growth is feasible. What trends will shape beverage capital planning through 2026?Expect stronger focus on automation, SCADA visibility, utility efficiency, water reuse, heat recovery, hygienic design, cybersecurity, equipment modularity, and resiliency against power and supply disruptions. How can a manufacturer improve CapEx proposal quality quickly?Use a standard business case template, require do-nothing and alternative options, include full installed cost and utility effects, and score projects for safety, ESG, resilience, and strategic fit along with ROI. What types of beverage operations benefit most from integrated engineering support?Co-packers, breweries, distilleries, dairy beverage plants, aseptic processors, and fast-growing RTD manufacturers typically benefit the most because their projects involve strong interdependence between process systems, packaging, utilities, and controls. Why do manufacturers choose DPS for beverage capital planning and delivery?Because the company combines technical engineering depth, practical installation and integration knowledge, and a transparent, profitability-focused approach. Rather than pushing unnecessary spend, DPS helps manufacturers identify the right investment, sequence it intelligently, and execute it with accountability. -
Food Plant Equipment Specification Standards 2026
Specifying food processing equipment correctly is one of the most important decisions in any United States plant expansion, retrofit, greenfield build, or line replacement. A strong equipment specification does more than describe a tank, filler, blender, cooker, pasteurizer, conveyor, retort, or clean-in-place skid. It defines sanitary performance, materials of construction, automation logic, utility demands, safety expectations, documentation, acceptance criteria, and long-term maintainability. In a U.S. market shaped by FDA, USDA, SQF, BRCGS, labor pressure, energy costs, and supply-chain volatility through gateways such as Los Angeles, Long Beach, Houston, Savannah, Newark, and Chicago, the difference between a detailed specification and a vague one can mean months of delay and millions in avoidable cost. This guide explains how manufacturers in dairy, protein, beverage, prepared foods, sauces, aseptic products, and co-packing operations can build practical equipment specification standards for 2026. It is written for plant owners, operations leaders, engineering teams, procurement professionals, quality managers, and investors who need capital projects to perform on day one and stay profitable over time. In the United States, food plant equipment specification standards should define nine essentials: process duty, target throughput, hygienic design, material selection, code and regulatory compliance, controls integration, utility requirements, documentation package, and factory/site acceptance criteria. If any one of those is weak, the project often suffers from change orders, sanitation issues, poor OEE, operator frustration, or delayed startup. For 2026, the strongest specifications also account for three newer realities. First, automation and recipe control must be written as part of the equipment scope rather than treated as a late-stage add-on. Second, sustainability targets such as water reuse, heat recovery, compressed air efficiency, and chemical optimization now matter financially, not just reputationally. Third, documentation needs to support multi-site corporate governance because many U.S. food and beverage companies now standardize equipment decisions across facilities in North Carolina, Texas, Wisconsin, California, Georgia, Tennessee, and the Midwest. A practical buying rule is simple: write specifications around process outcomes, sanitation access, utility consumption, operator use, and acceptance testing, not around brochure claims. When plants do that well, they reduce startup risk and improve lifecycle value. The market trend above reflects a broad increase in specification-driven capital planning. More plants are moving away from generic RFQs and toward disciplined specification standards because labor, compliance, and utility costs continue rising faster than many operating budgets. An equipment specification should read like an operating agreement between the owner, the OEM, the integrator, and the startup team. It should define what the machine must do, how it must be built, how it will connect to the rest of the plant, and how success will be measured. This is especially critical in high-throughput hubs such as Dallas-Fort Worth, Atlanta, Memphis, and the Chicago corridor, where downtime and installation windows are tightly compressed. At minimum, the specification should describe product characteristics, expected viscosities or solids load, temperature ranges, cleanability, batch or continuous operation, hourly or daily throughput, utility availability, control architecture, allergen separation needs, operator interaction, and maintenance access. It should also distinguish clearly between “vendor standard” and “owner required.” That single distinction prevents many disputes. For plants seeking a more integrated approach, it helps to align equipment standards with engineering, installation, and startup planning from the beginning. Companies often benefit from working with teams that can connect process design and field execution, such as food and beverage engineering services that cover process, utilities, controls, construction coordination, and commissioning. This table shows the backbone of a strong specification. In practice, each line item should be translated into measurable requirements rather than general language. For example, “easy to clean” should become “fully drainable to low-point outlet with no pooling after CIP final rinse.” Technology capability is now part of core specification practice. Advanced processors increasingly require PLC-based batch control, SCADA visibility, remote diagnostics, recipe management, inline Brix monitoring, thermal profile logging, and utility metering. These are no longer premium extras in many beverage, dairy, protein, or aseptic plants; they are operating necessities. For that reason, the best specifications treat automation, electrical integration, and process controls as core process requirements, not post-award decisions. Sanitary design should be the center of every food equipment specification in the United States. A machine can hit its speed target and still fail commercially if it traps soil, takes too long to clean, or creates recurring environmental monitoring findings. Hygienic design standards are especially important for ready-to-eat proteins, dairy, sauces, cultured beverages, aseptic products, and facilities that run multiple allergens. Good sanitary design starts with accessible geometry. Product contact areas should be inspectable, cleanable, drainable, and free of unnecessary crevices. Welds should be smooth and consistent. Hollow members should be sealed or avoided. Fasteners in splash zones should be minimized. Belting, pump seals, spray devices, instrumentation ports, valve clusters, and transition points all need scrutiny. The explanation here is straightforward: sanitation performance is a design outcome, not a housekeeping outcome. Plants that struggle with chronic sanitation issues often discover the problem was built into the equipment layout or geometry from the start. In the U.S. market, sanitary design requirements also vary by product risk. A low-acid shelf-stable retort line in the Midwest has a different risk profile than a refrigerated dairy beverage line in California’s Central Valley or a cooked protein slicing room in Arkansas. Your specification should therefore state whether the area is raw, ready-to-eat, allergen-controlled, high-moisture, dry processing, or aseptic, because design details change materially by zone. This demand comparison highlights why hygienic design remains such a high-priority specification category. Ready-to-drink beverages and protein processing continue to drive strong investment because both sectors face strict quality expectations and intense pressure to reduce cleaning downtime. Material selection is often oversimplified as a choice between 304 and 316 stainless steel, but U.S. food plants need a more disciplined framework. Product chemistry, chloride exposure, cleaning chemicals, abrasion, temperature cycling, and environmental washdown all affect material life. A vinegar-based sauce line, a dairy CIP skid, a brine marination system, and a high-sugar beverage blending system do not have the same corrosion or wear profile. Proper specifications should identify contact materials, non-contact materials, elastomers, insulation jacketing, coatings if any, valve seat compounds, and instrument wetted parts. They should also define finish requirements and post-fabrication treatment where appropriate. In many projects, buying a slightly more robust material package reduces replacement frequency, sanitation risk, and unplanned downtime. The key point from this table is that material selection should be tied to service conditions, not habit. A lower first cost often becomes the highest lifecycle cost when corrosion, gasket failure, or surface degradation begins affecting production. Manufacturing capability matters here as well. Buyers should evaluate whether the supplier can consistently fabricate tanks, CIP systems, vessels, and skids to the specified finish and quality level. For plants that need custom process vessels, cleaning skids, tumblers, or cooking systems, it is useful to review a supplier’s process equipment capabilities alongside fabrication details, weld standards, testing methods, and installation support. Strong manufacturers do not just build to print; they understand how fabrication decisions affect startup and sanitation in the field. Many projects fail because capacity is specified only as a nameplate number. In reality, food and beverage plants need equipment that performs under actual operating conditions: real product temperatures, changeovers, SKU variation, sanitation windows, operator staffing, utility fluctuations, and upstream or downstream interruptions. A 400-bottles-per-minute filler or 20,000-pound-per-hour cooker may only achieve that speed under narrow conditions. For better results, specifications should define normal throughput, sustained throughput, peak throughput, first-pass yield, CIP duration, heat-up time, cooldown time, product loss at changeover, utility consumption, and expected OEE assumptions. They should also state if the line must scale for future expansion. In fast-growth regions such as Phoenix, Nashville, Charlotte, and Austin, many plants need phase-one systems that can support phase-two capacity without tearing out utilities later. The explanation is simple: capacity without context is misleading. A usable performance standard should reflect the plant’s actual scheduling, labor, utility, and product mix so that procurement decisions support profitability instead of just maximum output claims. By 2026, more U.S. owners are also writing in sustainability metrics as performance criteria. These include water use per gallon produced, heat recovery targets, compressed air leakage tolerance, and chemical concentration control. This is especially important for beverage, dairy, and aseptic plants where water and energy intensity can materially affect EBITDA. The area trend shows how fast buyers are moving toward performance-based specifications. This change is being driven by co-pack growth, private equity oversight, utility cost pressure, and tighter startup deadlines across the United States. Equipment specifications for the United States must align with applicable regulatory and certification requirements from the outset. Depending on the product and facility, this may include FDA food safety requirements, USDA inspection expectations, PMO considerations for dairy, low-acid canned food process needs, OSHA safety concerns, local building and fire code, electrical code, and customer-driven frameworks such as SQF or BRCGS. In practice, compliance is not a single checkbox; it is a layered requirement that influences design, installation, controls, validation, and records. Plants in meat and poultry regions such as Nebraska, Kansas, Iowa, Georgia, and Arkansas often face different documentation and design expectations than beverage plants clustered around California, Texas, or the Carolinas. The specification should therefore state the compliance environment clearly and assign responsibilities for submittals, labeling, verification, and startup records. The reason this table matters is that code and certification expectations often drive hidden scope. If they are not written into the specification, they appear later as costly field changes, delays in commissioning, or failed audits. Service capability becomes critical at this stage. Owners often need project teams that can connect process engineering, code coordination, field installation, startup management, and owner representation. When compliance requirements are complex, a partner with cross-functional execution experience and a documented project record can lower risk. Reviewing a supplier’s project case studies is often more revealing than reading a generic qualifications sheet. No equipment specification is complete without layout integration. Even excellent machines fail if they are forced into poor plant geometry, awkward sanitation zones, or underdeveloped utility corridors. U.S. food plants often expand within tight footprints, especially in legacy facilities near Chicago, Philadelphia, Cincinnati, Milwaukee, and the Northeast corridor, where old buildings constrain access and ceiling height. The specification should include dimensional envelopes, maintenance pull space, operator circulation, pallet and forklift travel, mezzanine loading, floor drainage strategy, utility routing, and sanitation segregation. It should also define process adjacency: where raw ingredients enter, where in-process transfers occur, how personnel move, where waste exits, and how allergen or ready-to-eat areas stay protected. This matters even more in large beverage and co-pack facilities where syrup rooms, boilers, air compressors, cooling towers, process water, wastewater, and filling lines must operate as one coordinated ecosystem. Utility systems should be specified with the same seriousness as the process equipment itself because they often determine whether the process can run at full intended rate. Integration with layout also now includes digital infrastructure. Plants increasingly require network drops, secure PLC communication, historian access, and remote diagnostics strategy as part of equipment placement decisions. In 2026, cybersecurity, panel accessibility, and remote support readiness are becoming standard specification topics rather than IT afterthoughts. This comparison illustrates a common market reality: suppliers that understand plant integration usually outperform commodity-only vendors on startup support, utility coordination, documentation quality, and future scalability. Documentation is where many projects either gain discipline or lose control. A complete equipment specification should require detailed submittals before fabrication, a clear document package before shipment, and objective acceptance tests before final payment. Plants should avoid vague language such as “machine to be tested” and instead define exact FAT and SAT procedures, durations, products, pass/fail thresholds, and punch-list closeout rules. At a minimum, the document package should include P&IDs, general arrangement drawings, utility connections, electrical schematics, panel layouts, I/O lists, bill of materials, spare parts list, recommended PM schedule, weld maps if required, surface finish records if required, software backups, operator manuals, sanitation instructions, and training records. If the line has recipe or batch functionality, version control and change management should also be included. The explanation is that documentation is not paperwork for its own sake. It is the mechanism that turns purchased equipment into a maintainable, auditable operating asset. For most owners, acceptance should include three layers: functional acceptance, sanitation acceptance, and performance acceptance. A line that powers on but cannot meet target throughput, fails cleaning validation, or generates unstable controls alarms should not be considered complete. Buying advice for 2026 is clear: tie progress payments to documentation quality and acceptance milestones. This encourages discipline across procurement, fabrication, shipping, installation, and startup. Disruptive Process Solutions, or DPS, supports food and beverage manufacturers across the United States and Canada with an approach built around design, build, and execution management. Rather than operating as a narrow equipment reseller, the company works across process engineering, installation coordination, utilities, automation, and capital planning to help owners make better project decisions early and execute them efficiently later. You can learn more about the team on the about us page. From a technology standpoint, DPS works across process, mechanical, electrical, plumbing, structural, and controls disciplines. That includes automation, PLC programming, SCADA, batch logic, and integration of systems such as pasteurization, sterilization, retort, aseptic processing, water treatment, mixing, blending, fermentation, distillation, and utility infrastructure. This range is valuable when an equipment specification needs to account not only for the machine itself, but also for how it interacts with boilers, glycol, compressed air, process water, wastewater, or packaging systems. From a manufacturing standpoint, DPS also develops selected process equipment solutions including tanks, CIP systems, tumblers, and cooking vessels. That fabrication perspective helps connect specification language with real-world buildability, finish expectations, and field installation needs. In practical terms, that means specifications can be written with a better understanding of what separates a clean drawing set from a truly usable production asset. From a service standpoint, DPS supports capital planning, process design, owner representation, turnkey installation, project and program management, and commissioning support. That is especially useful for owners who need a partner capable of bridging the gap between strategy and field execution. Whether the project is a beverage facility scaling rapidly in the Southeast, a protein retrofit in the Midwest, or a utility-heavy co-pack build in Texas, the company’s model is built to keep project decisions tied to profitability rather than simply equipment spend. What makes this relevant to equipment specification standards is philosophy. The best standards come from teams willing to challenge weak assumptions, identify real bottlenecks, and define what success looks like before steel is ordered. In many plants, that level of honesty creates better outcomes than simply approving the biggest equipment package. What is the biggest mistake in food equipment specifications?Writing around brochure features instead of operating outcomes. Plants should specify throughput, sanitation, controls, utilities, and acceptance criteria in measurable terms. Should every specification require stainless steel?Not necessarily. Product-contact and washdown areas often do, but utility skids or support systems may allow mixed materials depending on service, environment, and lifecycle cost. How detailed should FAT and SAT requirements be?Very detailed. Define test sequence, runtime, alarms, safety checks, product trial conditions, utility conditions, and pass/fail thresholds before the purchase order is issued. What standards matter most in the United States?That depends on the product and plant, but FDA, USDA where applicable, OSHA, electrical code, customer audit requirements, and sanitary design expectations are typically central. How should plants prepare for 2026 trends?Build specifications that include automation readiness, cybersecurity, water and energy efficiency, modular expansion capability, digital records, and clearer sustainability metrics. Are custom specifications worth the effort for smaller projects?Yes. Even smaller upgrades benefit from a structured specification because it reduces ambiguity, protects schedule, and improves startup performance. How can a plant compare suppliers fairly?Use a scoring model across sanitary design, material quality, controls capability, utility fit, lead time, documentation, service support, and total cost of ownership rather than purchase price alone. What industries benefit most from strict specification standards?Dairy, protein, ready-to-drink beverages, sauces, aseptic foods, retort products, and co-packing operations typically see the greatest return because downtime and compliance risk are expensive. Do plant layout and utilities really belong in the equipment spec?Absolutely. Equipment performance depends on clearances, drainage, steam, water, air, cooling, power, and controls connectivity. Ignoring those items creates expensive field rework. What should an owner do first before issuing an RFQ?Confirm process intent, product range, cleaning method, utilities, future capacity goals, and acceptance criteria. A strong pre-bid package usually saves far more money than it costs to develop. In 2026, food plant equipment specification standards in the United States are becoming more disciplined, more data-driven, and more integrated with operations strategy. The companies that perform best are usually the ones that define sanitary design, material selection, capacity, controls, compliance, documentation, and plant integration before procurement begins. Whether the project is in California, Texas, Wisconsin, North Carolina, Illinois, or anywhere in between, good specifications remain one of the cheapest forms of risk reduction available to a manufacturer. -
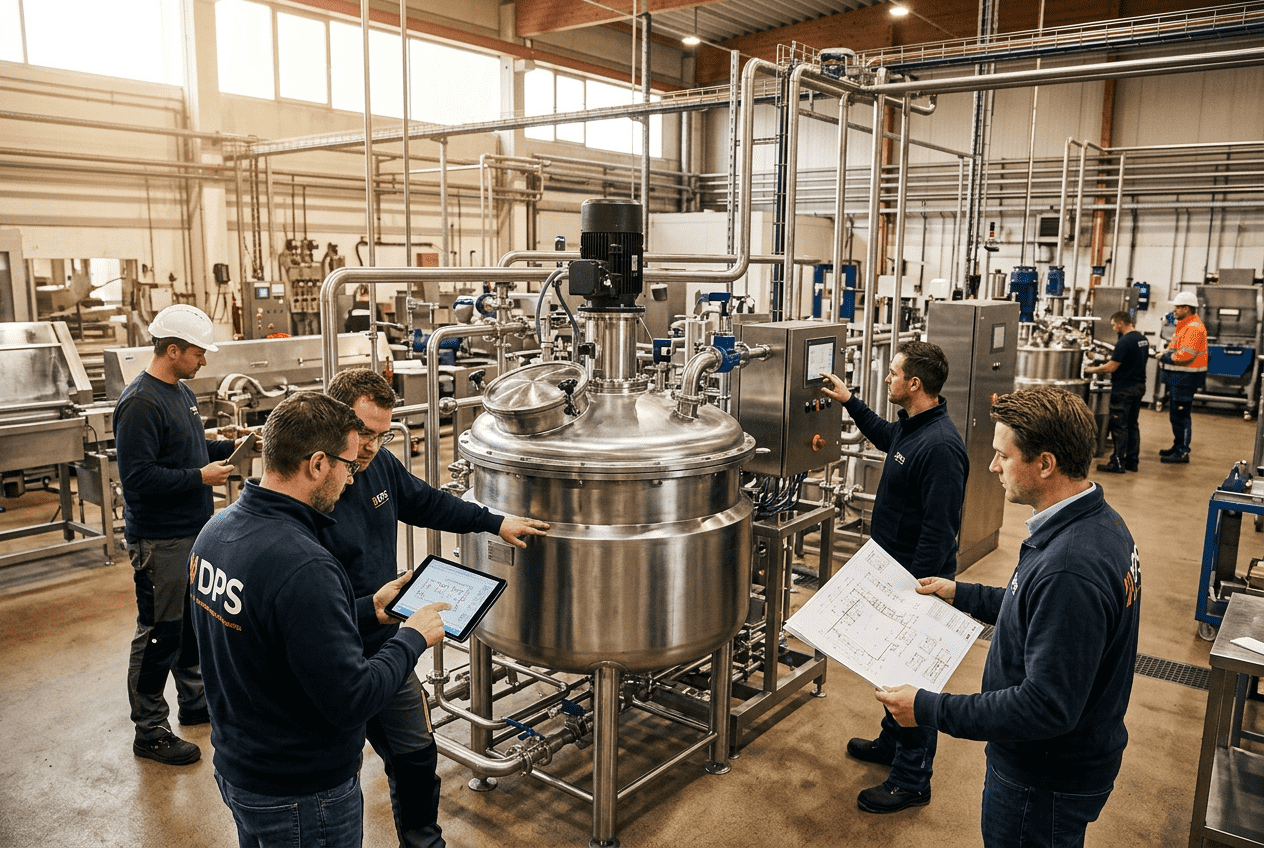
Food Manufacturing Capital Project Planning
Food manufacturing capital project planning is the structured process of turning a business need—more capacity, better food safety, lower utility costs, new product capability, or plant modernization—into an executable project with clear scope, budget, schedule, risk controls, and return targets. In the United States, successful planning usually starts long before equipment is ordered. It includes feasibility analysis, process definition, utility sizing, compliance review, cost modeling, stakeholder alignment, and commissioning strategy. For food and beverage manufacturers, good planning reduces change orders, protects uptime, improves regulatory readiness, and helps leadership invest capital where it produces the strongest operational and financial return. Whether a processor is building a greenfield plant near Dallas, expanding a protein line in Kansas City, modernizing dairy operations in Wisconsin, or upgrading a beverage facility near the Port of Savannah, the same principle applies: smart capital must be tied to smart manufacturing outcomes. That means a project should not simply “fit the budget.” It should support throughput, labor efficiency, food safety, maintenance access, utilities, automation, and future expansion without creating hidden bottlenecks. Food manufacturing capital project planning is the front-end and execution framework used to evaluate, design, fund, and deliver physical improvements in a processing operation. These projects can include new processing lines, plant expansions, utility upgrades, warehouse additions, packaging automation, wastewater systems, aseptic processing suites, retort systems, refrigeration upgrades, CIP skids, and full facility relocations. In the United States market, capital planning is especially important because food manufacturers operate under demanding production economics and strict compliance requirements. Projects often must satisfy FDA expectations, USDA inspection requirements, customer quality programs, SQF or BRC certification needs, local building codes, wastewater discharge limits, and utility provider constraints. A plan that looks strong on paper can fail in practice if it ignores sanitary zoning, process flow, compressed air demand, steam load, chilled water balance, or labor availability. The best capital planning process connects four levels of decision-making: This structure is where an engineering partner can add outsized value. Disruptive Process Solutions approaches planning as a profitability exercise, not just a construction exercise. That distinction matters because many food projects succeed or fail based on decisions made before detailed design begins. A practical capital planning model for food processors in the United States can be organized into five stages. These stages create a disciplined path from concept to startup. Stage 1 begins with the business trigger. Is the company adding SKUs for a national retailer? Is a co-manufacturer trying to support a new aseptic beverage customer? Is a protein processor losing yield because of outdated forming or slicing equipment? Capital planning must translate those pressures into measurable goals such as lines per minute, pounds per hour, OEE improvement, labor reduction, margin lift, or utility cost savings. Stage 2 evaluates alternatives. This is often where companies discover that the original assumption was incomplete. A new packaging line may require electrical service upgrades, compressed air storage, additional floor drains, or revised ingredient handling. A relocation project may need a new syrup room, boiler capacity, wastewater pretreatment, and controls integration. In many cases, the least expensive equipment quote is not the lowest total installed cost. Stage 3 is the transition from possibility to execution logic. Here, planners define sanitary zoning, process adjacency, traffic flow, control architecture, maintenance access, allergen separation, and phasing strategy. This stage often makes or breaks a brownfield project because production continuity must be balanced with construction access. Stage 4 focuses on engineering depth, procurement timing, local permitting, and field execution. In major U.S. manufacturing hubs such as Chicago, Charlotte, Fresno, Houston, and Indianapolis, contractor availability and lead times can materially affect budget and schedule. Long-lead items like boilers, switchgear, fillers, tanks, retorts, chillers, and automation hardware should be tracked early. Stage 5 covers commissioning, operator training, control tuning, punch list closure, and performance verification. For food processors, startup is not complete when the line turns on. It is complete when the line produces safe product at expected throughput with acceptable scrap, labor, and cleaning time. One of the first planning decisions is selecting the right project type. Food manufacturers usually choose between a greenfield build, an expansion of existing space, or a renovation/retrofit of current operations. Each has different economics, risks, and speed profiles. A greenfield project is often the best choice when a manufacturer needs a highly efficient process flow, modern utility infrastructure, higher automation, or large-scale expansion. This is common in fast-growing beverage, dairy, and prepared foods operations near logistics corridors such as Atlanta, Nashville, Phoenix, or the Inland Empire. Greenfield allows better segregation of raw and ready-to-eat zones, cleaner forklift routes, improved wastewater strategy, and future line installation space. An expansion works well when the existing site has strong labor retention, favorable tax position, good utility service, and enough land. Manufacturers near established trade hubs like Columbus, Memphis, or the Port of Houston often prefer this option because they can preserve current operations while adding capacity. Renovation is usually driven by aging infrastructure, sanitation concerns, compliance gaps, or automation needs. It can deliver excellent returns, especially when the core business is strong but the plant was not designed for current SKU complexity. However, renovations carry significant execution risk because hidden field conditions, utility congestion, and production downtime can erode the budget fast. Choosing among these options should be based on total business impact, not just initial capital. If an expansion saves $2 million but limits future throughput or creates an unmanageable sanitation workflow, the “cheaper” option may be more expensive over five years. Cost estimating for food processing projects is often where optimism causes trouble. Realistic capital estimates should include direct process equipment costs, installation, utilities, automation, building modifications, permitting, startup support, contingency, and internal owner costs. In live manufacturing environments, temporary systems, weekend shutdown labor, overtime, and sanitation controls can add meaningful cost. In the United States, cost estimates are heavily influenced by region, local labor rates, contractor competition, freight, utility interconnection requirements, and lead times. A beverage project in Southern California may face different electrical, mechanical, and permitting costs than a similar project in North Carolina or Iowa. A reliable estimate usually improves through stages. A rough order of magnitude estimate may be acceptable for early portfolio screening, but a funding request should be tied to a defined basis of design. That means the company understands the process capacities, utility assumptions, equipment list, site constraints, shutdown windows, and project delivery model. Food processors should also distinguish between capital efficiency and cost cutting. Removing CIP automation, under-sizing refrigeration, or minimizing drainage improvements may reduce initial spend but create long-term operating losses. The right estimate reflects lifecycle value. This is where service capability matters. Firms like DPS support capital planning, feasibility, owner representation, project management, and full execution, which helps align the estimate with how the project will actually be built and operated. The result is usually better budget confidence and fewer surprises in the field. Capital projects fail when departments agree too late. Engineering may prioritize technical robustness, operations may focus on uptime and labor, while finance may pressure for lower capital intensity and faster payback. Effective planning aligns these groups early around common assumptions. Engineering needs to define what the process requires: vessel sizing, thermal process design, controls architecture, utility demand, sanitary design, and maintainability. Operations needs to validate shift patterns, cleaning windows, staffing, changeover time, warehouse flow, and operator capability. Finance needs clear cost categories, cash flow timing, ROI logic, and risk-adjusted alternatives. Cross-functional planning should also include procurement, quality, maintenance, safety, IT/OT, and in some cases commercial teams. For example, a new beverage line may be justified based on customer demand, but if packaging material lead times, recipe control, and utility reliability are not aligned, the project may miss launch dates. Strong capital teams use decision gates. At each gate, leaders confirm scope, budget confidence, major risks, and go/no-go criteria. This keeps enthusiasm from outrunning evidence. Technological capability is especially relevant here. A food and beverage engineering partner should understand structural, mechanical, plumbing, electrical, process, and controls integration—not just one discipline in isolation. DPS is positioned in this space with capabilities spanning PLC programming, automation, SCADA, process engineering, utility systems, and full project engineering, which is valuable when the project depends on system-level coordination instead of standalone equipment procurement. Manufacturing capability matters too. Planning is stronger when the project team understands fermentation systems, pasteurization, aseptic processing, carbonation, blending, retort, dairy systems, protein handling, marination, cooking, slicing, and CIP from an operating perspective. That experience reduces the gap between drawings and real plant behavior. Risk management in food manufacturing capital projects is not just about safety and construction claims. It includes food safety, utility resilience, startup performance, labor readiness, regulatory timing, and commercial exposure. A delayed launch for a retailer program or co-packing contract can have larger consequences than the direct construction overrun. The most common risk categories include scope risk, schedule risk, cost escalation, utility insufficiency, process integration failure, sanitary design gaps, vendor delays, contractor coordination issues, and staffing readiness. Brownfield work adds hidden field conditions, shutdown dependency, and contamination control risks. Good planning creates a live risk register with assigned owners, probability and impact ratings, mitigation actions, and trigger dates. For example, if switchgear lead time is 40 weeks, electrical procurement becomes a critical path risk. If the project requires USDA inspection layout approval, that review must be built into the schedule early. If the facility is in a water-stressed or wastewater-sensitive region, discharge capacity must be verified before detailed design. Service capability is again important here. An end-to-end model that covers design, build, and management can reduce handoff risk. DPS uses a design-build-manage approach that combines engineering, contractor oversight, installation coordination, and execution control. For owners, this can improve accountability across the project lifecycle, especially when multiple trades and process vendors must be synchronized. Food manufacturing project schedules vary widely, but many U.S. processors underestimate the time required for front-end planning, permitting, procurement, installation sequencing, and startup stabilization. A realistic timeline depends on project type, site conditions, utility upgrades, OEM lead times, and whether production continues during construction. A small line addition might move from concept to startup in 6 to 10 months. A major expansion often takes 12 to 18 months. A greenfield facility can easily require 18 to 30 months depending on complexity, site development, and equipment lead times. Ports, freight corridors, and labor markets also influence timing. Projects tied to import equipment through Long Beach, Savannah, Houston, or Newark should consider transport and customs timing. Facilities in high-growth regions may face tighter contractor availability and longer permit cycles. Commissioning should be treated as a business milestone, not a final construction activity. SATs, utility verification, CIP validation, alarm testing, recipe checks, and production trials must all be planned in detail. If the project includes proprietary equipment, custom controls, or unusual process integration, the startup plan should include extra buffer. For manufacturers seeking outside support, it helps to work with partners who can manage the full sequence from engineering through installation and turnover. DPS also manufactures selected process equipment, including tanks, CIP systems, marination tumblers, and cooking vessels. That manufacturing capability can simplify coordination on projects where custom equipment fit, lead time, and integration are critical. More detail on available systems can be found through its process equipment offerings. Many companies approve projects using careful financial models, then fail to measure whether the promised value was delivered. Post-project review is essential because it turns a one-time project into organizational learning. ROI review should compare approved assumptions against actual outcomes in at least six areas: throughput, yield, labor, downtime, utility cost, and quality performance. It should also measure whether the project improved strategic position—such as winning a new customer, enabling a new package format, or reducing compliance exposure. A good review usually occurs in stages: at mechanical completion, after initial startup, after 60 to 90 days of operation, and again after a full business cycle. The last review is especially important for seasonal products or plants with fluctuating SKU mix. Case examples often show that the best returns come from identifying the real constraint, not the most visible one. Sometimes a processor thinks it needs building expansion, but the actual issue is controls logic, packaging balance, utility instability, or sanitation downtime. This is one reason owners value firms that challenge assumptions. DPS has built its reputation around that style of engagement, including project work where detailed analysis uncovered a lower-cost path to meaningful capacity gain before larger capital was committed. Additional examples of project thinking and execution can be explored in its project case studies. Looking ahead to 2026, post-project ROI analysis will increasingly include sustainability and digital metrics. More U.S. food and beverage companies are evaluating energy intensity, water reuse, emissions impact, traceability readiness, cyber-resilience of controls, and data quality for predictive maintenance. Policy pressure, retailer expectations, and utility pricing will keep these factors in the capital planning conversation. Future-ready projects are likely to prioritize modular utility systems, smarter SCADA layers, recipe and batch visibility, energy management dashboards, heat recovery, improved wastewater strategies, and layout flexibility for shifting product mix. In sectors such as RTD beverages, dairy alternatives, prepared proteins, and aseptic foods, the plants that win will usually be those designed for both efficiency and adaptation. What is the first step in a food manufacturing capital project?The first step is defining the business problem clearly. That may be capacity growth, compliance improvement, labor reduction, margin protection, or a new product launch. Without a defined objective, the project can become an equipment shopping exercise instead of a strategic investment. How long does capital project planning take?Early planning can take a few weeks for a small line project or several months for a major expansion or greenfield plant. The more complex the process, utility, and compliance requirements, the more important front-end planning becomes. What is the difference between a ROM estimate and a final budget?A ROM estimate is a rough early-stage budget based on limited definition. A final funding budget should be built on a clearer basis of design, known site constraints, utility assumptions, schedule logic, and vendor or contractor input. When should food manufacturers choose renovation instead of expansion?Renovation is often the right choice when the existing building has strong strategic value and the main issues are sanitation, compliance, aging utilities, or outdated process flow. Expansion is better when the site can support additional footprint and future growth without major operational conflicts. Why do food projects go over budget?Common causes include incomplete scope, underestimated utilities, poor existing-condition data, uncontrolled changes, late vendor decisions, weak shutdown planning, and insufficient contingency for brownfield conditions. How important is automation in capital planning?Very important. Controls, PLC logic, SCADA, recipe management, and integration often determine whether a project delivers the expected throughput, consistency, and labor savings. Automation should be planned as part of the process, not added at the end. What should be included in a commissioning plan?A commissioning plan should include mechanical completion checks, utility verification, controls testing, CIP confirmation, alarm testing, operator training, production trial criteria, documentation, and performance acceptance standards. How do I evaluate an engineering and project delivery partner?Look for food-industry process knowledge, multidisciplinary engineering depth, utility and controls expertise, field execution capability, regulatory familiarity, transparent estimating, and a track record of solving root problems rather than simply selling scope. What U.S. market trends will shape food capital planning in 2026?Expect stronger focus on automation, energy efficiency, water stewardship, resilient domestic supply chains, cybersecurity for industrial controls, modular expansion strategies, and projects that can flex across multiple SKUs and channels. Why does location matter in U.S. project planning?Location affects labor cost, access to trades, freight, utility availability, wastewater capacity, tax incentives, permitting speed, and logistics. A project near Charlotte, Chicago, Los Angeles, Houston, or Savannah may have very different constraints and opportunities than one in a rural processing corridor.


