-
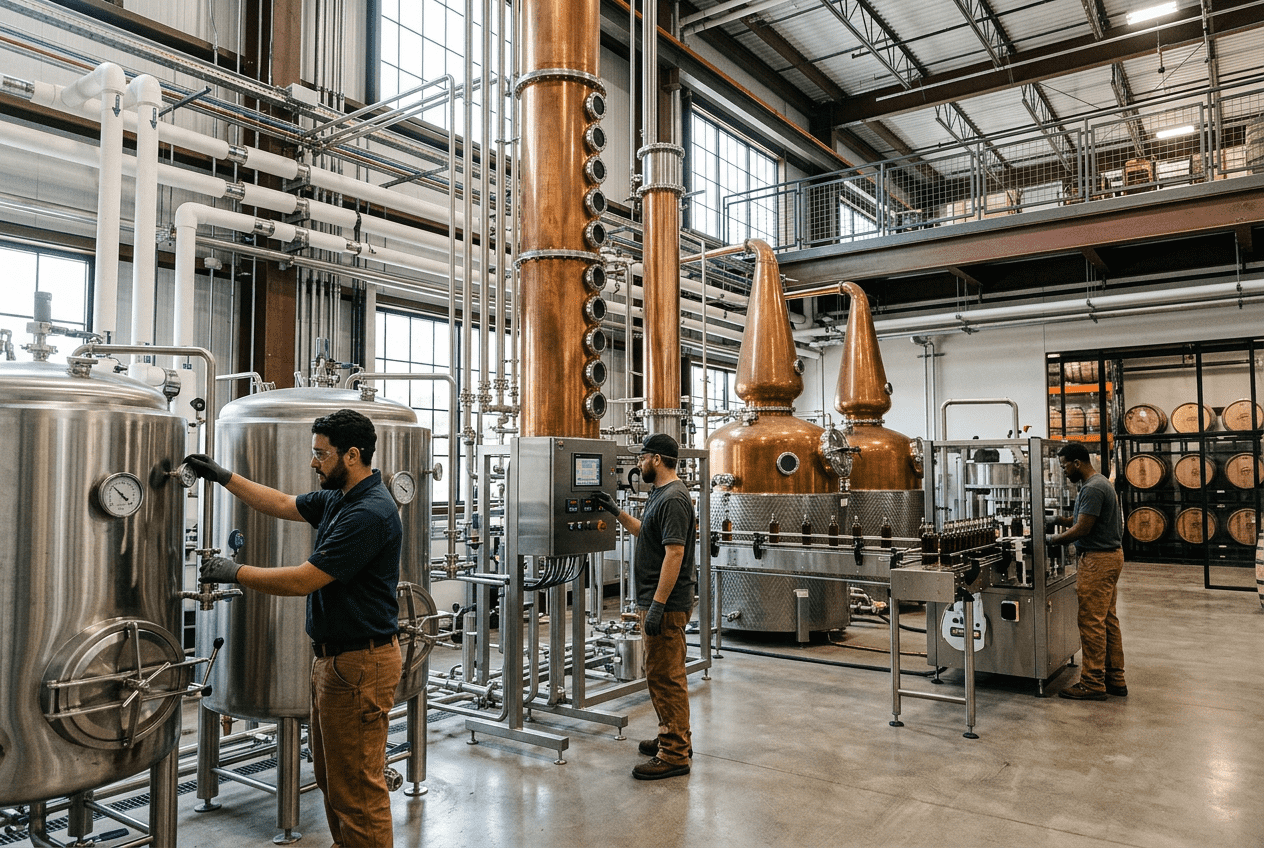
2026 Cybersecurity Guide for Food Manufacturing: Protecting OT & IT Systems
Food and beverage manufacturers in the United States now operate in a threat environment where ransomware, remote access abuse, third-party compromise, and insecure legacy control systems can disrupt production as quickly as a mechanical failure. A modern plant no longer depends only on boilers, fillers, mixers, pasteurizers, refrigeration systems, packaging lines, and warehouse automation. It also depends on programmable logic controllers, SCADA platforms, historians, recipe systems, enterprise resource planning software, cloud backups, vendor connections, and plant-wide networks that tie operational technology and information technology together. For processors in hubs such as Chicago, Fresno, Dallas, Charlotte, Atlanta, Los Angeles, Houston, Kansas City, and the port-driven corridors around Savannah, Long Beach, Newark, and New Orleans, cybersecurity is now part of uptime, food safety, and business continuity. A compromised batching system can halt throughput. A locked quality database can delay release. A vendor remote session can become the path to a ransomware event. A failure to segment networks can let a business-side phishing incident spread into production controls. In 2026, the best food manufacturing cybersecurity programs are built around risk reduction, recoverability, regulatory alignment, and disciplined engineering execution. This guide explains how U.S. food plants can isolate IT and OT environments, implement the NIST Cybersecurity Framework, strengthen access controls, prepare for incidents, manage vendor risk, and translate security strategy into technical plant requirements. It also addresses buying advice, product and facility types, common use cases, project sequencing, local supply-chain considerations, and what manufacturers should expect from a capable engineering and integration partner. The fastest and most effective way for a food plant in the United States to improve cybersecurity is to separate IT and OT networks, control every remote connection, require multi-factor authentication for privileged access, define role-based permissions for operators and engineers, back up critical systems offline, and build an incident response plan that includes production recovery. For most facilities, the right first step is a plant-specific cybersecurity assessment that maps assets, identifies critical processes, documents current risks, and prioritizes corrective actions by operational impact. For food and beverage plants, cybersecurity is not just about protecting data. It protects recipes, batch integrity, sanitation cycles, thermal processing controls, refrigeration uptime, traceability systems, packaging schedules, and shipment continuity. A well-designed program reduces the chance of unplanned downtime, supports FDA and customer audit readiness, strengthens supplier trust, and preserves profitability when margin pressure is already high. In practical terms, a strong plant cybersecurity baseline usually includes: The market is moving in this direction because food plants have become high-value targets. Attackers know that a processor shipping fresh protein, aseptic beverages, frozen prepared foods, or dairy products often has little tolerance for downtime. That urgency can increase ransom pressure. Plants tied to distribution centers, cold chain systems, co-packing schedules, and retailer fill-rate commitments are especially vulnerable. This table shows why food manufacturing cybersecurity must be tied to plant function. Every area has different assets, different downtime costs, and different control priorities. The spending trend above reflects what many manufacturers are seeing in practice: cybersecurity is being funded as a plant reliability and resilience issue rather than as a standalone IT expense. Network segmentation is the foundation of cybersecurity in food manufacturing. In many older plants, business networks, plant-floor HMIs, remote vendor pathways, camera systems, wireless access points, and quality systems grew organically over time. That is common in retrofitted facilities in industrial corridors from the Midwest to the Carolinas, but it creates unnecessary risk. When a user clicks a malicious email on the corporate side, flat or poorly controlled networks can allow attackers to move into OT environments. The objective is not to disconnect the plant from the business. The objective is to control how information moves between systems. Recipe management, production reporting, maintenance analytics, ERP integration, warehouse execution, and remote support can still function well in a segmented architecture. They simply need defined paths, approved protocols, logging, and inspection points. A practical segmentation model for U.S. food plants often includes: For plants handling protein, dairy, aseptic products, retort foods, brewing, distillation, and high-volume RTD lines, segmentation becomes even more important because uptime windows are tight and process deviation can trigger both product loss and regulatory concerns. A blocked packaging line is expensive; a compromised thermal process record can be worse. Segmentation should also reflect physical operations. For example, a site near the Port of Savannah that moves refrigerated exports may need stronger segregation between warehouse systems and utility controls. A California beverage co-packer near Long Beach may prioritize segmented remote support for fillers, depalletizers, and pasteurizers installed by different OEMs. A Midwest dairy processor may isolate homogenization, HTST, CIP, and cold storage utility controls because disruption can affect both food safety and shelf life. This architecture table matters because it turns a general concept into plant-level engineering requirements. Segmentation should be documented in network diagrams, firewall rule sets, IP plans, and access procedures. The trend shift is clear: by 2026, more food plants are moving away from convenience-based connectivity toward engineered segmentation that supports reliability and cyber resilience. The NIST Cybersecurity Framework is one of the most practical structures for food manufacturers because it gives leadership, plant operations, engineering, IT, and quality teams a shared language. It is flexible enough for a single-site processor and structured enough for multi-state operations with facilities in Texas, California, North Carolina, Wisconsin, Pennsylvania, or Ontario-linked cross-border supply networks. The framework is especially useful in food plants because it aligns cyber work with business outcomes. Instead of asking abstract security questions, teams can ask which systems support critical production, which failures would stop shipping, which assets affect food safety records, and how fast the plant can recover. The framework’s functions can be applied directly: For food plants, the Identify function should include line-level operational mapping. That means documenting dependencies such as what happens if the batching server is unavailable, whether pasteurization records are local or centralized, which utility skids can run manually, and which OEM support accounts are active. The Protect function should account for legacy devices, maintenance windows, and the fact that not every control can be patched like an office PC. This mapping helps food processors convert NIST from a policy concept into a measurable plant program. The most successful implementations tie each control to uptime, compliance, and product flow. In 2026, future-ready NIST implementation will also include three trends: more cloud-connected plant analytics, more scrutiny of supply-chain resilience, and more integration of sustainability systems such as energy monitoring, water treatment automation, and emissions reporting. As plants digitize utilities and ESG reporting, cyber exposure expands. Those systems should be brought into the same governance model rather than treated as separate projects. Identity is now one of the most common points of failure in industrial environments. Weak passwords, shared accounts, dormant vendor credentials, and broad administrator rights create unnecessary exposure. In food manufacturing, access should reflect job function, plant location, and system criticality. Operators should not have engineering privileges. Temporary contractors should not have persistent VPN rights. Vendors should not be able to access the plant at any time without approval. Multi-factor authentication is essential for VPNs, cloud dashboards, plant historians accessed remotely, maintenance platforms, and any account with elevated rights. Even when some legacy OT systems cannot support direct MFA, plants can still enforce MFA on the access pathway, such as a jump server or secure remote access platform. Role-based access control should be structured around real plant roles: Plants with multiple product categories, such as beverage blending, dairy processing, protein marination, retort, and packaging, often need even more granular access rules. For example, a vendor that services tunnel pasteurizers should not automatically gain access to batching servers. A refrigeration contractor should not reach packaging HMIs. These distinctions matter. The explanation is straightforward: identity discipline prevents both accidental misuse and intentional abuse. In food plants, that is vital because a single overprivileged account can affect production records, process parameters, and recovery timelines. Many manufacturers focus heavily on prevention and too little on response. Yet food plants need response plans that recognize an uncomfortable reality: some incidents will happen. The difference between a manageable disruption and a severe business event is often the quality of preparation. An effective incident response plan for a food plant should answer six questions quickly. Who declares the incident? Who decides whether production continues or stops? How are quality and food safety impacts assessed? Which systems are restored first? How are vendors engaged? What is the communication path to leadership, customers, insurers, and legal counsel if needed? For OT-heavy sites, the plan must connect cyber actions to operational steps. If a SCADA server is encrypted, can operators run manually? If a historian is down, what paper or local records are acceptable temporarily? If a recipe server is unavailable, which products can still run safely? If remote support is suspended, which local resources are on site? Employee awareness training also needs to be practical. Office-focused phishing modules alone are not enough for a plant workforce. Training should cover removable media, badge sharing, unattended terminals, suspicious vendor requests, password habits, personal device use in restricted areas, and escalation paths when operators see unusual HMI behavior or network issues. It should also be available for multilingual plant teams where appropriate. This process table shows that incident response in food manufacturing is both a cyber exercise and an operational continuity exercise. Plants should test their plans at least annually through tabletop drills and, where practical, controlled recovery tests. By 2026, employee awareness is also being shaped by AI-enabled phishing, deepfake voice requests, and more convincing supplier impersonation. Training must evolve accordingly, especially for procurement, scheduling, accounts payable, plant management, and maintenance coordinators. Demand is particularly high in highly automated sectors and in operations where downtime has immediate product or cold-chain consequences. Food plants depend on equipment OEMs, integrators, utilities contractors, software providers, packaging automation vendors, sanitation service firms, and temporary labor platforms. This means vendor risk is not theoretical. It is embedded in daily operations. A secure plant can still be exposed by an insecure supplier laptop, a reused password, a poorly protected remote support tunnel, or a software update process with weak controls. Vendor security requirements should be formalized in contracts, onboarding checklists, and access procedures. This is especially important when plants work with multiple regional and national suppliers across filling lines, refrigeration, CIP systems, SCADA updates, laboratory software, and warehouse systems. Facilities tied to major logistics corridors such as Memphis, Columbus, Dallas-Fort Worth, and the I-95 corridor often have larger contractor footprints and need tighter governance. Strong vendor controls usually include: Supply chain protection also extends beyond digital access. Plants should evaluate whether key equipment spares, replacement controllers, secure network hardware, and software licenses are available within acceptable lead times. A cyber event becomes more damaging if recovery is delayed by scarce industrial components. The explanation here is simple: supplier access must be earned, controlled, documented, and regularly revalidated. That is how plants reduce the chance that convenience becomes a long-term weakness. Cybersecurity becomes real when it appears in engineering specifications, FAT and SAT protocols, panel designs, network standards, remote access architectures, and change-control workflows. Many food manufacturers struggle because security goals are discussed in policy documents but not written into project scope. The result is expensive retrofits. For new builds, line expansions, utility upgrades, equipment relocations, and brownfield modernization, technical specifications should define cyber requirements from the beginning. This applies whether the project involves a new fermentation cellar, a distillation skid, a dairy processing suite, a retort room, a protein marination line, a batching and blending system, or a complete beverage co-packing plant. Core engineering requirements often include managed industrial switches, VLAN design, firewall segmentation, secure remote access appliances, centralized authentication where feasible, server hardening, account management, backup strategies, configuration baselines, and documented recovery images. Specifications should also address cabinet labeling, IP scheme standards, approved protocols, logging retention, and environmental resilience for network equipment on the plant floor. Technological capability matters here. The right project partner should understand controls engineering, PLC programming, automation, SCADA integration, utility infrastructure, and production process dependencies rather than treating cybersecurity as an isolated software issue. In food and beverage environments, cyber design must work with process realities such as CIP sequencing, batch control, refrigeration redundancy, pasteurization verification, and sanitation access windows. Manufacturing capability matters as well. Plants need solutions that fit brewing, spirits, wine, RTD beverage, dairy, protein, prepared foods, aseptic processing, and co-packing operations. A good specification is different for a cold-fill juice room than for a retort canning line or a high-care dairy packaging area. Critical systems, uptime demands, and compliance expectations differ. Service capability matters because implementation crosses engineering, installation, integration, and commissioning. Cyber controls should be validated during startup, not deferred indefinitely. A partner that can design, build, and manage projects with coordinated field execution usually reduces gaps between intent and installed reality. Manufacturers looking for support can review engineering and project services for food and beverage facilities to understand how integrated delivery improves control over scope, schedule, and system performance. This table is useful because it gives plant owners and EPC teams a way to translate strategy into bid packages, user requirements, and acceptance testing criteria. For manufacturers evaluating equipment and solution providers, it is also smart to ask whether cyber-ready design is built into tanks, CIP skids, process vessels, controls packages, and plant automation systems. Companies that offer integrated process and control solutions, including food and beverage equipment systems, can often reduce the mismatch between process design and digital control architecture. The comparison shows why layered controls matter. Segmentation improves resilience significantly, and identity governance adds another major step forward. Food manufacturers should not try to fix everything at once. The best roadmap is phased, risk-based, and aligned with maintenance windows, capital plans, OEM dependencies, and production calendars. Plants with seasonal peaks, holiday demand, harvest cycles, or large retail commitments need special attention to timing. A practical implementation roadmap usually works in five stages. First, assess and inventory. Second, design the target architecture and policies. Third, implement high-value controls such as segmentation, MFA, backup improvements, and remote access governance. Fourth, validate through testing, drills, and user training. Fifth, sustain through audits, change management, and periodic review. Best practices include involving operations early, using plant shutdowns wisely, documenting every approved connection, avoiding unmanaged quick fixes, and integrating cybersecurity with broader modernization projects. For example, if a processor is already upgrading utilities, installing new SCADA, relocating a line, or expanding a co-pack facility, it is often far more efficient to include cyber architecture in that project than to retrofit it later. This is where case experience matters. A capable engineering partner can identify whether the real bottleneck is hardware, controls logic, network design, or operating procedure. In some projects, better programming and system architecture can unlock capacity and reduce risk without unnecessary capital. Manufacturers interested in real project outcomes can explore selected process and facility case studies for examples of execution thinking grounded in profitability and operational performance. This roadmap works because it balances urgency with operational reality. It also supports buying decisions by helping leadership distinguish between must-have controls and nice-to-have enhancements. Looking ahead to 2026 and beyond, leading projects will incorporate secure-by-design automation, stronger software bill of materials expectations from vendors, more formal resilience planning for utility systems, and better integration between cyber recovery and sustainability infrastructure. As plants digitize energy, water, and emissions systems, those assets will need the same discipline as core process controls. Disruptive Process Solutions supports food and beverage manufacturers across the United States and Canada with an engineering-led approach that aligns capital execution, operational performance, and plant practicality. Rather than treating cybersecurity-related plant needs as an isolated IT exercise, the company approaches projects through the realities of process manufacturing, utility infrastructure, automation, and profitability. On the technological side, DPS brings experience across structural, mechanical, plumbing, electrical, process, and controls engineering, including PLC programming, automation, and SCADA integration. That matters when cybersecurity must fit live production systems, utility dependencies, and line-level controls rather than generic office technology. Whether the project involves batching controls, aseptic systems, thermal processing, refrigeration, or plant-wide utility integration, the team can evaluate how cyber requirements affect design, commissioning, and long-term support. On the manufacturing side, DPS works across both food and beverage applications, including brewing, spirits, wine, RTD beverages, carbonated and non-carbonated drinks, dairy, protein processing, prepared foods, sauces, aseptic operations, and co-packing environments. That process familiarity is important because cyber priorities differ by operation. A retort line, a yogurt plant, a distillation operation, and a high-speed beverage packaging facility do not share the same risk profile or recovery priorities. On the service side, DPS uses its design-build-manage model to support capital planning, feasibility, owners representation, project management, general contracting functions, equipment supply, installation, and integration. For manufacturers seeking a partner that understands plant execution from concept through startup, this model helps connect engineering intent to field implementation. You can learn more about the company and its operating approach and how it supports profitable, well-planned manufacturing projects. That combination of engineering, manufacturing familiarity, and execution discipline is particularly relevant when plants are adding new process systems, relocating assets, modernizing controls, or building expansion capacity and want cybersecurity requirements embedded correctly from the start. What is the first cybersecurity step a U.S. food plant should take?Start with an asset inventory and risk assessment that maps critical production systems, remote access paths, backup status, and current segmentation gaps. Without that baseline, priorities are often guessed instead of managed. Why is IT/OT segmentation so important in food manufacturing?Because it reduces the chance that a business-side compromise spreads into production controls. It also improves visibility, makes vendor access easier to govern, and limits the operational impact of an incident. Is the NIST Cybersecurity Framework appropriate for small and mid-sized processors?Yes. It is scalable. A smaller plant may implement a simpler version, but the Identify, Protect, Detect, Respond, and Recover functions still provide a useful operating model. Should every remote vendor connection require MFA?Yes. If direct MFA on the end device is not feasible, enforce MFA on the access method, such as the VPN, remote access gateway, or jump host. How often should backups be tested?Critical OT and production-support backups should be tested on a defined schedule, often quarterly for key recovery scenarios and after major changes. A backup that has never been restored is not a validated recovery control. Do legacy PLCs make cybersecurity impossible?No. Legacy systems are common in U.S. plants. They usually require compensating controls such as segmentation, firewall rules, restricted engineering access, offline backups, and stronger remote access governance. How does cybersecurity connect to food safety?It protects the availability and integrity of records, process parameters, sanitation controls, thermal treatment verification, refrigeration systems, and traceability workflows that support safe product release. What should be written into vendor contracts?Remote access rules, MFA, named accounts, approved devices, incident notification timelines, patch disclosure expectations, access expiration, and logging requirements are all strong starting points. Are ransomware events the main concern?They are a major concern, but not the only one. Plants should also plan for unauthorized logic changes, account compromise, vendor pathway abuse, data integrity issues, and utility system disruption. How long does a typical implementation take?Initial high-value improvements can begin within weeks, but a full plant maturity program often unfolds over several months depending on downtime windows, equipment diversity, and capital planning. What are the biggest 2026 trends for food plant cybersecurity?More secure remote access, tighter supplier governance, better OT backup validation, stronger NIST-based governance, AI-aware employee training, and greater protection for digital sustainability and utility systems. -
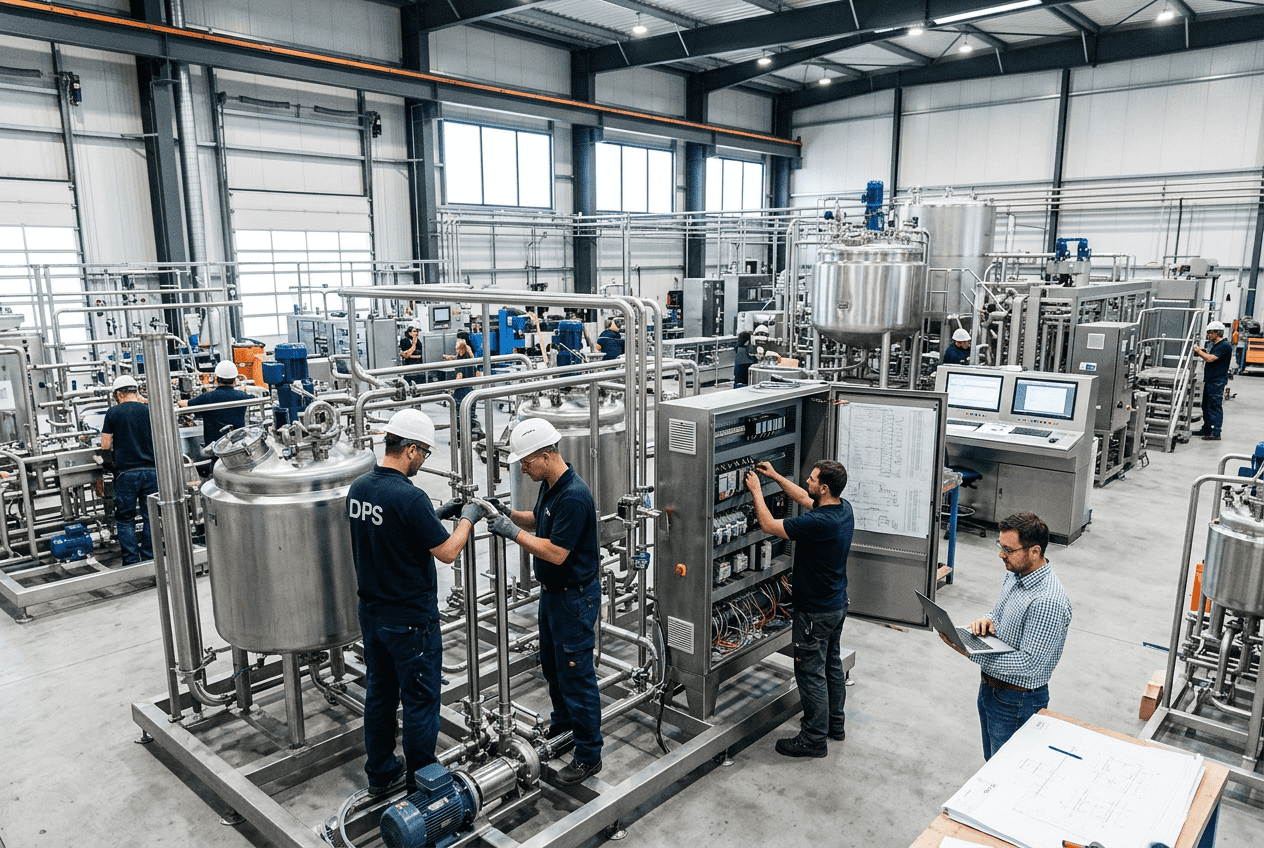
Non-Carbonated Beverage Processing
Non-carbonated beverage processing in the United States centers on one goal: delivering safe, stable, great-tasting drinks at the required shelf life and production cost. For juices, teas, enhanced waters, dairy alternatives, and functional beverages, the right approach usually comes down to product chemistry, target distribution, package format, and throughput. In practical terms, most U.S. manufacturers choose among hot fill, cold fill with preservatives or chilled distribution, and aseptic processing. They also balance pasteurization method, pH control, package selection, and filler technology to protect both product quality and plant profitability. Across U.S. beverage hubs such as Chicago, Dallas, Los Angeles, Atlanta, the New Jersey corridor, and the Carolinas, producers are reworking still drink lines to handle shorter runs, cleaner labels, and more demanding retailers. Import gateways like the Ports of Los Angeles and Long Beach, Savannah, Houston, and New York/New Jersey also influence equipment lead times, packaging sourcing, and co-packing strategy. For manufacturers planning new lines or retrofits, the best projects start with process design rather than equipment shopping. That is especially true when the portfolio includes multiple SKUs, varying acidity, pulp, botanicals, sweetener systems, or sensitive functional ingredients. For still beverages in the U.S. market, hot fill is commonly used for acidic products such as many teas and juices, cold fill works where refrigerated distribution or preservatives are acceptable, and aseptic is the premium route for shelf-stable, preservative-free products that need long distribution windows. The optimal system depends on pH, water activity, solids, viscosity, package type, desired shelf life, and retail channel. Gravity fillers fit low-viscosity drinks, piston fillers fit thicker or particulate products, and flowmeter fillers fit high-speed, high-accuracy operations. Strong line design also requires validated thermal processing, sanitary tanks and piping, effective CIP, package compatibility, and microbiological risk control. For buyers, the fastest way to reduce project risk is to align process authority, engineering, utilities, automation, and packaging decisions early. This is where an integrated partner matters. Disruptive Process Solutions approaches beverage projects with an engineering-first model designed to improve long-term profitability, not just install equipment. In the United States, that matters because labor, utilities, freight, and compliance costs vary widely by region, from California to Texas to North Carolina. The table above shows why still beverage processing should be treated as a full system decision. Choosing a filler before confirming product chemistry, sanitation philosophy, and package behavior often causes rework later. Hot fill remains one of the most common methods for acidic still beverages in the United States. Product is heated to a validated temperature, filled hot into compatible containers, and held long enough to sanitize the package interior and closure zone. This method is widely used for teas, juice drinks, and some functional beverages where the flavor profile can tolerate the heat impact. It is attractive because it can avoid preservatives and does not require a fully aseptic filling environment. The tradeoff is package limitation, thermal stress, and potential flavor darkening over time. Cold fill is simpler from a filling standpoint but depends heavily on microbiological strategy. In many cases, it is paired with chilled distribution, preservatives, tight hygienic design, or filtration. It can work well for fresh-positioned products sold regionally around markets like Charlotte, Miami, Phoenix, or Seattle, where rapid replenishment supports shorter shelf life models. Cold fill can preserve delicate aromas better than hot fill, but if the hurdle strategy is weak, spoilage risk rises quickly. Aseptic processing is the most robust shelf-stable route for many modern still drinks, especially premium, low-additive, and functional products. The product is sterilized separately from the package, and both are brought together in a sterile filling zone. This approach supports long ambient shelf life with excellent flavor retention versus prolonged heat exposure. It is common in carton packs, some PET applications, and specialized bottles. Capital cost, operational discipline, validation, and operator training are all higher. From a market standpoint, U.S. producers are increasingly interested in aseptic and advanced hot fill because retailers want longer shelf life and consumers want cleaner labels. National distribution through grocery, club, convenience, e-commerce, and foodservice all reward process consistency. For manufacturers planning a new facility, process selection should also account for labor availability, state utility rates, sanitation staffing, and the local warehouse network. A line that looks inexpensive on paper may become costly if it requires high manual intervention in a tight labor market. Juice, tea, and functional beverage line design starts with the product matrix. Juice systems often need blending accuracy, deaeration, pulp handling, and Brix control. Tea lines may need extraction, filtration, aroma protection, and color management. Functional beverages frequently require high-shear mixing, powder induction, hydration time, ingredient protection, and separation control. Some formulas also introduce vitamins, botanicals, proteins, emulsions, sweetener blends, or fiber systems that change viscosity and thermal sensitivity. A well-designed line typically includes water treatment, ingredient receiving, batching, thermal processing, surge capacity, filling, secondary packaging, and CIP. Utilities are just as important: steam, glycol, compressed air, chilled water, drains, wastewater handling, and controls integration often determine whether the plant can hit output targets. In fast-growing beverage corridors from Dallas-Fort Worth to inland Southern California to the Research Triangle, many expansion projects fail not because the filler is undersized, but because utility and changeover design were not solved early. On the technological side, DPS supports projects with process, mechanical, electrical, controls, and automation expertise. That means recipe control, SCADA visibility, in-line Brix monitoring, water treatment, sanitation design, and integration of thermal systems are developed as one coordinated production environment instead of disconnected pieces. For U.S. beverage operators, this is important when the same site may run tea in one shift, juice in another, and a functional line extension on weekends. Buying advice for U.S. processors: if your commercial plan includes club packs, foodservice jugs, and retail singles, design the backbone for the broadest sanitation and utility needs first, then optimize around container sizes. That usually protects capital better than chasing the cheapest individual machine quote. Pasteurization for still beverages is not one-size-fits-all. HTST and flash pasteurization are common for acidic beverages where the goal is to reduce spoilage organisms while limiting sensory damage. UHT goes further, using higher temperatures and shorter times to create a commercially sterile product suitable for aseptic filling. Tunnel pasteurization is less common for many still beverages than for packaged products in specific formats, but it can have niche applications. The right thermal process depends on the organism risk, acidity, package, storage temperature, and the product’s tolerance for heat. Juice drinks often perform well under carefully tuned HTST. Tea may require close attention to color pickup and aroma retention. Functional drinks with vitamins or botanical notes may benefit from UHT plus aseptic filling, especially when distributed nationally from hubs near Memphis, Indianapolis, or central Pennsylvania where warehousing feeds broad U.S. coverage. DPS also brings manufacturing capability into this part of the decision. The company designs and supplies process equipment such as tanks and CIP systems and integrates complete thermal and utility infrastructure. That matters because pasteurization performance is only as reliable as the surrounding surge control, valve matrix, temperature instrumentation, and sanitation execution. The key point is that thermal processing should be validated against actual product formulation, not a generic category assumption. A lightly acidified botanical drink can behave very differently from a standard juice blend. Filler choice affects speed, accuracy, foaming, sanitation complexity, and SKU flexibility. Gravity fillers are simple and effective for free-flowing, low-viscosity still drinks. They are common where foaming is manageable and the product does not contain heavy particulates. Piston fillers excel with thicker beverages, products with particulates, or applications where volumetric consistency across variable textures matters. Flowmeter fillers use mass or magnetic flow measurement and are favored in modern high-speed beverage plants because they offer strong accuracy, recipe flexibility, and reduced product giveaway. For a U.S. plant supplying both regional grocery and national chains, fill accuracy can have major margin impact. A 1% giveaway on a high-volume line can erase substantial annual profit. At the same time, an overengineered filler can be unnecessary for a narrow SKU mix. Matching the filler to the commercial model is essential. Service capability is critical here. DPS supports end-to-end project planning, installation, integration, and execution management so that fillers are not dropped into lines without upstream and downstream alignment. That includes owner-side advocacy, project management, and full-system coordination with conveyors, closure systems, clean utilities, controls, and commissioning. When comparing suppliers, U.S. buyers should also ask about spare parts lead times, local service coverage, recipe memory, CIP integration, closure torque verification, and integration with existing PLC standards. pH is one of the most important control points in still beverage processing. In broad terms, beverages below pH 4.6 are easier to stabilize microbiologically than low-acid drinks, but that does not mean they are automatically safe or stable. Acid-tolerant yeasts, molds, and certain spoilage organisms still create major issues. Acidification strategy must account for the acid type, buffering capacity, flavor impact, regulatory labeling, and ongoing process verification. Citric acid, malic acid, phosphoric acid, and blended acidulant systems are commonly used depending on flavor profile and brand positioning. Functional beverages with botanicals or minerals may show pH drift, precipitation, or flavor imbalance over time. In those cases, bench work and shelf life studies are essential before commercial launch. Best practice in U.S. plants is to combine formulation control with calibrated inline or at-line measurement, batch records, and operator verification. For high-risk products, this should link to automated recipe management and hold-and-release logic. Producers serving major retailers from distribution centers in Columbus, Kansas City, or Allentown cannot rely on manual memory when thousands of cases may ship across the country within days. The explanation behind this table is simple: pH is not just a lab number. It is a production variable tied to taste, sanitation, thermal process assumptions, and legal defensibility. Clean label demand continues to reshape the U.S. still beverage category. Many brands want to remove potassium sorbate, sodium benzoate, and similar preservatives while keeping ambient distribution. The main preservative-free pathways are hot fill, aseptic processing, refrigeration, validated thermal processing with tight hygienic design, or in selected chilled cases, HPP. Each route changes capex, logistics, and package selection. Preservative-free is not a single technology claim; it is a full operating discipline. Plants need strong hygienic zoning, sanitary piping, validated CIP, disciplined ingredient handling, and microbial environmental monitoring. A brand can remove preservatives from the label, but if the plant design is weak, the total business risk often increases. Here the U.S. market has shifted from simple shelf-stable tea toward more complex functional drinks with lower sugar, botanical inclusions, and protein or fiber systems. Those formulas may be less forgiving. A preservative-free strategy therefore works best when engineering, QA, and commercialization teams are aligned from the start. For manufacturers evaluating clean-label line upgrades, it often makes sense to review process engineering and integration services before buying hardware. In many cases, profitability improves more from better line architecture, controls, and sanitation planning than from a single high-profile machine purchase. Package selection affects process compatibility, shelf life, freight cost, sustainability claims, and consumer perception. PET dominates many U.S. still beverage categories due to cost, weight, and line speed. Heat-set PET is often used for hot fill, while standard PET may work in cold fill or aseptic applications depending on system design. Glass supports premium positioning and strong barrier performance but increases freight and breakage concerns. Cartons are popular for aseptic nutrition and shelf-stable products, especially where brand owners want strong sustainability messaging. Pouches are expanding in kids, value, and convenience channels but require careful product-package matching. Regional logistics matter. West Coast distribution through Los Angeles or Oakland may favor lighter packages to control freight, while Northeast urban delivery can raise warehouse and handling costs that also make lightweight options attractive. E-commerce introduces another layer because damage resistance and dimensional weight both affect profitability. If packaging is a major bottleneck, U.S. processors should also review domestic equipment and vessel support from partners with fabrication capability. A look at custom processing equipment options is useful when standard tank, CIP, or surge solutions do not fit the available floor plan or run strategy. Extending shelf life without refrigeration requires multiple hurdles working together. Thermal treatment, acidification, package barrier, oxygen control, hygienic design, closure integrity, and warehouse conditions all contribute. For some beverages, deaeration and low dissolved oxygen can substantially improve flavor stability. For others, light protection and oxygen scavenging closures are more important. Shelf life is never just one number from the lab; it is a total supply chain outcome. Ambient drinks in the United States may sit in summer heat in Phoenix, move through humid Gulf Coast warehouses near Houston, or spend weeks in inland distribution before reaching stores in Denver or Minneapolis. Real shelf life planning therefore includes transportation and retail abuse conditions, not ideal lab storage only. A practical extension strategy often includes: validated kill step, controlled pH, low oxygen pickup, sanitary hold tanks, closed transfers, package testing, accelerated studies, and periodic real-time verification. For brands moving from regional to national distribution, these measures usually become mandatory. A recent type of case frequently seen in U.S. beverage expansion is a manufacturer planning major capital spending to add throughput when the true bottleneck lies elsewhere. DPS has built a reputation for stepping back and diagnosing the entire operation first. That can mean identifying controls logic, utility constraints, or poor line balance before recommending major equipment purchases. This kind of business-minded execution is one reason larger food and beverage manufacturers across North America use the company for design, build, and managed delivery rather than isolated machine procurement. In 2026, future trends in the U.S. still beverage market are likely to include more automation-led recipe control, stronger traceability expectations from retailers, continued sustainability pressure on packaging, and growing state-level attention to water use, wastewater, and energy efficiency. Lines that can switch formats quickly, use less utility intensity, and support clean-label processing will be better positioned. For project examples and execution style, manufacturers can review selected case studies and project outcomes to see how integrated planning improves ramp-up and reduces hidden costs. Hot fill is often the most practical starting point if the flavor profile tolerates the heat and the package is compatible. Aseptic may be better for premium quality retention or broader format flexibility. Aseptic is often the better choice when the product is heat-sensitive, preservative-free, expected to have long ambient shelf life, or is low-acid. It also fits brands seeking premium sensory performance and national distribution. Usually yes for high-speed U.S. operations with multiple SKUs, tight fill accuracy goals, and significant product value. Reduced giveaway and better automation often justify the investment. It is critical. pH affects microbial risk, thermal process assumptions, flavor, and shelf life. It should be tightly monitored with documented verification. Yes, but only with the right total process. Hot fill, aseptic, strong hygienic design, validated sanitation, and package compatibility are usually required. There is no universal best option. PET works well for many mainstream products, glass fits premium positioning, cartons fit aseptic shelf-stable systems, and pouches fit convenience-driven applications. Ask about process validation, utility loads, CIP logic, filler accuracy, package flexibility, spare parts availability, service response, automation integration, and expansion path for future SKUs. Review regional service coverage, install base, fabrication support, code compliance, lead times through ports or domestic factories, and whether the supplier can integrate controls, utilities, and commissioning rather than only ship equipment. Juice, tea, functional wellness drinks, plant-based beverages, dairy alternatives, sports nutrition, school beverage programs, foodservice concentrates, and co-packing operations all rely on these systems. DPS combines engineering, equipment integration, project management, and on-the-ground execution for food and beverage manufacturers across North America. Its approach is especially valuable for companies that want complete process systems aligned with profitability, not just a collection of machines. For beverage manufacturers in the United States, the strongest non-carbonated beverage processing strategy is the one that aligns product science, equipment design, package selection, utilities, and commercial reality from day one. Whether the product is a value juice drink for the Southeast, a premium functional beverage shipping coast to coast, or a multi-SKU co-packing line near major freight lanes, profitable execution depends on treating the process as a complete engineered system. -
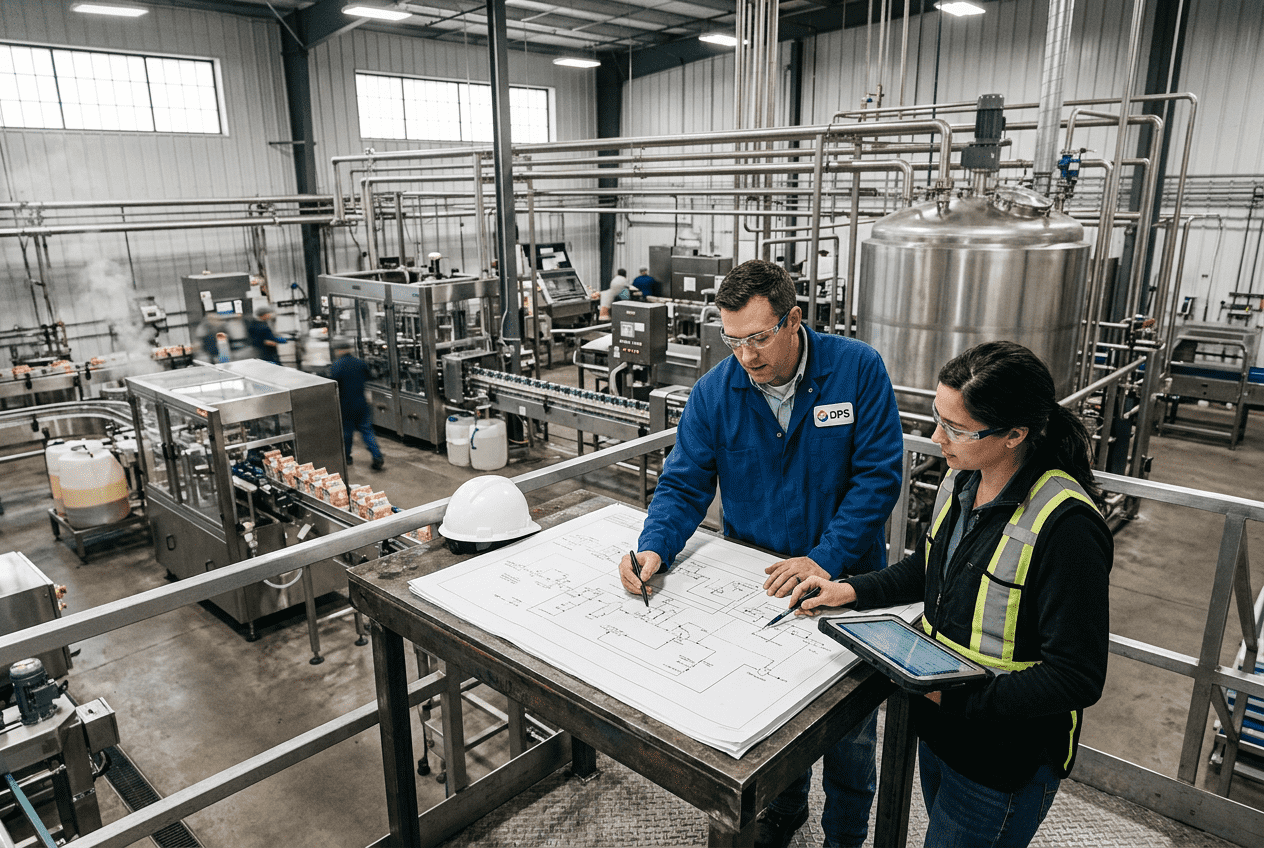
HMI Design Best Practices for Food Facilities: ISA-101 Operator Interface Guide
Human-machine interface design in food and beverage operations is not just a controls topic. In the United States, it directly affects operator response time, sanitation readiness, batch consistency, uptime, audit performance, and training efficiency. Whether a plant runs dairy, protein, prepared foods, brewing, aseptic filling, retort, or sauces, a poorly designed HMI can hide critical process conditions behind bright graphics, inconsistent navigation, and unclear alarms. A well-designed ISA-101 style operator interface does the opposite: it reduces cognitive load, highlights abnormal situations, and helps operators make faster, better decisions. Across U.S. manufacturing hubs such as Chicago, Charlotte, Dallas-Fort Worth, Fresno, Kansas City, Atlanta, Milwaukee, and Central Valley processing corridors, food plants are modernizing controls to support labor shortages, stricter traceability, water and energy targets, and 2026 readiness for more connected operations. That is why HMI design best practices now matter at the same level as hygienic layout, utility planning, and line integration. The short answer is this: for food facilities in the United States, the best HMI follows ISA-101 principles by using low-contrast graphics during normal operation, reserving red strictly for alarms, organizing screens in a clear hierarchy from plant overview to unit detail and faceplate control, and presenting process values with trends and normal operating ranges rather than isolated numbers. In washdown environments, screens must also account for glove use, water exposure, touchscreen readability, and cleanable mounting methods. The result is an interface that improves safety, product quality, training speed, and operator confidence. For buyers evaluating new automation or retrofits, the most practical approach is to treat the HMI as part of operations engineering rather than decoration. That means standardizing alarm priorities, navigation rules, object libraries, naming conventions, trend windows, historian tags, user roles, and hardware enclosure requirements before screen development begins. Plants that skip this foundation often end up with different HMIs on every line, higher support costs, and slower troubleshooting. In food and beverage settings, the stakes are unusually high. An unclear pasteurizer screen can jeopardize lethality margins. A poorly displayed CIP sequence can lead to chemistry misuse or incomplete verification. An overloaded fermentation dashboard can mask pressure drift. In a meat or prepared foods facility, a confusing batch transfer display can lead to rework, waste, or label-control risk. ISA-101 style design is valuable because it aligns the interface with operator action and process understanding. A calm-display philosophy means the screen should appear visually quiet when the process is healthy. Many legacy HMIs in U.S. food plants still use bright blue tanks, green pumps, flashing pipes, and complex shadows. These graphics may look impressive during a factory acceptance test, but they create visual noise. Operators begin to ignore the screen because everything appears urgent all the time. ISA-101 pushes the opposite approach: neutral backgrounds, restrained color, and emphasis only when intervention is needed. For food facilities, this matters in areas such as syrup rooms, blending skids, HTST systems, CIP sets, retort banks, evaporators, tank farms, and packaging lines. A calm display allows abnormal conditions to stand out immediately. It also helps supervisors and maintenance technicians review conditions from a distance without decoding decorative symbols. In practice, a low-contrast screen typically uses gray, charcoal, or muted neutral backgrounds with simple piping and equipment outlines. Running equipment may be indicated by subtle state changes instead of bright animation. Process values remain clear and legible, but not oversized unless they are action-critical. The design goal is not to make the screen look empty; it is to make important information visible at the moment it matters. The table above shows the central logic of calm-display design. In food facilities, operators often split attention between the HMI, line equipment, radios, quality checks, and sanitation constraints. A quiet screen supports this multitasking environment better than a graphic-heavy one. The line chart reflects a realistic trend in the United States: more food manufacturers are treating HMI modernization as part of broader digital reliability and workforce strategy. Growth is being driven by labor turnover, cybersecurity upgrades, line integration, and stricter performance expectations from ownership groups and private equity-backed operators. Color discipline is one of the most important rules in HMI design. If red is used for pumps, valves, backgrounds, logos, or decorative states, it loses its meaning when a real alarm occurs. In a food plant, that can delay reaction to a high-temperature deviation, low differential pressure, CIP conductivity miss, VFD trip, overpressure event, or safety interlock issue. Red should be reserved for alarms and other conditions requiring immediate operator attention according to the plant’s alarm philosophy. Amber or yellow can indicate warnings or abnormal conditions that are not yet alarms. Green should not be overused as a blanket “everything is okay” color, because a mostly green screen becomes almost as noisy as a flashy one. Instead, many high-performance HMIs rely on grayscale for normal operation, then use color sparingly for status meaning. This is especially useful in FDA, USDA, SQF, and BRC-driven environments where documented response and procedural clarity matter. During investigations or event reviews, clear visual logic helps explain what operators saw and when. The table above works best when paired with a written site standard. Plants with multiple vendors, co-pack lines, and acquisitions often inherit inconsistent color practices. Standardization across all facilities or at least all U.S. sites can sharply reduce training time. The bar chart highlights where HMI discipline is especially valuable. Beverage and aseptic operations often lead demand because they rely on precise sequence control, recipe management, sanitation confirmation, and continuous process visibility. Protein and dairy plants also score high because quality risk and audit sensitivity are substantial. Good HMI navigation follows a hierarchy. Operators should be able to move from a plant-wide overview to area screens, then unit screens, then device faceplates and detailed diagnostics without getting lost. This sounds simple, but many systems fail here. Screens are often built by equipment package, programmer preference, or project timeline rather than operator workflow. In a U.S. food plant, the ideal structure usually begins with a high-level plant or process area overview. From there, operators drill into systems such as utilities, receiving, batching, thermal processing, packaging, CIP, wastewater, or cold storage support. Unit detail pages then show one skid, line, or process module. Faceplates provide direct control and diagnostics for instruments, motors, valves, drives, and loops. This approach is especially useful for multi-building campuses near major logistics and manufacturing centers such as Houston, Memphis, Indianapolis, or the Port of Savannah supply corridor, where plants may have older utilities feeding newer process lines. A consistent navigation standard prevents confusion across expansions and relocations. The value of this hierarchy is operational speed. When a homogenizer faults, a transfer pump stalls, or a retort batch holds, the operator should not click through ten unrelated graphics to find device details. Screen transitions should be obvious, consistent, and available from every major view. Plants evaluating OEM packages should insist on these rules during procurement. Buying advice is straightforward: request navigation mockups, object libraries, alarm color definitions, and faceplate standards before code is accepted. That requirement reduces expensive standardization work later. An isolated temperature, pressure, flow, or conductivity value rarely tells the full story. Operators need context to know whether a process is drifting, stable, or recovering. That is why effective HMIs pair live values with mini-trends, target ranges, and normal operating envelopes. For food processing applications, this principle is essential. Examples include: When operators can see the trend and expected range, they intervene earlier and more accurately. This reduces false reactions, nuisance alarms, and product loss. In regulated environments, it also supports better investigations and training. The table above reinforces a core design principle: show meaning, not just measurement. This is particularly important in facilities with rotating labor, where not every operator has years of tribal process knowledge. The area chart shows a realistic industry shift toward trend-based operator displays. By 2026, more U.S. projects are expected to favor contextual displays because they better support remote engineering review, training, and root-cause analysis. Food plants face conditions that generic HMI guidance often underestimates: wet zones, caustic cleaning, changing gloves, condensation, temperature swings, and visibility issues under bright production lighting. In washdown environments, touchscreen design must support operation without compromising hygienic requirements or durability. Buttons need enough size and spacing for gloved hands. Touch targets should avoid edge-only activation. Fonts must remain readable at practical standoff distances. Critical actions should include confirmation logic, especially in sanitation, thermal processing, and transfer routing. If a plant uses mobile tablets or industrial handhelds, network coverage, user authentication, and role-based screen simplification must also be considered. Plants in coastal areas such as Southern California, New Jersey, or Gulf Coast regions may also account for humidity, corrosion exposure, and cleaning-agent compatibility. In meat, dairy, and ready-to-eat facilities, enclosure selection and mounting details are as important as software design. This is where equipment and supplier evaluation becomes practical. Local suppliers may offer attractive panel hardware, but buyers should ask whether the devices are proven in food washdown conditions, whether replacement parts are stocked in the United States, and whether the touchscreen remains reliable with gloves and moisture. Plants around Los Angeles, Raleigh-Durham, Milwaukee, and Minneapolis often benefit from regional support availability, especially when downtime windows are tight. Strong HMI outcomes depend on engineering discipline behind the screens. The visual layer should be tied to a documented technical standard covering PLC naming conventions, alarm classes, ISA-101 screen philosophy, ISA-18.2 alarm integration, historian strategy, cybersecurity, user management, and data integrity expectations. This section is also the best place to evaluate a partner’s technological capabilities. For example, a qualified engineering firm should be able to connect HMI design with structural, mechanical, electrical, process, and controls realities. In food and beverage environments, that includes PLC programming, SCADA architecture, utility coordination, sequence design, batch logic, instrument selection, and commissioning support. It also means understanding actual process technologies such as fermentation systems, distillation, pasteurization, aseptic lines, retort, carbonation, blending, filtration, water treatment, grinding, mixing, cooking, marination, dairy processing, and plant-protein systems. HMI standards work best when the team understands how the process truly runs. Companies such as DPS engineering and integration services are relevant here because food manufacturers often need more than a programmer. They need a partner that can tie interface design to utilities, process sequences, compliance expectations, and production economics. That alignment is especially important in capital projects where one screen issue can affect commissioning, training, and OEE at startup. The table above should be part of any RFP or automation scope package. It also helps compare products and suppliers beyond price alone. A lower-cost HMI package without documentation, alarm discipline, or reusable standards often becomes more expensive over the life of the plant. The comparison chart illustrates why many manufacturers prefer a food-focused systems partner over a generic graphics provider. Screen design quality depends heavily on process understanding, startup support, and the ability to integrate HMI choices with the broader capital project. The best implementation roadmap starts before graphics are built. First, define business goals: faster operator response, training consistency, fewer nuisance alarms, better sanitation verification, less downtime, or easier startup across multiple U.S. plants. Then establish a standard library and governance model before touching individual screens. A practical rollout sequence usually includes assessment, standard creation, pilot deployment, operator feedback, revision, and scale-up. Plants should also identify the right pilot area. Good candidates include a CIP system, blending skid, pasteurizer, boiler room, or one representative packaging line. These systems provide enough complexity to test navigation, trends, device faceplates, and alarm logic without exposing the entire site to simultaneous change. Project best practices include involving operators early, not just during acceptance. Maintenance teams should review diagnostics and faceplates. Quality teams should review trend visibility for CCPs, sanitation steps, or recipe checks. IT and OT teams should review remote access, backups, and user permissions. Training materials should include not just “how to click” but also “why the screen looks this way.” For larger capital programs, some firms use a design-build-manage approach because it keeps interface standards tied to equipment, utilities, schedule, and field execution. That is relevant for companies undertaking new facilities, major line additions, or relocations. A firm that can engineer the system, coordinate field trades, and manage execution often reduces the disconnect between screen design and actual plant startup. Readers exploring this broader model can review food and beverage project examples to see how integrated execution supports better outcomes. The roadmap table matters because successful HMI projects are organizational change projects, not just coding exercises. In the U.S. market, that is particularly true for multi-site manufacturers with facilities spread across the Midwest, Southeast, Texas, and the West Coast. Looking toward 2026, future trends include increased use of role-based mobile views, better contextual analytics inside SCADA, stronger OT cybersecurity requirements, energy and water dashboards linked to sustainability goals, and more policy attention to traceability and digital record confidence. Plants modernizing now should design standards that can support those additions later. Disruptive Process Solutions supports food and beverage manufacturers across the United States and Canada with a business-minded engineering approach focused on profitability, execution quality, and long-term plant performance. Rather than treating controls and HMI work as isolated graphics tasks, the company aligns operator interface design with process engineering, capital planning, utility integration, construction coordination, and startup success. From a technological capability standpoint, DPS brings process, controls, electrical, mechanical, plumbing, and structural understanding into one project framework. That matters when an HMI must accurately reflect real production behavior across fermentation, distillation, pasteurization, aseptic processing, batching, filtration, water treatment, protein processing, dairy operations, or advanced utility systems. Manufacturers looking for a partner that understands both automation and process consequence can learn more through the DPS team and operating philosophy. From a manufacturing capability perspective, DPS also designs and manufactures selected process equipment, including tanks, CIP systems, marination tumblers, and cooking vessels. That experience helps bridge the gap between what the operator sees on screen and how equipment actually behaves in the field. In practical terms, it supports better screen logic for skid operation, cleaner startup sequencing, and more useful maintenance diagnostics. Additional information on this side of the business is available through DPS process equipment solutions. From a service capability standpoint, DPS provides process design, feasibility support, owner’s representation, project and program management, general contracting functions where applicable, installation coordination, integration, commissioning, and end-to-end execution. This makes the company especially relevant for manufacturers building new lines, expanding utilities, relocating assets, or standardizing multiple sites. Its lean structure enables rapid decision-making while still supporting complex work across food, beverage, and regulated processing environments. For food manufacturers in the United States, this combination is valuable because HMI design best practices only deliver results when they are connected to process reality, field installation, startup pressures, and production economics. That is the difference between an interface that looks modern and one that genuinely improves plant performance. What is the biggest HMI design mistake in food facilities?The most common mistake is overusing color and animation, which makes abnormal conditions harder to detect. In food plants, this can slow response to quality, safety, or utility issues. Why is ISA-101 useful for U.S. food manufacturers?ISA-101 provides a structured approach to HMI design that improves consistency, operator awareness, and lifecycle maintainability. It is especially useful in multi-line and multi-site environments. Should every process value have a trend?Not every value, but every action-critical variable should have easy trend access. Temperatures, pressures, levels, flows, conductivity, pH, and Brix are strong candidates in food and beverage operations. Can old HMIs be upgraded without replacing the full control system?Often yes. Many plants modernize graphics, navigation, historians, and alarm handling while keeping core PLC hardware in place. The right path depends on platform age, network architecture, and cybersecurity requirements. What industries benefit most from these practices?Dairy, beverage, brewing, spirits, prepared foods, protein processing, sauces, aseptic operations, and co-packing all benefit because they rely on repeatable sequences, sanitation visibility, and clear operator action. How do I evaluate suppliers for an HMI redesign?Look beyond graphics samples. Ask about alarm philosophy, food process experience, washdown hardware knowledge, testing procedures, startup support, and the ability to standardize multiple lines or sites. How does mobile access fit into food plant HMI strategy?Mobile views are useful for supervisors, maintenance staff, and large campuses, but they must be role-based, secure, readable with PPE, and carefully limited for critical actions. What should be included in a pilot project?A pilot should include alarm handling, trends, navigation, faceplates, historian checks, operator feedback, and documented acceptance criteria. CIP systems, utility areas, and one representative process line are common starting points. What 2026 trends should plants plan for now?Expect more contextual analytics, sustainability dashboards, stronger OT security expectations, integrated mobile views, and tighter digital record expectations tied to quality and traceability. Does HMI design really affect profitability?Yes. Better interfaces reduce downtime, product loss, training time, nuisance alarms, and troubleshooting hours. In high-throughput U.S. food and beverage plants, those gains add up quickly. -
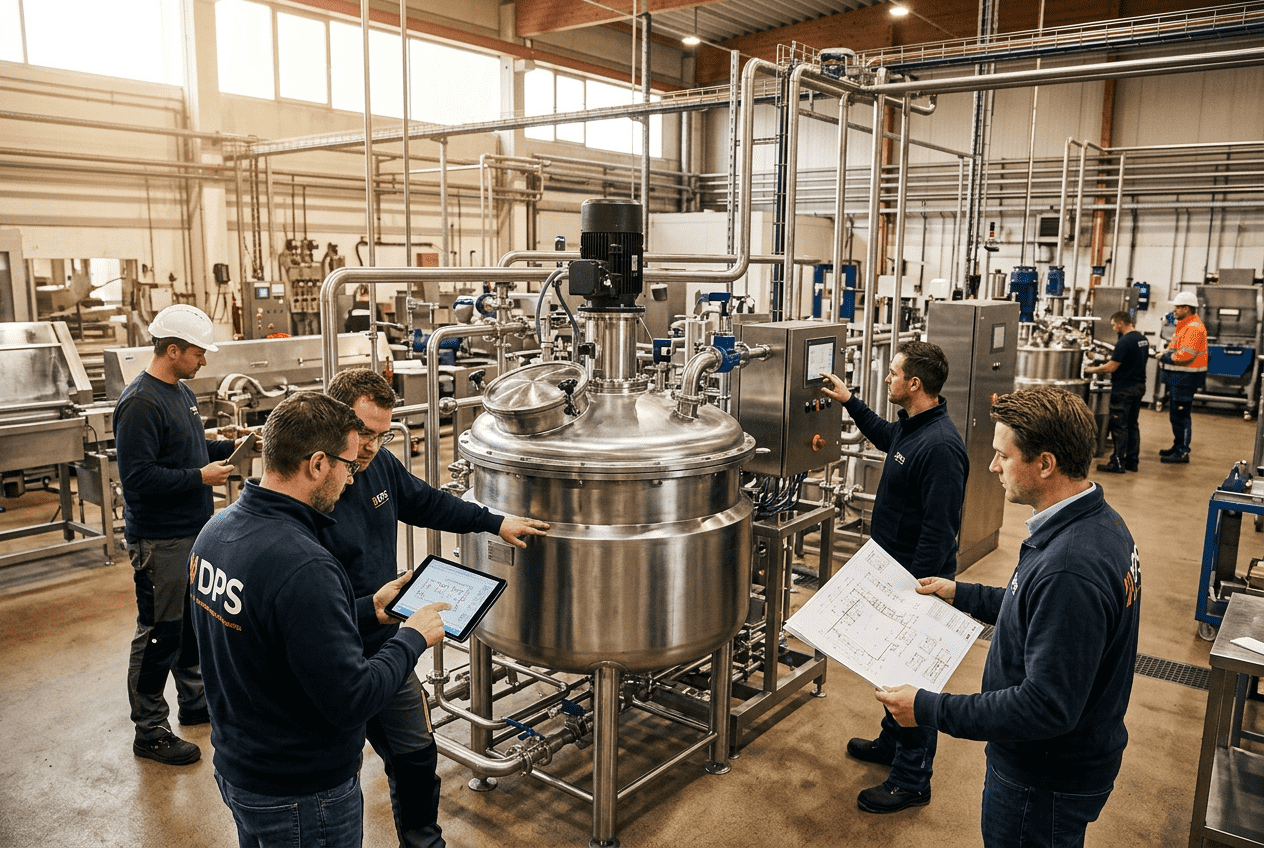
MES Integration for Food Plants: Closing the Gap Between Planning & Production
Food and beverage manufacturers across the United States are under pressure to run faster, document more, waste less, and comply with stricter customer and regulatory expectations. In many plants, the planning team releases production orders in the ERP system, but operators still rely on paper packets, spreadsheets, radio calls, and manual entries to execute the work on the floor. That gap creates rework, delayed quality decisions, poor visibility into yield loss, and weak traceability. A well-integrated manufacturing execution system, or MES, closes that gap by turning planning data into guided production, connecting machine and sensor data to material usage, and creating a reliable digital record of what actually happened. For U.S. processors in markets such as poultry in Arkansas, dairy in Wisconsin, sauces in Illinois, protein in Texas, and beverage co-packing in California and North Carolina, MES integration is no longer just an IT project. It is an operational profitability project. It touches throughput, labor utilization, first-pass quality, waste reduction, customer responsiveness, and audit readiness. The strongest business case usually appears where ERP, PLC, SCADA, lab systems, and quality workflows all exist, but the data between them is fragmented. This page explains how MES integration works in real food plants, what technical requirements matter, where inline sensors and automated workflows create the most value, how to evaluate suppliers in the U.S. market, and how to implement a roadmap that supports both compliance and production performance. It also reflects the practical perspective of Disruptive Process Solutions, a U.S.-based food and beverage engineering firm that approaches automation, controls, utilities, process design, and project execution as one connected system rather than isolated disciplines. An MES integrated with ERP, SCADA, PLCs, inline instruments, and quality systems allows a food plant to receive released production orders automatically, route them to lines and operators digitally, collect live process and consumption data, trigger non-conformance workflows in real time, generate electronic batch records, and provide production leadership with accurate visibility into yield, waste, downtime, and traceability. In the United States, this is especially valuable for FDA, USDA, SQF, and BRC environments where documentation accuracy and response speed matter just as much as line efficiency. In practical terms, MES integration helps food manufacturers do five things better: The value is strongest in multi-step production environments such as batching, blending, cooking, CIP, filling, packaging, retort, fermentation, dairy standardization, protein marination, and co-packing. Plants around Chicago, Atlanta, Dallas, Fresno, Kansas City, and the I-95 corridor often prioritize MES because they need tighter coordination between receiving, processing, packaging, warehousing, and outbound logistics linked to major trade hubs and port networks such as Los Angeles, Long Beach, Savannah, Houston, New York and New Jersey. The table shows why MES projects should be evaluated as operating model improvements, not just software purchases. The technology matters, but the real outcome is disciplined execution at line level. The growth curve above reflects the broad U.S. trend toward more connected operations. Through 2026 and beyond, capital projects are increasingly expected to include digital execution, sustainability reporting, and stronger data integrity from the start. When a production planner releases an order in ERP, the plant needs that order to become actionable on the floor immediately. In many factories, that handoff still depends on someone emailing a schedule, printing paperwork, or manually assigning tasks in a separate system. MES integration removes that lag. The ERP system sends the order, recipe version, material requirements, due date, line assignment, and lot control rules to the MES platform. MES then sequences work, enforces the right setup, confirms line readiness, and guides operators step by step. For U.S. food plants, this is critical where production complexity is high. A protein processor in Omaha or Springdale may need to coordinate trim sources, allergens, rework rules, cook schedules, and packaging labels within a tight shipping window. A beverage co-packer near Charlotte or Southern California may need to switch between SKUs rapidly while ensuring syrup, carbonation, filler, and packaging parameters remain aligned to customer specifications. In both cases, an automated release-to-execution workflow reduces planning friction and improves schedule adherence. Good MES order execution typically includes: One of the most important buying questions is whether the plant needs discrete order execution, batch execution, or hybrid execution. Food plants often need all three. A sauce line may run batch cooking upstream, continuous transfer through holding and filling, and discrete case packing downstream. The MES architecture must support that mixed production reality. This table highlights how ERP-to-MES automation is not generic. The data package must be designed around the process, the quality model, and the specific commercial risks of each product family. One of the fastest-return MES use cases in U.S. food manufacturing is live yield and waste visibility. Plants usually know their standard yields, but they often discover losses too late. If giveaway, overfill, trim loss, evaporation, solids loss, syrup imbalance, poor batter pickup, or CIP-related product loss is found only at shift close, the corrective opportunity has already passed. MES changes that by tying inline sensors and machine signals directly to production context. Depending on the process, the plant may use mass flow meters, Coriolis meters, magnetic flow meters, level transmitters, load cells, inline Brix meters, conductivity, pH, temperature, pressure, vision systems, metal detection results, checkweighers, moisture analyzers, and packaging counters. The SCADA or PLC layer captures the raw values, and MES converts them into business meaning: actual ingredient use, giveaway rate, scrap by cause, recovery by line, or yield by product code. This matters in products where small variances create major annual losses. A dairy beverage line in California with chronic overfill can lose substantial margin even with a fraction of an ounce per bottle. A poultry further-processing facility in Georgia may see major value in live pickup and cook-yield analytics. A sauce plant in New Jersey can use inline Brix and flow balance to identify formulation drift before it becomes rework or hold inventory. The chart suggests where live yield visibility often drives the strongest demand. Protein, beverage, and dairy operations typically see quick gains because ingredient cost, fill accuracy, and process loss are so financially sensitive. To make these capabilities useful, sensor data must be time-synchronized, tagged correctly, and tied to order, SKU, batch, lot, and equipment state. Data without context is noise. Data in context is margin intelligence. A disconnected plant often handles quality events through phone calls, hallway conversations, shared drives, and delayed spreadsheets. That creates avoidable risk. If an inline metal detector fails, a pH value drifts, a retort cycle misses a parameter, or a sanitation verification step is incomplete, the plant needs an immediate and documented response. MES can automate that response. In a non-conformance workflow, MES receives an event from SCADA, a lab system, an operator entry screen, or a connected inspection device. It then applies rules: stop the line, place product on hold, alert quality, require supervisory signoff, create an investigation record, route corrective action tasks, and restrict release until disposition is complete. For FDA- and USDA-regulated facilities, speed and traceability are essential. For SQF and BRC certified sites, consistent workflow discipline is equally important. Examples include: For plants serving national distribution through hubs like Memphis, Columbus, and Dallas-Fort Worth, a faster digital hold-and-release process also improves logistics. Product can be segregated and dispositioned before it causes warehouse congestion or customer service disruption. The explanation is simple: non-conformance automation is not only about compliance. It also reduces ambiguity, protects uptime, and helps managers understand whether failures are isolated or systemic. Electronic batch records, or EBRs, are one of the clearest advantages of MES in food and beverage operations. A complete EBR can combine order data, recipe version, operator actions, machine states, process values, CIP verification, material lots, in-process checks, deviations, hold events, signoffs, and final release status in one searchable record. Instead of hunting through paper folders, scattered spreadsheets, SCADA screens, and maintenance notes, the plant can retrieve the complete production history in minutes. This is especially valuable in high-compliance environments such as aseptic processing, dairy, ready-to-drink beverages, infant and medical nutrition support operations, protein cooking and chilling validation, and shelf-stable retort products. During audits or customer visits, the ability to show a clean record quickly increases confidence. The EBR should not be treated as a PDF archive project. It should be designed as a living data model. The best systems support exception-by-exception review, role-based signoff, audit trails, time stamps, and secure change management. Plants that intend to scale across multiple U.S. sites also need template governance so that a facility in California, a second site in Texas, and a third site in the Midwest can work from common standards while preserving local process differences. The area trend reflects a steady shift across the U.S. market from paper-heavy records to integrated digital execution. By 2026, many capital projects are expected to justify how they will support digital traceability, sustainability metrics, and quicker audit response. SCADA is excellent at monitoring and controlling the process. MES is excellent at contextualizing what that process means for production, quality, genealogy, and performance. Problems arise when plants ask SCADA to act like a business system or ask ERP to infer what happened on the line without direct operational data. A strong SCADA-to-MES data flow solves that problem. In a typical architecture, PLCs control equipment and field devices. SCADA provides visualization, alarming, trending, recipe supervision, and operator interaction at process level. MES receives structured events and values from SCADA or directly from historians and then associates those values with orders, SKUs, lots, operators, shifts, equipment states, and business rules. ERP receives summarized and validated production outcomes such as good quantity, consumed quantity, scrap, lot genealogy, downtime categories, and completion status. The plants that struggle most with manual handoffs usually have one or more of these issues: DPS often approaches this type of problem as both a controls and operations challenge. On the technological side, the company works across process, controls, PLC programming, automation, and SCADA. On the manufacturing side, it understands the realities of batching, blending, pasteurization, aseptic systems, fermentation, retort, dairy, protein, and co-packing. On the service side, it combines engineering, integration, installation, commissioning, and project management to turn architecture decisions into operating assets. You can review related capabilities on the services page. The explanation here is that each layer has a different job. Plants get the best results when they stop forcing one layer to compensate for missing design in another. The success of MES integration depends heavily on engineering discipline. Software demonstrations often focus on screens and dashboards, but the real project risk usually sits in network design, device readiness, data models, naming standards, recipe governance, validation rules, cybersecurity, and utility reliability. Food plants should define technical specifications before procurement whenever possible. At minimum, an MES specification in the United States should address process scope, line list, utility dependencies, source systems, data ownership, cybersecurity standards, historian strategy, user roles, backup and recovery, batch or discrete execution logic, reporting requirements, audit trails, and interfaces to ERP, lab, maintenance, and warehouse functions. Plants with thermal processing, aseptic, or dairy critical controls should also define how MES will support verification, exceptions, and release workflows. This is where a multidisciplinary partner matters. DPS brings technological capabilities in structural, mechanical, plumbing, electrical, process, and controls engineering, including PLC programming and SCADA. That matters because MES performance depends on the broader plant ecosystem: tanks, CIP systems, pumps, utilities, fillers, refrigeration, compressed air, steam, process water, and instrumentation all influence data quality and execution reliability. You can also explore the firm’s equipment capabilities where custom tanks, CIP systems, and process vessels can be designed with integration requirements in mind. This table shows that engineering requirements are not optional detail. They are the foundation that determines whether MES becomes a trusted operating system or just another underused application. MES projects succeed when the plant treats them as phased operational transformations. The best roadmap usually starts with a business case tied to one or two high-value production areas, not a plant-wide “big bang.” Many U.S. manufacturers begin with one pilot line or one process family, prove value in yield, quality, and labor reduction, and then scale across the facility or enterprise. A practical roadmap often includes six phases: Best practices include naming one operational owner, standardizing downtime and waste codes early, involving QA from day one, validating lot and genealogy rules before go-live, and training supervisors on exception management rather than just transaction entry. Plants should also measure success using operational KPIs such as schedule attainment, right-first-time rate, live yield accuracy, waste by cause, release cycle time, and audit retrieval time. DPS is particularly relevant in this phase because its service capabilities go beyond software coordination. The company works as an engineering and execution partner using a design-build-manage approach, handling planning, owner’s representation, project management, general contracting where applicable, equipment integration, and commissioning. For manufacturers balancing capital scope, utility upgrades, controls changes, and MES rollout in one program, that integrated execution model reduces risk. Real-world examples of multidisciplinary delivery can be seen on the project case studies page. The explanation is that a staged approach lowers risk and gives leadership real evidence before broader investment. It also helps plants absorb change without overwhelming supervisors and operators. The comparison chart illustrates why many plants eventually move past disconnected point solutions. They may solve one issue, but they rarely create a unified execution model. Disruptive Process Solutions serves manufacturers across all 50 U.S. states and Canada with a practical focus on profitable execution in food and beverage capital projects. Rather than approaching a plant through one narrow discipline, DPS aligns process engineering, utilities, controls, equipment, installation, and project management around the client’s commercial objectives. That matters for MES-related programs because software results depend on clean process design, reliable equipment integration, and disciplined project delivery. From a technological perspective, DPS works across process and controls engineering, PLC programming, automation, SCADA, and system integration. From a manufacturing perspective, the company supports beverage, dairy, protein, prepared foods, sauces, aseptic, retort, fermentation, and co-packing applications, while also providing custom process equipment such as tanks, CIP systems, tumblers, and vessels that can be built with digital connectivity in mind. From a service perspective, DPS offers capital planning, feasibility, owner’s representation, project and program management, installation oversight, and turnkey execution through its design-build-manage model. That combination is useful for U.S. manufacturers that need more than a software reseller. A plant may need utility upgrades, line reconfiguration, instrumentation improvements, recipe control updates, and compliance-driven documentation design at the same time. DPS is structured to address that larger operational picture so the digital layer supports real plant performance. Learn more at our company page. Looking toward 2026, manufacturers should expect three major trends to shape MES investment decisions in the United States: For plants near major logistics corridors such as Houston, Indianapolis, the Central Valley, the Carolinas, and the Great Lakes region, faster response, better data, and scalable standardization will increasingly separate profitable operators from reactive ones. SCADA monitors and controls the process in real time. MES manages execution context, production orders, genealogy, quality workflows, performance metrics, and batch or work-order records. They are complementary, not competing systems. A focused pilot can take a few months, while a multi-line or multi-site rollout can take much longer depending on data cleanup, controls readiness, quality workflow complexity, and ERP interface scope. Plants usually get better results with phased deployment. Beverage, dairy, protein, prepared foods, and high-compliance aseptic or retort operations often see strong returns because they have high material cost sensitivity, frequent changeovers, strict traceability needs, or complex batch records. Not always. Many projects begin by using existing PLC and SCADA signals. However, adding or upgrading flow meters, load cells, checkweighers, inline analyzers, or vision systems can greatly improve the value of MES by making yield and quality data more accurate. Yes. MES supports compliance by enforcing workflows, recording time-stamped actions, improving lot traceability, documenting deviations, and generating electronic records that are easier to review during audits or investigations. Look for food-specific process understanding, strong controls integration experience, clear cybersecurity and data architecture standards, realistic implementation planning, and the ability to connect software design to real plant engineering and operations. It depends on the pain point. If schedule execution and paperwork errors are the main issue, ERP-to-MES may lead. If hidden process loss and poor real-time visibility are bigger issues, SCADA-to-MES integration may create the fastest value. Many plants need both in a staged plan. Build the case around measurable outcomes: reduced giveaway, lower waste, faster quality disposition, improved schedule adherence, less manual entry, reduced audit retrieval time, and better lot traceability. Tie the project to profitability and risk reduction, not just technology modernization. -
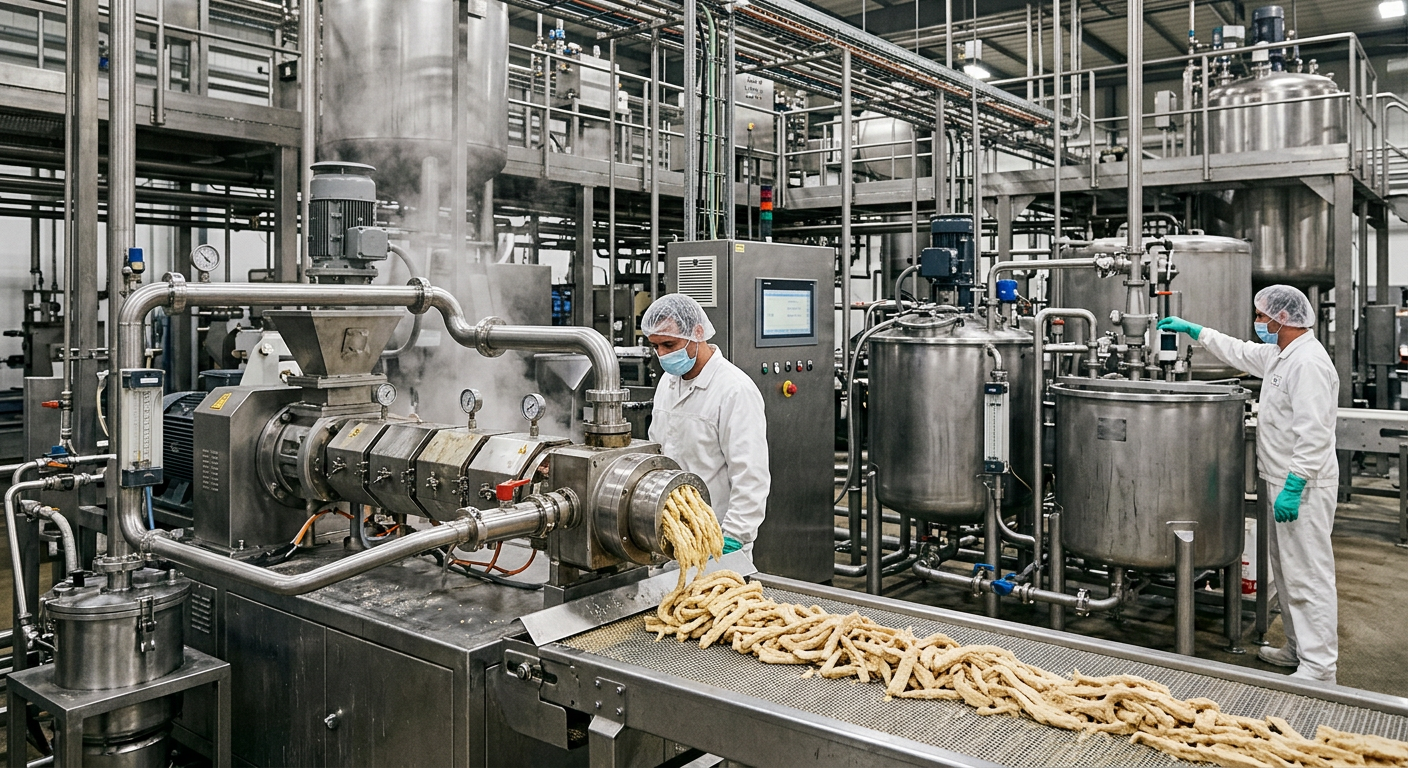
Soft Drink Processing Systems
Carbonated soft drink manufacturing in the United States depends on tightly integrated process systems that control water quality, syrup preparation, carbonation, hygienic filling, package handling, and sanitation. A well-designed soft drink processing line typically begins with incoming utility water treatment, moves through ingredient handling and proportioning, then into carbonation and isobaric filling, before ending with capping, coding, secondary packaging, and palletizing. For U.S. producers operating in markets such as Chicago, Dallas, Los Angeles, Atlanta, Charlotte, and New Jersey distribution corridors, the right system design affects not only product taste and shelf life, but also labor efficiency, compliance, and total cost per case. Whether the application is cola, lemon-lime CSD, energy soda, flavored sparkling water, prebiotic soda, or private-label carbonated beverages, manufacturers need processing equipment sized to their production goals, utility constraints, and packaging formats. That includes PET, cans, glass, and specialty package types for club stores, foodservice, and e-commerce channels. A profitable line is not just about buying machines; it is about designing the entire process around throughput, changeover frequency, quality control, sanitation, and future growth. Soft drink processing systems are complete beverage production lines that treat water, prepare syrup, blend ingredients, carbonate product, fill bottles or cans under pressure, cap containers, and sanitize equipment through automated clean-in-place routines. In the United States, common line capacities range from 2,000 to 36,000 bottles per hour, with system selection driven by product mix, package type, labor strategy, utility costs, and food safety requirements. For most U.S. manufacturers, the best approach is to evaluate the project as an integrated capital plan rather than as separate equipment purchases. This is especially important for companies serving regional retail and distribution networks linked to ports and freight hubs such as Long Beach, Savannah, Houston, Norfolk, and the Inland Empire, where demand spikes and SKU expansion can put stress on poorly planned utilities and processing rooms. A properly engineered system improves uptime, protects flavor consistency, lowers chemical and water use, and creates a practical path for scale. The table above shows why line configuration should follow the business model. A low-SKU regional plant may prioritize simplicity and maintenance access, while a co-packer near major grocery routes in the Midwest or Southeast often values recipe management, changeover speed, and lot traceability above maximum line speed. The soft drink production process follows a clear sequence, although exact layouts vary by package type and plant footprint. First, incoming water is prefiltered and conditioned through a treatment system designed around local source quality. Water in Phoenix, Tampa, or Minneapolis may require a different treatment profile based on hardness, chlorine level, dissolved solids, and microbiological risk. Once treated, water enters storage and distribution to the syrup room and blending area. Next comes syrup preparation. Sweeteners, flavor concentrates, acids, preservatives, colors, and functional ingredients are mixed in controlled batches or continuously proportioned in-line. Brix, acidity, and temperature must stay within specification to protect taste consistency. The beverage base is then blended with treated water at the correct ratio. For carbonated products, the beverage is chilled and sent to a carbonation unit, where CO2 is dissolved under controlled pressure and temperature. After carbonation, the product moves to filling. Carbonated beverages require isobaric filling to minimize foam and preserve gas content. Containers are usually rinsed or ionized, filled, capped immediately, and inspected for fill level, cap torque, or seam quality depending on the format. The packaged product then proceeds through date coding, label application if needed, secondary packaging, palletizing, and warehouse staging. Final packaging is more than an end-of-line activity. It is where throughput, retail readiness, and logistics converge. Plants shipping to big-box networks in the United States often need tray-packs, shrink bundles, case erectors, and pallet patterns optimized for truckload utilization. Beverage companies distributing from hubs like Columbus, Memphis, and Kansas City benefit when production engineering is aligned with outbound freight strategy from the start. This production flow is the baseline for most CSD plants. The exact balance between batch and continuous processing depends on demand volatility, flavor change frequency, available labor, and whether the line serves one brand or multiple customers. The market growth line above reflects a realistic rise in capital investment across U.S. beverage plants as producers upgrade for automation, SKU diversity, water efficiency, and sustainability targets heading into 2026. Water is the largest ingredient in most soft drinks, so treatment quality has a direct effect on taste, carbonation stability, and shelf life. In the United States, incoming water chemistry varies widely by region. Municipal water in the Northeast may present chlorine or chloramine management needs, while some Southwestern locations require more intensive dissolved solids control. For this reason, water treatment systems are usually custom configured rather than bought as generic packages. Reverse osmosis removes dissolved salts, hardness, and many impurities that affect taste and equipment performance. Activated carbon filtration is commonly used to remove chlorine, chloramine precursors, odor compounds, and trace organics that could interfere with flavor profiles. UV sterilization serves as a non-chemical microbiological control point, reducing the risk of microbial contamination in treated process water. A robust system may also include multimedia filtration, cartridge filtration, softening, ozone in certain applications, deaeration, storage, recirculation, and monitoring for conductivity, oxidation-reduction potential, and flow. The right combination depends on source water testing, production volume, ingredient sensitivity, and sanitation philosophy. Plants supplying multiple beverage types often need a more flexible utility backbone than single-SKU operations. From a technology standpoint, process equipment solutions from an experienced integrator can align treatment skids with blending demand, CIP circuits, and future expansion. That matters because water treatment is not just a standalone utility island; it influences every downstream process, from syrup room throughput to filler performance. The table shows how each technology supports a specific process objective. RO is not always mandatory, but it is common where flavor precision, dissolved solids reduction, and scale control are critical. Carbon filtration is especially important in U.S. municipal systems where residual disinfectants can alter beverage taste if not properly removed. Syrup rooms are the formulation heart of a carbonated soft drink plant. Here, sweeteners, flavor concentrates, acids, preservatives, colors, and specialty additives are mixed into simple syrup or finished beverage base. For standard CSD manufacturing, producers may use sugar dissolution systems, liquid sweetener handling, jacketed mixing tanks, powder induction systems, load-cell batching, in-line blenders, and automated recipe control through PLC and SCADA platforms. The biggest performance variables are recipe accuracy, batch repeatability, viscosity management, sanitation access, and changeover speed. In a plant producing both mainstream soft drinks and premium functional soda, proportioning systems must handle very different ingredients and cleanability requirements. This is where automation and good process design create measurable value. In-line Brix monitoring, mass flow control, and automated valve sequencing can reduce giveaway while improving product consistency. For manufacturers scaling from pilot runs to commercial output, buying advice is straightforward: avoid building a syrup system that works only for today’s formula. U.S. beverage trends increasingly favor low-sugar, natural color, botanical, and fiber-fortified concepts. These products may need more sophisticated agitation, powder handling, ingredient staging, and traceability than classic CSD formulas. A system that allows modular growth can save substantial retrofit cost later. Companies that need integrated engineering for these systems often benefit from working with firms that combine process, mechanical, controls, and utility experience. On the engineering side, beverage system services can include recipe-based automation, piping integration, utility balancing, and process room layout planning to support faster startups and cleaner expansions. The demand chart highlights where processing investment is strongest across beverage categories. While traditional carbonated soft drinks remain a major market, U.S. buyers increasingly need proportioning flexibility for sparkling and functional variants. Carbonation is where product temperature, pressure, gas purity, and residence time come together. CO2 dissolves more effectively in colder liquid, so most carbonation systems are paired with chillers or heat exchange loops to keep beverage temperature low before filling. Stable carbonation protects mouthfeel, taste perception, and consumer acceptance. If temperature control drifts or syrup-to-water ratio changes, dissolved gas levels can fluctuate and create foaming problems at the filler. Isobaric filling technology is essential for carbonated beverages because it balances container and product pressure during filling. Without that pressure control, CO2 breaks out of solution and causes excessive foam, reduced fill accuracy, and product loss. Modern isobaric fillers use precise valves, bowl pressure management, and fast change parts to support PET, can, or glass packaging. For plants running multiple package formats, the filler must be selected based on real production constraints rather than brochure speed. Bottle geometry, cap type, product foaming tendency, sanitation windows, and operator skill all influence actual sustained output. In the United States, high-volume retail-focused plants often emphasize throughput, while premium and specialty producers may prioritize format flexibility and low dissolved oxygen pickup. Future trends through 2026 include better digital control of carbonation parameters, remote diagnostics, and tighter integration between blending, carbonation, and filler feedback signals. These upgrades can help plants reduce waste, improve changeovers, and maintain more stable CO2 levels even during long runs. This table underlines a critical point: carbonation and filling should never be viewed as isolated machines. They must be engineered together with upstream cooling and downstream closure control to achieve stable performance. RFC systems combine rinsing, filling, and capping into a single integrated monoblock. For many U.S. soft drink plants, this design improves footprint efficiency, simplifies container transfer, and reduces contamination exposure compared with separated machines. It is particularly valuable where floor space is limited or where line efficiency matters more than a highly segmented mechanical layout. Integrated RFC equipment is widely used in PET bottling for CSD products. Empty bottles are rinsed or sanitized, then transferred directly into the filling carousel and capped immediately afterward. This short path reduces handling and helps preserve hygiene. For plants in urban manufacturing zones such as Southern California, New York metro, or central Florida, where square footage and utilities carry a premium, compact monoblocks can improve return on capital. However, RFC selection should consider more than speed. Buyers should ask about valve changeover time, accessibility for maintenance, compatibility with lightweight bottles, spare parts availability in North America, and service response. A machine with excellent theoretical speed can still underperform if local support is weak or if format conversion requires excessive downtime. Manufacturing capability is another differentiator. A partner that can coordinate custom tanks, CIP skids, utility modules, and process integration around the RFC filler often delivers a smoother project than one that only sells the machine. In this area, firms with both integration depth and proprietary fabrication capability can shorten the path between design intent and operating reality. The area chart illustrates the shift toward more integrated line design. As labor pressure, hygiene expectations, and space efficiency become more important, RFC adoption continues to rise. Clean-in-place systems are essential for maintaining sanitary conditions in soft drink plants without disassembling tanks, pipelines, proportioners, carbonators, and fillers. While carbonated soft drinks are not all microbiologically high-risk in the same way as dairy or juice, sanitation still matters deeply for flavor protection, shelf stability, allergen management, and line reliability. Syrup residues, sweeteners, colors, and acids can create quality and maintenance problems if cleaning is inconsistent. A good CIP system includes dedicated solution tanks, heating, chemical dosing, recirculation pumps, instrumentation, return verification, and recipe-driven automation. Plants may use single-use or recovery CIP approaches depending on size, water costs, sanitation frequency, and sustainability targets. In regions where water and sewer charges are high, such as parts of California and the Northeast, recovery-based CIP can produce meaningful operating savings. 2026 trends point toward stronger sustainability expectations, tighter wastewater scrutiny, and more digital verification of sanitation cycles. U.S. manufacturers are increasingly tracking conductivity endpoints, temperature profiles, and cycle records electronically to support audits and continuous improvement. State-level environmental pressure is also encouraging lower water consumption and more efficient chemical use. Technological capability matters here. A company with experience in process engineering, automation, utilities, and sanitary design can ensure that CIP is correctly matched to line geometry, dead-leg control, flow rates, and target turbulence. Strong engineering prevents the common problem of buying a CIP skid that looks adequate on paper but fails to clean the actual installed system effectively. The explanation is simple: CIP is both a sanitation system and an operating cost lever. The right design reduces downtime, protects product quality, and supports compliance expectations across customer and certification requirements. Capacity planning should begin with actual sales and logistics assumptions, not just line speed targets. A 2,000 to 6,000 bottles per hour system may fit specialty beverage brands, pilot commercial operations, or local bottlers supplying a few states. Mid-range systems from 8,000 to 18,000 bottles per hour often serve regional chains, co-pack programs, and growing branded portfolios. High-output lines from 24,000 to 36,000 bottles per hour are usually justified by national distribution, major private-label contracts, or large-scale co-packing. But throughput is not the same as productivity. Net output depends on SKU count, sanitation time, package changes, syrup preparation rate, container supply consistency, and end-of-line performance. A plant near Atlanta with short local hauls and a stable SKU mix can run differently from a West Coast site feeding long-distance distribution across multiple states. Realistic line efficiency targets matter far more than theoretical maximum speeds. The table helps buyers align production scale with business stage. A common mistake is selecting a line based on peak sales hopes without investing equally in utilities, syrup room capacity, changeover management, and warehouse flow. True plant performance depends on the whole system. Capital cost for a soft drink processing plant in the United States varies widely based on automation level, package format, sanitation design, and site conditions. A small line may require a modest process skid investment, while a full-scale integrated facility with water treatment, syrup room, carbonation, RFC filler, packaging automation, utilities, and controls can represent a major multi-million-dollar capital project. Installation, building modifications, compressed air, glycol, steam or hot water, wastewater, electrical upgrades, and commissioning often add significantly to the equipment budget. Operating costs are equally important. Water use, sewer charges, CO2 consumption, sweetener handling, chemical use, labor, spare parts, maintenance, electricity, and downtime all shape cost per case. In many projects, the cheapest machine is not the lowest-cost option over five years. If poor integration causes extra labor, unstable quality, or weak sanitation, the total ownership cost rises quickly. Service capability is where project outcomes often separate. A partner that can handle capital planning, feasibility, owner representation, process engineering, installation management, controls integration, commissioning, and startup support usually reduces commercial risk. That is especially relevant for U.S. manufacturers trying to hit retailer deadlines or launch co-packing programs on fixed schedules. Disruptive Process Solutions, headquartered in Cary, North Carolina with a West Coast presence in Lake Forest, California, is positioned in this space as an engineering and integration partner rather than a simple equipment reseller. Its approach blends process design, utility planning, installation coordination, and project management around profitability and execution discipline. Manufacturers evaluating the DPS team and approach often look for this kind of end-to-end capability when the line must perform as a business asset, not just as a collection of machines. The ranges above are directional, not fixed quotes, but they help frame real budgeting discussions. U.S. buyers should request full life-cycle analysis, including maintenance, labor, utilities, and expansion costs. For companies seeking proven execution examples, reviewing recent project case studies can help clarify how engineering, phasing, and integration decisions affect long-term returns. The comparison chart demonstrates why many U.S. projects favor integrated delivery partners when schedules, utility coordination, and process reliability are critical. The strongest value often comes from reducing startup risk rather than only negotiating the lowest equipment price. From a manufacturing capability standpoint, DPS also brings in-house branded equipment in selected categories such as storage and process tanks, CIP systems, and related sanitary process solutions. That matters for buyers who want closer alignment between engineered intent and fabricated equipment details. On the technology side, its capabilities cover process, mechanical, electrical, plumbing, structural, controls, PLC programming, automation, and SCADA, which are especially relevant for water treatment, blending, carbonation, and utility integration. On the service side, the company’s model spans planning, design, installation, integration, and execution management across North America, which can be helpful for beverage clients expanding in multiple U.S. regions. What industries use soft drink processing systems?Beyond traditional soda companies, these systems are used by sparkling beverage brands, private-label bottlers, co-packers, flavored water manufacturers, kombucha or hybrid carbonated beverage producers, foodservice syrup suppliers, and diversified beverage groups serving retail, convenience, and hospitality channels. What is the best capacity for a new U.S. brand?It depends on demand certainty, package mix, and route-to-market strategy. Many early commercial brands start in the 2,000 to 8,000 BPH range or use a co-packer before investing in a dedicated line. Do all soft drink plants need reverse osmosis?No. RO is common but not universal. The need depends on source water quality, beverage taste requirements, and the desired level of dissolved solids control. Why is isobaric filling necessary?Carbonated beverages must be filled under pressure to retain CO2, reduce foam, improve fill accuracy, and protect package quality. How important is CIP automation?Very important for plants with multiple products, frequent sanitation cycles, or customer audit requirements. Automated CIP improves repeatability and records. What should buyers ask local suppliers or integrators?Ask about North American parts support, service response time, utility design experience, controls integration, commissioning scope, operator training, and real case history in carbonated beverage plants. What local factors matter in the United States?Utility rates, wastewater permits, labor availability, freight access, regional water quality, and distribution proximity all matter. Plants near Charlotte, Dallas-Fort Worth, Chicago, Los Angeles, or Savannah may have very different economic drivers. What are the main 2026 trends?More automation, stronger digital recipe control, water reuse initiatives, lower-energy utilities, higher sanitation verification, sustainable packaging compatibility, and system designs that support rapid product innovation. In summary, the best soft drink processing system for the United States market is one that aligns product strategy, plant utilities, sanitation, packaging format, and logistics into one scalable operating model. Companies that treat engineering, manufacturing, and service as connected disciplines typically build more resilient beverage operations and achieve better returns over time. -
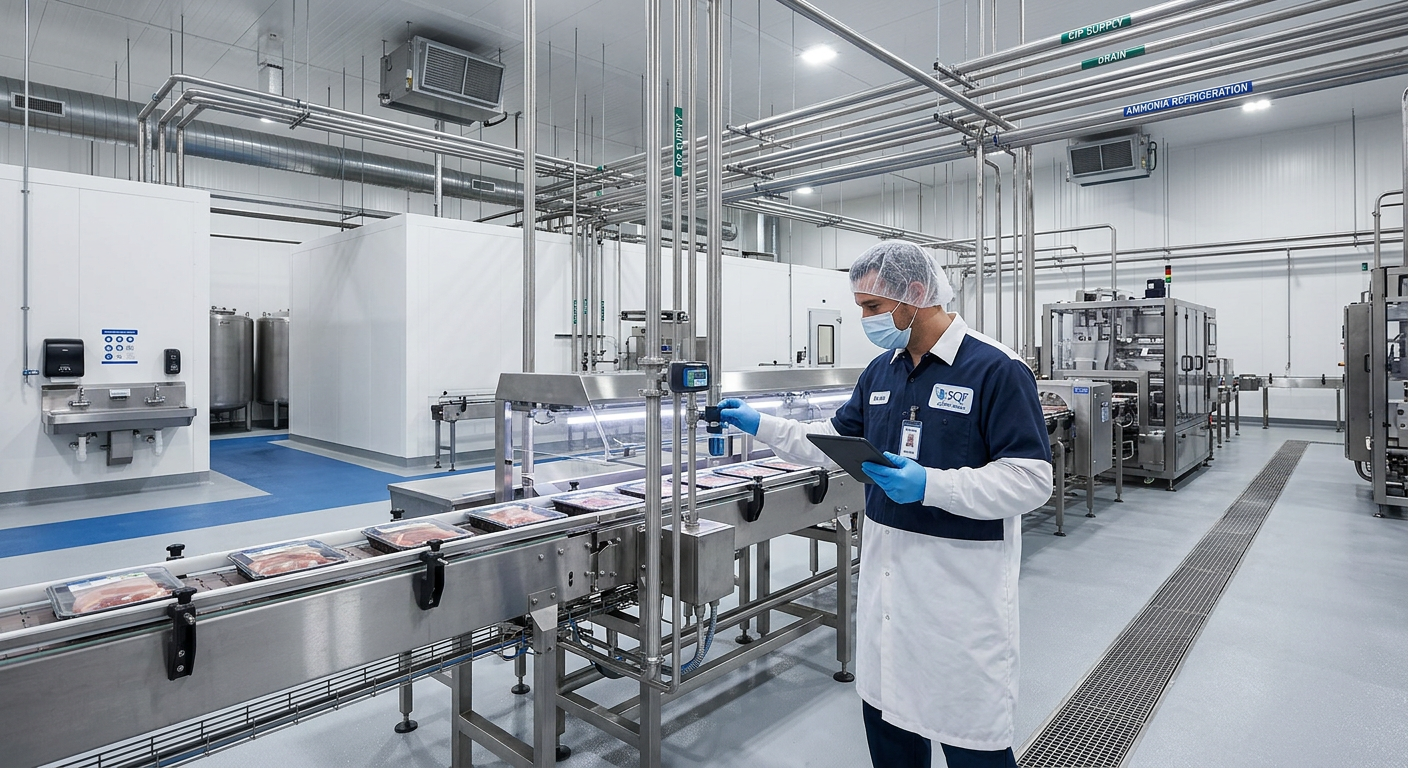
SCADA System Design for Food Facilities: ISA-95 Architecture & HMI Standards
Food manufacturers in the United States are under constant pressure to increase throughput, protect quality, reduce labor dependency, and maintain compliance across FDA, USDA, SQF, and BRC programs. In that environment, SCADA system design is no longer just a controls task. It is a plant-wide business decision that affects sanitation, traceability, downtime, utility spend, recipe consistency, and expansion readiness. A well-structured SCADA environment for food facilities should align ISA-95 functional levels with the real control hierarchy on the floor, use operator-focused ISA-101 HMI standards, embed alarm lifecycle discipline from ISA-18.2, and connect historians and MES layers through secure, maintainable standards such as OPC UA and MQTT. For U.S. processors operating in hubs like Chicago, Dallas-Fort Worth, Los Angeles, the Central Valley of California, Houston, Atlanta, Charlotte, and the I-95 distribution corridor, the right design also has to account for multi-site reporting, varied PLC estates, local utility constraints, and IT/OT security expectations. Whether the facility handles dairy, protein, beverages, aseptic filling, sauces, prepared foods, or co-packing, the SCADA platform should support fast operations today and scalable manufacturing tomorrow. The best SCADA architecture for a U.S. food plant is a layered design that clearly separates field devices, PLC control, supervisory visualization, operations management, and enterprise reporting. In practice, that means defining ISA-95 levels first, then selecting a SCADA platform that fits the existing PLC population, user count, cybersecurity posture, reporting needs, and integration roadmap. HMI design should follow ISA-101 principles so operators can see abnormal conditions quickly, while alarm handling should follow the ISA-18.2 lifecycle to reduce nuisance alarms and improve response quality. Historian, MES, and enterprise links should be built around open standards such as OPC UA and MQTT rather than brittle custom point-to-point integrations. For food and beverage sites in the United States, this approach improves batch consistency, CIP verification, downtime visibility, OEE reporting, utility optimization, and traceability from receiving through packaging. It is especially valuable for plants adding automation in phases, integrating legacy Allen-Bradley, Siemens, or Schneider PLCs, or connecting multiple production lines across regional manufacturing networks. Buying advice is straightforward: do not start with screen graphics or software brand preference. Start with process criticality, product risk, plant growth plans, and data use cases. A brewery in Portland, a protein operation in Kansas, a dairy facility in Wisconsin, and a co-packer near Savannah will all require different SCADA priorities even if they use similar PLC hardware. The table above shows why SCADA design should begin with architecture, not software cosmetics. Plants that establish these fundamentals early usually move faster through FAT, SAT, startup, and long-term support. ISA-95 gives food manufacturers a practical way to define what belongs in each layer of the control and information stack. In many U.S. plants, confusion begins when SCADA is asked to behave like a PLC, historian, MES, and ERP all at once. That creates fragile systems, long troubleshooting cycles, and unclear ownership between operations, maintenance, engineering, quality, and IT. At Level 0 and Level 1, the focus is physical process and direct sensing and actuation: valves, pumps, VFDs, temperature transmitters, flowmeters, conductivity probes, scales, barcode devices, and safety devices. Level 2 is where PLCs, PACs, and local HMI panels execute control strategies, sequencing, batch logic, interlocks, and permissives. Level 3 typically covers site operations management through SCADA, historians, quality context, work instructions, downtime tracking, recipe orchestration, and interfaces to production scheduling. Level 4 includes business planning and logistics systems such as ERP and corporate reporting. Some organizations also define Level 3.5 for DMZ and secure brokered data exchange between plant and enterprise networks. For a ready-to-drink beverage plant near Long Beach, ISA-95 may help separate syrup room control, blending, carbonation, CIP, and packaging line supervision from plant-wide production reporting. In a meat or poultry facility in Arkansas or Georgia, it can separate kill floor, cook/chill, packaging, and utility systems from traceability and scheduling functions. In a dairy plant in Wisconsin or upstate New York, it may define how pasteurization records, CIP validation, and batch genealogy move upward without pushing business logic into the control layer. This hierarchy matters because each level has different uptime expectations, validation needs, cybersecurity controls, and change management rules. A line cannot wait for an ERP response to start a pump. By the same logic, accounting should not scrape live PLC registers directly. Clear boundaries allow food plants to expand without rewriting everything. Plants planning new builds or major retrofits should document equipment classes and reusable object templates early. A consistent hierarchy across receiving, ingredient handling, batching, thermal processing, CIP, packaging, and utilities reduces commissioning time and makes training easier at every site. Platform selection should reflect the reality of the installed PLC estate. Many food plants in the United States have grown through incremental line additions, acquisitions, or OEM skids, which means one site may contain ControlLogix, CompactLogix, S7, Modicon, legacy PLC-5 migration remnants, and smart packaged systems using Modbus TCP or OPC UA. The right SCADA platform is the one that connects cleanly, scales reasonably, and remains supportable by both plant personnel and outside integrators. Selection criteria should include native connectivity, object-based engineering, redundancy options, historian compatibility, cybersecurity features, licensing model, edge deployment flexibility, remote support controls, and whether the platform supports IT standards without creating fragile dependencies. Plants linked to corporate manufacturing networks often need integration to Active Directory, backup policies, patching standards, virtual server environments, and central observability tools. Facilities near major logistics nodes such as Houston, Newark, Memphis, Kansas City, and the Inland Empire often serve time-sensitive distribution networks. For those operations, SCADA downtime translates directly to shipping risk. That means redundancy, recoverability, and clear failover behavior matter more than visual effects. A beverage co-packer scaling from one line to multiple packaging formats may prioritize template-based development and rapid line replication. A specialty sauce plant may prioritize batch genealogy and recipe approvals. A protein facility may prioritize washdown-resilient hardware, utility tracking, and robust downtime reporting. The table highlights why platform selection should be based on operational fit, not just license price. In many cases, the cheapest initial option becomes the most expensive support burden after two years of additions and patching. Food manufacturers evaluating integrators should also ask who will own the standards library, how version control will be managed, and how OEM machine data will be normalized. Strong projects also define naming conventions, network drawings, server roles, and a testing plan before any production code is released. ISA-101 helps plants design HMIs around operator decisions rather than around artistic preference. In food processing, that distinction is crucial. Operators monitoring a CIP circuit, blender, retort, tunnel pasteurizer, filler, or ammonia utility package need to spot abnormal conditions immediately. Overloaded colors, decorative 3D tanks, and dense navigation trees slow recognition and increase the chance of mistakes. An operator-centric screen hierarchy usually starts with a high-level plant overview, followed by area overviews, unit detail screens, faceplates, alarm summaries, and trend views. High-performance graphics often use neutral backgrounds with restrained color reserved for abnormal states. Key values such as temperature, flow, pressure, valve path, batch phase, hold timer, and critical permissives should be visible without hunting through multiple popups. This matters across product types. In breweries, operators may need clear fermentation, cellar, and utility visibility. In aseptic beverage systems, the HMI should highlight sterilization state, boundary integrity, product path, and diversion logic. In protein and prepared foods, line supervisors often need fast access to cook/chill status, packaging rates, metal detection, and sanitation readiness. In dairy applications, trend visibility around pasteurization and CIP is often more valuable than flashy equipment animations. The most effective HMI projects include operator workshops, navigation testing, and startup feedback loops. Plants should also define screen response expectations, alarm color standards, naming conventions, and mobile viewing policy. If tablets or remote clients are used on the floor, layouts must support real task flow rather than simply shrinking desktop screens. Many of the best U.S. retrofits achieve quick wins by redesigning the top 20 most-used screens first. That approach is often more valuable than replacing every graphic at once. Alarm management in food facilities should never be treated as a simple software feature. ISA-18.2 defines a lifecycle that starts with philosophy and continues through identification, rationalization, detailed design, implementation, operation, maintenance, monitoring, assessment, and management of change. This lifecycle is especially important in environments where nuisance alarms can hide truly critical conditions such as thermal process deviations, low flow in CIP return, tank overfill risk, refrigerant utility faults, or packaging line accumulation problems. Plants commonly suffer from alarm floods during startup, CIP transitions, utility disturbances, or communication glitches. When every event becomes an alarm, operators stop trusting the list. A disciplined program separates alarms from alerts, prompts, events, and maintenance notices. Each alarm should require a defined operator response and carry a documented consequence if ignored. Plants should track alarm KPIs such as standing alarms, alarms per operator per hour, top bad actors, flood frequency, shelved alarm duration, and repeat counts by area. These metrics help identify design issues in process control, instrumentation, equipment reliability, or operator procedures. For example, repeated line starve alarms in a packaging hall may actually signal upstream batching inconsistency rather than a packaging fault. By 2026, more U.S. plants are expected to combine alarm analytics with maintenance and quality context. That trend will improve root-cause visibility, but only if the foundational alarm philosophy is already in place. Historian and MES connectivity is where many SCADA projects either become enterprise assets or long-term headaches. OPC UA and MQTT are increasingly favored because they support more open, secure, and scalable architectures than heavily customized polling and file-based interfaces. OPC UA is particularly effective for structured industrial data models, secure session-based communication, and interoperability across equipment vendors. MQTT is useful for lightweight publish-subscribe transport, edge aggregation, and plant-to-enterprise or plant-to-cloud data distribution where decoupling and bandwidth efficiency matter. In U.S. food operations, these standards can support use cases such as batch genealogy, downtime reason collection, utility intensity tracking, OEE, SPC inputs, maintenance analytics, digital quality checks, and corporate KPI rollups across multiple sites. A company with plants in North Carolina, California, Texas, and Ontario may want standardized production tags delivered to a central reporting layer without direct access from enterprise systems into PLC networks. Good historian design also requires discipline. Not every point needs sub-second storage. Data should be collected at rates that serve actual business questions. Thermal process values, CIP conductivity, filler speeds, critical temperatures, pressures, and quality checkpoints may require different collection rates, compression rules, and retention periods. The best architecture usually combines methods rather than relying on one. For example, PLCs and skids may publish through OPC UA to a site SCADA layer, while a local historian or edge layer forwards normalized events through MQTT to a central manufacturing data platform. This allows secure segregation of duties while simplifying future expansion. Food companies evaluating modernization should make sure their data model covers lot, SKU, line, batch, shift, CIP circuit, utility asset, operator action, and alarm context. Without that contextual layer, a historian becomes a large archive with limited operational value. Technical specifications should define more than hardware lists. They should establish engineering requirements for architecture, naming, cybersecurity, performance, documentation, testing, and support. In food and beverage environments, these requirements need to reflect sanitation, washdown, utility variability, product changeovers, and audit expectations. Strong specifications reduce ambiguity between owner, OEMs, controls contractors, mechanical contractors, and IT teams. Core requirements often include network topology, VLAN and firewall rules, server roles, virtualization policy, client counts, historian retention, alarm philosophy, HMI standards, PLC coding standards, FAT and SAT scope, backup and restore testing, spare strategy, and disaster recovery expectations. Projects should also define whether formulas, recipes, setpoint approvals, and electronic records require higher change control. For facilities handling aseptic products, dairy, retort, or validated thermal processes, the specification should clearly define record integrity, time synchronization, user audit trails, and long-term retention. For beverage and co-packing sites, packaging line integration, utility metering, and OEE event models are often essential. For protein and prepared foods, environmental monitoring touchpoints, sanitation state, and chilled utility visibility may be equally important. Engineering requirements should also address local supplier and service realities. A plant in California’s Central Valley may need different support planning than a site near Raleigh, Minneapolis, or El Paso. Availability of electricians, instrumentation technicians, panel fabricators, and after-hours controls support can influence spare parts strategy and remote access design. When evaluating proposals, buyers should ask for architecture drawings, example standards documents, sample alarm philosophy outputs, and a clear list of owner responsibilities. That is often more revealing than a glossy software demo. A successful SCADA program usually follows a staged roadmap rather than a single software installation event. The most reliable sequence starts with discovery, standards definition, architecture design, pilot scope, detailed engineering, FAT, phased startup, KPI review, and governance for continuous improvement. This structure reduces operational disruption and allows plants to capture lessons before scaling across multiple lines or sites. For existing facilities, discovery should include a physical and logical audit of PLCs, networks, instruments, packaged equipment, alarm lists, recipes, historians, and reporting users. Brownfield food plants often contain hidden dependencies such as unmanaged switches, undocumented OEM passwords, unsupported operating systems, and local operator workarounds. These must be surfaced early. Pilot implementation works best in areas with clear operational payback and manageable risk, such as a utility system, a CIP area, a single packaging hall, or one batch train. After proving standards and user adoption, the model can be rolled into receiving, process, thermal, packaging, and warehousing interfaces. This is also the stage where training, MOC, and support ownership need to become formal, not informal. Project best practices include: Case studies across the United States repeatedly show that the highest ROI often comes from removing hidden bottlenecks rather than simply buying more equipment. In some facilities, better PLC and SCADA logic can unlock throughput, reduce product giveaway, or improve CIP cycle performance without major mechanical expansion. That is especially true in older food and beverage plants where process constraints are poorly visible. By 2026, implementation roadmaps will increasingly include energy management, water reuse metrics, and sustainability dashboards. With utility costs and environmental reporting rising in importance, SCADA systems will be expected to track steam, glycol, compressed air, chilled water, electricity, and wastewater intensity at the line or product-family level. Policy and customer pressure will continue to push food manufacturers toward better traceability, digital records, and resilient reporting across every region of the country. Companies comparing suppliers should also evaluate depth of process knowledge. A controls-only firm may build a functional interface, but a partner that understands fermentation, pasteurization, retort, CIP, dairy unit operations, batching, and packaging can often design a more durable solution with fewer blind spots. Practical field experience matters during startup when production realities differ from the P&ID. For more on integrated project execution and capital planning support, manufacturers can review food and beverage engineering services and see how full-scope delivery models align controls with mechanical, utility, and startup outcomes. Plants exploring broader expansion strategies can also study recent project case examples to benchmark roadmap sequencing. Disruptive Process Solutions supports food and beverage manufacturers across the United States and Canada with a project model built around planning, execution, and measurable business outcomes. Rather than treating SCADA in isolation, the company approaches automation as part of a complete processing and capital delivery strategy. DPS provides controls engineering that connects SCADA, PLC programming, recipes, utilities, and reporting into one practical manufacturing environment. Its teams work across structural, mechanical, plumbing, electrical, process, and controls disciplines, which helps align automation with actual process intent. That is particularly valuable when integrating packaging systems, CIP skids, blending operations, pasteurization assets, fermentation systems, aseptic processing, or utility infrastructure. Manufacturers looking for a partner with broad engineering context can learn more about the company. Beyond integration, DPS also designs and supplies process equipment used in food and beverage facilities, including tanks, CIP systems, cooking vessels, and other specialized process assets. That manufacturing perspective is important in SCADA projects because control strategies are stronger when the design team understands vessel behavior, utility loads, hygienic requirements, and field installation constraints. Product and equipment capabilities can be explored through the company’s process equipment portfolio. DPS operates with an end-to-end design-build-manage model that supports feasibility, capital planning, owner’s representation, general contracting functions, project engineering, installation, integration, commissioning, and startup support. For food plants, that means SCADA implementation can be coordinated with piping, electrical, utilities, and production readiness instead of being managed as a disconnected software effort. This model is particularly useful for clients launching new lines, relocating equipment, expanding capacity, or standardizing multiple plants under one operating framework. Because DPS serves both beverage and food operations across North America, the company brings experience from breweries, spirits, wine, RTD, dairy, aseptic, prepared foods, proteins, sauces, and co-packing environments. That cross-sector experience can help clients avoid applying the wrong standard from one process category to another. What is the biggest mistake food plants make in SCADA design?Starting with software brand preference or screen appearance before defining ISA-95 hierarchy, data use cases, and operator workflows. Should every food plant use ISA-95 and ISA-101?Most plants benefit from both. ISA-95 clarifies architecture and ownership, while ISA-101 improves HMI usability. The depth of implementation can scale with plant complexity. Is OPC UA better than MQTT?They solve different problems. OPC UA is excellent for structured industrial interoperability inside the OT environment. MQTT is strong for scalable distribution and edge-to-enterprise publishing. Many modern architectures use both. How do I know if I need a historian, MES, or both?A historian stores and trends time-series process data. MES adds workflow, production context, quality, genealogy, and execution functions. If you only need trending and reporting, a historian may be enough. If you need execution control and plant-level production management, MES is often justified. What industries benefit most from modern SCADA in the United States?Dairy, beverage, protein, aseptic, prepared foods, sauces, ingredients, and co-packing all benefit, especially where traceability, utility intensity, and frequent changeovers matter. How long does implementation usually take?A focused pilot can take a few months. A full brownfield multi-line standardization program can take much longer depending on OEM complexity, network readiness, and production shutdown windows. Can SCADA modernization improve sustainability?Yes. Better visibility into steam, water, glycol, compressed air, and electricity supports targeted waste reduction and 2026-ready sustainability reporting. What should buyers ask suppliers before awarding a project?Ask for examples of standards documents, architecture drawings, alarm philosophy, FAT/SAT methodology, cybersecurity approach, support model, and experience in your specific process type. -
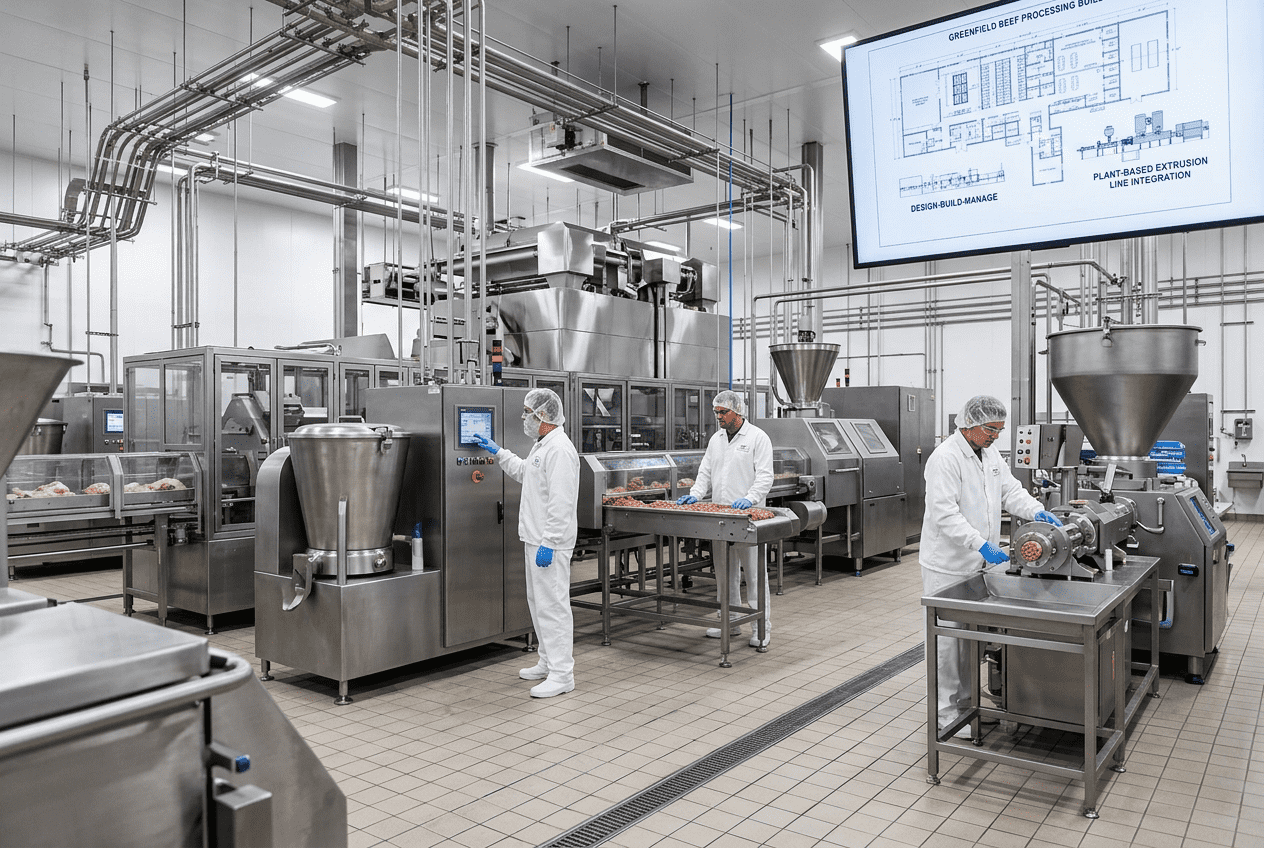
Beverage Carbonation Systems
Carbonation systems are the engineered process lines that dissolve carbon dioxide into water or finished beverages under controlled pressure and temperature conditions. In the United States, the most reliable beverage carbonation systems combine deaeration, precise CO2 dosing, pressure-stable tanks, sanitary piping, automated controls, and counter-pressure packaging to protect product quality from the carbonator to the filler. For manufacturers scaling soft drinks, sparkling water, RTDs, kombucha, beer, cider, wine spritzers, and functional beverages, system design matters just as much as gas supply. A well-built line improves carbonation consistency, protects flavor, reduces oxygen pickup, lowers CO2 loss, and supports profitable throughput. Across major U.S. beverage corridors such as Chicago, Atlanta, Dallas-Fort Worth, Los Angeles, Houston, and the I-95 distribution belt from New Jersey to Florida, producers are under pressure to increase line efficiency while meeting stricter food safety, sustainability, and cost targets. That is why many processors now evaluate carbonation as part of an integrated capital project instead of treating it as a stand-alone skid. Companies that think this way typically gain better utility planning, better automation, and fewer commissioning surprises. For manufacturers seeking a partner that understands both processing and execution, Disruptive Process Solutions approaches carbonation projects with an operations-first mindset. Rather than selling equipment in isolation, the company helps beverage manufacturers align engineering choices with production goals, packaging plans, utility capacity, and long-term return on capital. If you need a short answer, here it is: carbonation works by dissolving CO2 into liquid at low temperature and elevated pressure, then keeping that CO2 in solution through storage, transfer, and filling. The best results come from five core practices: remove dissolved oxygen before carbonation, chill the beverage, use accurate pressure and flow control, minimize agitation after carbonation, and fill under counter-pressure. In the United States market, most high-volume beverage plants favor forced carbonation because it is faster, more repeatable, and easier to automate than natural carbonation. Buying advice is straightforward. If you run a high-throughput plant in markets like California, Texas, the Carolinas, or the Midwest, select a system based on packaged product mix, target CO2 volumes, filler speed, utility availability, sanitation requirements, and operator skill level. A low-cost carbonator can become an expensive mistake if it cannot maintain pressure stability, CIP performance, or dissolved gas consistency across shifts. This is especially true for co-packers that must switch between SKUs with different carbonation targets, sweetener systems, and package types. Applications for beverage carbonation systems include sparkling water, CSDs, flavored malt beverages, ready-to-drink cocktails, beer, cider, hard seltzer, wine-based spritzers, kombucha, and select dairy-adjacent beverages with sparkling profiles. Industries that rely on these systems range from multinational bottlers to regional craft producers and fast-growing co-manufacturing facilities near logistics hubs such as the Ports of Los Angeles and Long Beach, the Port of Houston, and the Port of Savannah. The table above gives a practical framework for initial screening. Many plants focus first on the carbonator itself, but system success is usually decided by upstream water preparation and downstream packaging discipline. Carbonation is governed by gas solubility. As temperature decreases and pressure increases, more CO2 dissolves into the beverage. In practical terms, cold liquid absorbs carbon dioxide more efficiently than warm liquid, and higher contact pressure helps hold that gas in solution. This is why U.S. bottling facilities often chill water or blended product before the carbonator and maintain strict pressure control through bright tanks, surge vessels, and fillers. The process usually begins with prepared water or finished beverage entering the carbonation zone at a defined temperature. CO2 is introduced through a diffuser, injector, sintered stone, or specialized mixing device that maximizes contact area between gas and liquid. In inline systems, the beverage moves continuously through a static mixer or carbonator body. In tank-based systems, the liquid may circulate inside a saturation vessel until the target dissolved CO2 value is reached. Sensors and control valves adjust flow, gas pressure, and backpressure so the output remains stable. Temperature is critical. A beverage at 34°F to 38°F generally carbonates more efficiently than one at 45°F or higher. Pressure must also remain stable; sudden pressure drops release CO2 as foam, reducing specification accuracy and increasing product waste. This is why well-designed systems include pressure regulators, hygienic valves, instrumentation, and often PLC-based interlocks. From a technological capabilities perspective, DPS supports process engineering that connects carbonation with upstream blending, chilling, utilities, PLC programming, and SCADA visibility. That matters because carbonation performance depends on more than one skid. It depends on how pumps, tanks, control logic, heat exchangers, fillers, and CIP routines function together under real production conditions. This table shows why carbonation is a system science rather than a single machine setting. Plants that ignore one variable usually pay for it somewhere else, often through foaming, under-carbonation, or rework. The line chart reflects the continued rise in U.S. demand for carbonation-related equipment as sparkling waters, functional beverages, canned cocktails, and flexible co-packing continue to expand through 2026 and beyond. Forced carbonation and natural carbonation both create bubbles, but they do so in different ways. Forced carbonation injects CO2 directly into chilled liquid under pressure. Natural carbonation produces CO2 through fermentation, allowing the gas to dissolve into the product over time. In the United States, forced carbonation dominates commercial soft drinks, sparkling waters, most RTDs, and many large-scale beer and seltzer operations because it offers speed, predictability, and easier integration with automated filling lines. Natural carbonation still has an important place in craft brewing, bottle-conditioned beer, certain ciders, kombucha, and specialty fermented beverages. It can create a distinct mouthfeel and artisanal positioning, but it requires tight fermentation control and often more aging time. It also creates greater batch-to-batch variability if yeast health, sugar content, temperature, or package conditioning are not tightly managed. For buying decisions, forced carbonation usually makes sense when you need high throughput, rapid SKU changes, exact target volumes, and broad package compatibility. Natural carbonation may be appropriate where sensory differentiation and traditional processing are central to the brand. Hybrid strategies are also common, especially in breweries that ferment naturally and then fine-tune final package CO2 levels before filling. The comparison shows why U.S. plants expanding into co-packing, especially in Texas and the Southeast, often choose forced carbonation. It provides the control needed for contract manufacturing environments where product specifications can shift daily. A complete carbonation line is rarely just one machine. It is a coordinated set of components that condition the beverage, add gas, stabilize the product, and deliver it to packaging. Core equipment typically includes a deaeration system, chillers or heat exchangers, carbonator skid, saturation or bright tank, sanitary pumps, control valves, instrumentation, and counter-pressure filler interfaces. Depending on the application, plants may also use inline Brix monitoring, blending systems, pasteurization support, or aseptic integration. Inline carbonators are widely used for high-volume beverage production because they are compact and responsive. Saturation tanks provide added residence time and can be beneficial where extra stabilization is needed. CO2 injection systems must be designed for food-grade gas handling, cleanability, and precise control, especially in products sensitive to foam and oxygen pickup. On the manufacturing side, DPS supports custom process equipment and integrated tank solutions that fit broader beverage infrastructure. That can include storage and processing tanks, utility tie-ins, CIP compatibility, and packaging line connections, which is valuable when a client is building out a new room or expanding an operating facility without compromising throughput. The equipment list above should be evaluated as a process train. Plants often see the highest payback when they upgrade not just the carbonator, but the control architecture and packaging interface around it. Carbonation consistency depends on managing several variables at once. The most important are beverage temperature, line pressure, product composition, CO2 purity, residence time, pump behavior, and filling conditions. Sugar, alcohol, acids, flavor extracts, and suspended solids can all influence how a beverage takes on and retains carbonation. Products like energy drinks and RTD cocktails may behave differently than plain sparkling water, even if the target CO2 volume appears similar. Operators should monitor both process conditions and actual dissolved CO2 values. Inline sensors, calibrated gauges, and regular lab verification all matter. Consistency is especially important for co-packers serving national retail programs, where every pallet shipped from facilities in North Carolina, California, or Illinois must match the same sensory profile. Service capability also matters. DPS works across engineering, installation, integration, commissioning, and project oversight, which helps manufacturers reduce gaps between design intent and plant reality. For carbonation systems, this translates into better startup planning, utility checks, controls validation, and operator readiness before production targets go live. This table is useful during troubleshooting. When carbonated beverages drift out of specification, the root cause is often found in a combination of temperature movement, control instability, and packaging line mismatch rather than in the gas source alone. The bar chart reflects strong U.S. demand across established and emerging categories, with sparkling water, CSDs, and hard seltzer continuing to support capital investment in carbonation infrastructure. Deaeration is one of the most overlooked steps in beverage carbonation. Dissolved oxygen in water can impair flavor stability, reduce carbonation efficiency, and increase oxidation risk in sensitive beverages such as beer, flavored water, and functional drinks with botanical ingredients. A deaeration system removes oxygen and other dissolved gases before carbonation, creating a cleaner base for CO2 absorption. In practical terms, deaeration improves both product quality and process economics. Water with low dissolved oxygen accepts carbon dioxide more predictably and supports longer flavor shelf life. Many U.S. beverage producers near humid coastal environments or large municipal water systems, including plants around New Orleans, Tampa, and Newark, pay close attention to water preparation because source water variability can be significant. Common deaeration methods include vacuum deaeration, membrane-based systems, and thermal support in broader water treatment trains. The best choice depends on throughput, water chemistry, product sensitivity, and utility economics. Deaeration should also be considered alongside filtration, RO, disinfection, and mineral adjustment where those are part of the process design. Manufacturers planning new facilities can benefit from a full systems view. In carbonation applications, water treatment, blending, process piping, controls, and sanitation are tightly connected. For this reason, many beverage projects combine carbonation planning with broader utility and process scope rather than buying piecemeal hardware. Even a perfectly carbonated beverage can lose quality at the filler if pressure control is poor. Counter-pressure filling solves this by pressurizing the package before liquid enters, reducing the pressure differential that would otherwise force dissolved CO2 out of solution. This method is standard for carbonated cans, glass bottles, PET packages, and kegs. The goal is simple: maintain enough pressure stability that the beverage flows into the package without violent foaming or gas release. Accurate fill valves, good bowl pressure control, proper package purging, low turbulence transfer, and synchronized capper or seamer timing are all essential. If the filler is too warm, the bowl pressure unstable, or the package handling rough, carbonation losses increase quickly. This is especially important for U.S. co-packers running multiple package formats. A line serving 12-ounce sleek cans in the morning and PET bottles in the afternoon must adapt filling parameters without sacrificing package integrity or dissolved CO2 retention. Plants with better automation and recipe management typically achieve this more reliably. Counter-pressure performance is also where packaging engineering meets process engineering. DPS often supports this broader integration mindset by coordinating utilities, process equipment, controls, installation, and commissioning across a complete project. For beverage plants, that can mean fewer disconnects between tank pressure capability, piping design, filler settings, and startup performance. The area chart highlights a major trend through 2026: more U.S. projects are combining carbonation with automation, data visibility, and gas recovery features rather than installing basic stand-alone systems. CO2 recovery systems are attracting more attention as beverage producers try to reduce operating costs and improve sustainability metrics. These systems capture carbon dioxide from suitable process sources, purify it, compress it, and reuse it where allowed by design and quality requirements. In breweries and fermentation-driven plants, recovery can significantly reduce purchased gas dependence when properly engineered and validated. The financial case depends on plant scale, source consistency, gas demand, purification cost, and regional supply volatility. U.S. producers remember recent periods of CO2 tightness that affected production planning across the country. Facilities located farther from major gas distribution routes, or those with high freight exposure, may see additional value in recovery and storage strategies. Beyond cost reduction, recovery supports ESG and corporate sustainability goals. By 2026, more capital projects are expected to include lifecycle energy review, water stewardship metrics, and greenhouse gas reporting. Beverage manufacturers supplying national retailers increasingly face customer pressure to document responsible operations, and carbon dioxide management is part of that conversation. Recovery is not right for every plant, but it should be evaluated in feasibility studies for breweries, large kombucha operations, and fermentation-based beverage campuses. When paired with process controls and storage planning, it can strengthen business resilience. Not all carbon dioxide supply is equal. Beverage plants must use food-grade CO2 that meets purity requirements and is backed by supplier documentation, traceability, and quality controls. Verification should include certificates of analysis, impurity limits, moisture expectations where relevant, source information, and transport practices. Plants should also confirm how suppliers handle contamination prevention in tanks, trailers, and transfer connections. In the United States, procurement teams often evaluate both national gas suppliers and regional partners depending on geography and volume. Plants near major industrial hubs like Houston, Chicago, and Southern California may have more options, while remote sites may need stronger contingency planning. Dual-sourcing, bulk storage review, and emergency gas coverage are increasingly common risk-management steps. Verification should not stop with paperwork. Incoming gas systems, pressure regulators, tank conditions, connection sanitation, and internal QA release practices all play a role. Food safety frameworks such as SQF and BRC expectations make supplier approval and documentation discipline particularly important. The table above is a practical supplier checklist. It is especially useful for new plants, co-packers onboarding national customers, and processors upgrading from packaged gas to bulk systems. The comparison chart shows why many new U.S. projects prefer hybrid or recovery-integrated solutions when volume, flexibility, and long-term operating cost are all part of the business case. Carbonation systems are used for sparkling water, carbonated soft drinks, beer, cider, hard seltzer, kombucha, ready-to-drink cocktails, wine spritzers, and some functional beverages. Product formulation affects system design, so one setup is not ideal for every category. A carbonator is the device or skid where CO2 is introduced and dissolved into the liquid. A saturation tank is a pressure-rated vessel that gives the beverage more contact time and stabilization. Some systems rely mainly on inline carbonation, while others use both. Cold liquid dissolves carbon dioxide more efficiently. Lower temperatures increase CO2 solubility, reduce gas loss, and help maintain stable carbonation through transfer and filling. Plants measure carbonation using dissolved CO2 analyzers, package testing devices, and laboratory verification. Results may be expressed as volumes of CO2 or grams per liter depending on the beverage and quality program. Deaeration removes dissolved oxygen and other gases from water, improving carbonation efficiency and reducing oxidation risk. It is especially important for flavor-sensitive beverages and products with longer shelf-life expectations. Common causes include warm product temperature, unstable pressure, inaccurate flow control, recipe changes, poor filler settings, and gas quality issues. Troubleshooting should include both process and packaging conditions. For most carbonated beverages, yes. Counter-pressure filling helps preserve dissolved CO2 and reduces foam during packaging. Without it, carbonation losses and fill variability increase significantly. Yes, many breweries and fermentation-based beverage plants can recover and purify CO2 when volume and economics justify the investment. The system must be properly designed, validated, and maintained for beverage use. Ask for food-grade purity documentation, impurity data, traceability records, transport sanitation procedures, emergency supply plans, and service coverage in your region. This is especially important in areas with seasonal or logistical supply constraints. Look for a partner that understands beverage processing, utilities, automation, sanitary design, and plant execution. Strong integrators can connect carbonation to blending, water treatment, filling, CIP, and long-term throughput planning. If you are evaluating broader project support, review DPS capabilities in engineering and integration services, explore available process equipment solutions, and see how projects are applied in real settings through these case examples. The U.S. market for carbonated beverages continues to reward manufacturers that can balance speed, quality, and flexibility. This is especially true in regions with high co-packing growth, such as the Southeast, Texas, Southern California, and parts of the Midwest. Retail and foodservice customers increasingly expect quick new-product launches, stronger lot traceability, and sustainability reporting. As a result, carbonation projects are now frequently tied to broader modernization efforts that include automation upgrades, utility optimization, and layout redesign. For local supplier strategy, manufacturers should consider logistics and service response times in addition to equipment price. A plant near Charlotte or Raleigh may have different service partner options than one in inland Arizona or the Pacific Northwest. For bulk CO2, proximity to transport corridors and backup sourcing can affect plant resilience. For equipment, spare parts availability and field service coverage matter just as much as initial capital cost. Case experience also matters. The most successful projects usually start with a realistic front-end review of throughput, utility capacity, and product roadmap. That means asking whether the planned system can handle future demand, new package formats, additional SKUs, and compliance expectations through 2026 and beyond. In many situations, spending more upfront on integration, controls, and sanitary design creates a lower total cost of ownership over the life of the line. This final table turns strategy into action. It is particularly useful for plant managers, operations leaders, and procurement teams building a business case for a new beverage carbonation system in the United States. In summary, the best beverage carbonation systems are not just about adding bubbles. They are about designing a stable, sanitary, scalable process that links water preparation, CO2 management, temperature control, automation, and packaging performance into one profitable operating model. For U.S. beverage manufacturers navigating expansion, co-packing growth, or facility modernization, that integrated approach is increasingly the difference between acceptable production and standout operational performance. -
Food Plant Visitor Center Design: Observation Decks and Facility Tour Planning
Food plant visitor centers can create trust, strengthen brand value, support customer education, and make plant operations easier to understand without compromising food safety. In the United States, the best facilities separate public circulation from production, use enclosed observation decks, control sound and odor, establish clear PPE rules, and build a guided story that moves guests from ingredients to finished goods. A successful project is not only an architectural feature; it is also a regulated operational system that must align with FDA, USDA, SQF, BRC, local building codes, insurance requirements, and day-to-day production realities. Manufacturers across the United States are increasingly investing in guided factory experiences for customers, retailers, investors, schools, recruiting groups, and community stakeholders. This is especially relevant in major food and beverage corridors such as Chicago, Dallas-Fort Worth, Los Angeles, Fresno, Omaha, Atlanta, Charlotte, Nashville, Milwaukee, and the Northeast distribution belt linking New Jersey ports with Mid-Atlantic processing and warehousing hubs. Whether the facility handles dairy, protein, beverages, aseptic products, sauces, prepared foods, or co-packing operations, visitor center design must begin with one question: how do you let people see the story without exposing them to the process? The quickest and most practical answer is this: design the visitor center as a separate controlled environment with a dedicated entrance, isolated HVAC strategy, protected glazing at key process points, limited crossover to hygiene zones, and a scripted route that explains each production stage in the right order. In most United States food plants, visitors should not walk directly on the processing floor unless the business case truly requires it and the sanitation, gowning, and biosecurity procedures can support it. For many facilities, an elevated observation deck or enclosed viewing gallery delivers the best balance of safety, compliance, operational continuity, and customer experience. For buying teams, the decision usually comes down to three models: This comparison shows why enclosed viewing solutions dominate in regulated food environments. They reduce sanitation disruption, preserve uptime, and help plants host frequent tours without resetting production conditions after every group. From a market perspective, public-facing plant environments are expanding because U.S. brands are under pressure to show quality, traceability, and modern automation. Visitor centers are now used not just for tourism, but also for B2B sales meetings, distributor onboarding, talent recruitment, community relations, and investor confidence building. The growth trend above reflects rising demand for transparent manufacturing experiences, especially among premium food, beverage, dairy, and co-packing brands that want their facilities to function as both production assets and trust-building platforms. Observation decks and viewing galleries are the core architectural devices used to create a safe factory tour. In the United States, these systems must satisfy structural codes, fire egress requirements, ADA accessibility, sightline design, and food plant hygiene logic all at once. A good viewing gallery is not simply a window in a wall; it is a controlled environment that filters what visitors experience and prevents what operations cannot tolerate. For product types such as dairy beverages, sauces, ready meals, protein processing, craft beverages, and aseptic filling, the ideal gallery location is typically adjacent to the highest-value visual moments: ingredient handling, blending, cooking, filling, labeling, palletizing, and automated warehousing. Each stop should help viewers understand process progression, not just observe random equipment. Key design principles include: For tall process halls, especially in brewing, distillation, beverage batching, and bottling, an observation deck can create a dramatic and educational effect. For high-care food operations such as ready-to-eat protein, cultured dairy, aseptic packaging, and allergen-sensitive products, a sealed viewing gallery is usually superior because it preserves stricter environmental separation. This table highlights the difference between “seeing equipment” and “designing an experience.” The most effective visitor centers convert technical operations into a sequence that non-technical guests can absorb in real time. When selecting local suppliers or design partners, buyers in the United States should look for teams familiar with both industrial construction and food compliance. A conventional museum designer may create a compelling experience but miss sanitation and process realities. A conventional industrial contractor may protect compliance but miss storytelling value. The best outcome comes from combining process engineering, architecture, construction management, and exhibit planning from the start. A factory tour should tell the plant’s story in the same order the plant creates value. In most food and beverage environments, that means starting with raw materials or ingredient sourcing, moving through preparation and transformation, then showing filling or packaging, quality controls, logistics, and finished product use. This sounds simple, but many visitor routes fail because they are planned around spare hallways rather than narrative logic. In the United States market, audiences often include a mix of technical and non-technical visitors: retail buyers from Bentonville, distributors from Chicago, investors from New York, school groups from local districts, and community officials from surrounding municipalities. The route must serve all of them without overwhelming them. A practical storytelling sequence often follows this order: Plants near major transport corridors such as the Port of Los Angeles, Port of Savannah, Houston, the I-80 corridor, or the Midwest rail network often benefit from including logistics storytelling. Visitors increasingly want to understand not only how a product is made, but also how it reaches shelves, foodservice operators, and export channels. The bar chart shows where demand is strongest. Beverage, dairy, and co-packing facilities frequently pursue visitor infrastructure because they often host brand partners, auditors, customers, and strategic stakeholders who benefit from a polished, safe viewing environment. Buying advice: if your plant has multiple product families, do not try to show every process in one tour. Instead, identify three to five visual anchor points that best explain your operation. For example, a sauce facility may focus on batching, thermal processing, filling, and finished pack integrity. A protein plant may focus on controlled handling, portioning, packaging, and cold-chain integrity, while avoiding highly sensitive slaughter or raw exposure zones. Glass viewing ports are one of the most visible details in a food plant visitor center, but they must perform far beyond aesthetics. The glazing system must support hygiene boundaries, impact resistance, cleaning durability, condensation control, and safe visibility. In louder facilities, it should also contribute to acoustic separation. Plants with steam, washdown, refrigeration, or thermal variation need to choose glazing assemblies that can handle both environmental stress and cleaning protocols. Typical United States solutions include insulated laminated safety glass, fire-rated glass where code requires it, anti-fog coatings in high-humidity areas, and sloped sill or frame details that reduce dust and water accumulation. In washdown areas, stainless steel framing and sealed joints are usually preferred over decorative finishes that degrade over time. This comparison matters because poor glazing choices often create constant complaints: fogging, glare, scratching, sound bleed, or cleaning failures that make the gallery feel low quality after only a short period of use. Noise control should be treated as a system, not a single product decision. If guests are viewing depalletizers, fillers, cappers, conveyors, blow molders, grinders, or compressors, the space can become unintelligible without layered acoustic control. Use some combination of acoustic glass, insulated wall assemblies, sound-absorbing ceiling materials, vestibules, directional speakers, and headset-based audio for large tours. In beverage and packaging halls where decibel levels fluctuate sharply, audio guides can dramatically improve the visitor experience without adding loud public address systems. For future 2026 trends, expect more facilities to pair viewing windows with live production data overlays. Instead of seeing only a filler run, visitors may also view sanitized dashboards showing line speed, fill accuracy, downtime trends, water savings, or energy intensity. This is especially effective for brands that want to communicate smart manufacturing and sustainability at the same time. One of the biggest design decisions is where visitors enter and how far that path remains independent from employee and material flows. In a well-planned United States food plant, the public entrance should feel welcoming while remaining operationally detached from receiving docks, forklift traffic, employee locker access, and controlled processing transitions. The safest baseline strategy is a dedicated visitor entrance leading into a reception and orientation zone, then into the gallery route. This can share a building envelope with the main plant, but it should not share the same circulation logic. Separate entries reduce accidental breaches, make check-in easier, and support after-hours meetings even when production access is restricted. Separation should also include air, sanitation, and traffic logic: In urban and suburban industrial parks around places like Cary, Charlotte, Irvine, Dallas, or Minneapolis, manufacturers often retrofit existing plants that were never designed for tours. In those cases, a side-car visitor center addition or repurposed front-office wing is often more practical than trying to carve public circulation through active production support spaces. The trend shows how the industry is moving away from casual floor access and toward separated circulation models. This is driven by stricter quality expectations, audit readiness, insurance pressures, and the need to protect line uptime. When considering case-study logic, many of the best retrofit projects start by mapping all flows on one diagram: ingredients, packaging, waste, employees, maintenance, forklifts, and visitors. The point is not only to avoid contamination risk but also to prevent operational friction. Even one poorly located public door can create repeated security and sanitation issues. Tour safety protocols must be written before the space is built. PPE, conduct rules, capacity, escort ratios, emergency procedures, prohibited items, and photography policy all affect design choices. If the visitor center supports schools, public tours, customers, or overseas delegations, your SOPs must define different access levels. A retailer audit group and a middle-school field trip should not automatically receive the same route or permissions. In most United States plants, common baseline requirements include hair restraints, beard covers where applicable, closed-toe shoes, no jewelry in controlled areas, hand sanitation, sign-in, and escort control. If visitors never leave the enclosed gallery, PPE can often be lighter. If they cross into packaging halls or support spaces, requirements increase quickly. This table shows why many manufacturers choose a gallery-first model. It dramatically reduces PPE complexity, tour prep time, and the risk of introducing visitors into unstable environments. For 2026, policy trends will likely push stronger digital accountability in tours: pre-registered waivers, visitor category scoring, touchless check-in, temporary badge tracing, and tighter photo restrictions in plants producing private-label goods or proprietary formulas. Sustainability will also influence PPE planning, with more plants moving from disposable-only visitor materials to validated reusable systems where feasible and compliant. A visitor center should not stop at the viewing window. It should translate production into commercial meaning. This is where branding and product showcase integration become critical. After visitors see process, they should immediately understand what makes the brand distinct: taste, consistency, safety, speed to market, ingredient integrity, innovation, or scale. For consumer-facing brands, the showcase area can include tasting counters, package evolution walls, sustainability metrics, ingredient maps, merchandising displays, or seasonal launch stations. For B2B and co-manufacturing businesses, the focus may shift to capabilities: line formats, batch flexibility, certifications, thermal processing methods, clean utilities, and packaging options. In the United States, especially in competitive retail and foodservice markets, the visitor center increasingly supports sales. A private-label prospect touring a plant in California, Texas, Wisconsin, or North Carolina wants proof that the operator can scale reliably and protect quality. A well-designed showcase area can bridge that gap between operations and commercial confidence. Effective integration methods include: For manufacturers with broad process portfolios, this area is also the right place to explain capabilities visitors cannot safely see in person. That may include aseptic systems, retort lines, CIP architecture, automation platforms, water treatment, or utility redundancy. The comparison chart makes a common U.S. design conclusion clear: direct floor tours may feel more immersive, but observation galleries usually outperform them on safety protection, scalability, and throughput, which matters for plants that host frequent visitors. Implementation works best when visitor-center planning is integrated into plant engineering from the beginning. If the viewing route is treated as a late architectural add-on, it often creates poor sightlines, expensive structural changes, awkward door sequencing, or code conflicts. A design-build approach helps align process, structure, MEP systems, controls, compliance, schedule, and cost in one execution path. In practice, implementation usually follows six stages: feasibility, concept route planning, compliance review, detailed engineering, construction and integration, then SOP commissioning. For existing plants, laser scanning, utility verification, and production scheduling constraints are also critical before work begins. This framework is especially useful for facilities balancing expansion and public-facing improvements at the same time. It also helps procurement teams compare suppliers fairly by aligning everyone to the same implementation logic rather than only the lowest bid. For companies evaluating partners, strong selection criteria include: proven food or beverage engineering experience, code coordination skill, familiarity with hygiene zoning, ability to sequence work around live production, and enough storytelling fluency to translate equipment into a visitor experience. A partner that can engineer utilities and line integration while coordinating construction often shortens schedule risk substantially. Manufacturers looking for integrated support can review food and beverage project services that connect planning, engineering, construction management, and startup rather than splitting those responsibilities across disconnected firms. Disruptive Process Solutions supports food and beverage manufacturers across the United States and Canada with a practical, profit-driven approach to capital projects. Rather than treating a visitor center as an isolated architectural feature, the company approaches it as part of the operating system of the plant: one that must work with process flow, compliance, utilities, structural realities, production uptime, and the commercial goals of the owner. On the technological side, DPS brings engineering depth across process, mechanical, structural, plumbing, electrical, and controls disciplines. That matters when a visitor center must be coordinated with live processing areas, SCADA visibility, utility routing, CIP awareness, temperature-controlled spaces, or automation storytelling. Facilities handling brewing, distillation, carbonation, aseptic processing, pasteurization, retort, blending, dairy, prepared foods, or protein operations all require different viewing and isolation strategies, and those differences are easier to solve when the engineering team understands the process itself. Companies exploring an integrated capital partner can learn more about the DPS team and approach. On the manufacturing side, DPS also understands how equipment reality affects visitor design. A viewing gallery around tanks, cook systems, CIP skids, fillers, marination equipment, processing vessels, or custom stainless assets must account for maintenance clearances, sanitation access, service platforms, and operator movement. Because DPS also works with its own equipment offerings and broad integration scopes, it can help align display visibility with real production functionality instead of forcing cosmetic solutions that interfere with operations. Additional details on process assets and integrated equipment can be found in the company’s equipment capabilities overview. On the service side, DPS operates through a design-build-manage philosophy intended to reduce gaps between concept and execution. That means capital planning, feasibility support, owner’s representation, project management, general contracting coordination where applicable, installation oversight, and system integration can all be aligned toward one business goal: a facility that works profitably after handover. This is especially valuable for visitor-center projects because they sit at the intersection of operations, compliance, construction, and brand presentation. For examples of applied project thinking across industrial environments, visitors can explore selected project case examples. For U.S. manufacturers, this kind of integrated thinking is increasingly important. A viewing gallery is easy to draw. A viewing gallery that maintains food safety, protects uptime, supports tours, and still makes the brand stronger is a different level of project entirely. 1. Is an observation deck better than direct plant access?In most United States food and beverage facilities, yes. Observation decks and enclosed viewing galleries usually provide the best balance of safety, compliance, operating continuity, and visitor experience. 2. Can visitors ever go onto the processing floor?Yes, but only where the sanitation model, PPE protocol, traffic separation, and operational risk allow it. Many plants restrict floor access to packaging edges or non-critical support spaces rather than open product zones. 3. What industries benefit most from visitor centers?Beverage, dairy, prepared foods, sauces, co-packing, and selected protein operations often gain the most. The value is especially strong where customer confidence, retailer relationships, or community trust matter. 4. What is the biggest design mistake?Treating the tour route like leftover corridor space. The route should follow process storytelling, not building leftovers. Poor route logic leads to weak visitor comprehension and stronger operational friction. 5. How much should branding be integrated?A lot, but it should be grounded in operational truth. The strongest showcase areas connect visible plant systems to actual product performance, quality, safety, and scale claims. 6. What kind of glass should be used?It depends on humidity, acoustics, impact requirements, and code conditions. Laminated safety glass, insulated units, and acoustic laminated glazing are common solutions in U.S. food facilities. 7. Do visitor centers require separate HVAC and entrances?In many cases, yes. Separate entrances are strongly recommended, and HVAC separation is often necessary to maintain comfort, pressure logic, odor control, and hygiene boundaries. 8. How do tours affect audits and food safety programs?If planned correctly, they should not disrupt them. The facility should document visitor SOPs, access levels, PPE rules, sanitation controls, and photography policy as part of standard operating governance. 9. Are retrofits feasible in older U.S. plants?Yes, especially in front-office wings, side additions, mezzanine routes, and sealed corridors. The key is to map all process, people, and material flows before committing to design. 10. What trends will matter most in 2026?More digital visitor check-in, stronger access control, sustainability messaging tied to measurable plant data, higher acoustic expectations, and more use of real-time dashboards to explain production performance. For food and beverage manufacturers in the United States, the smartest visitor center is one that respects the plant first and impresses the guest second. When those two goals are engineered together, observation decks, galleries, and guided routes become powerful business assets rather than operational liabilities. -
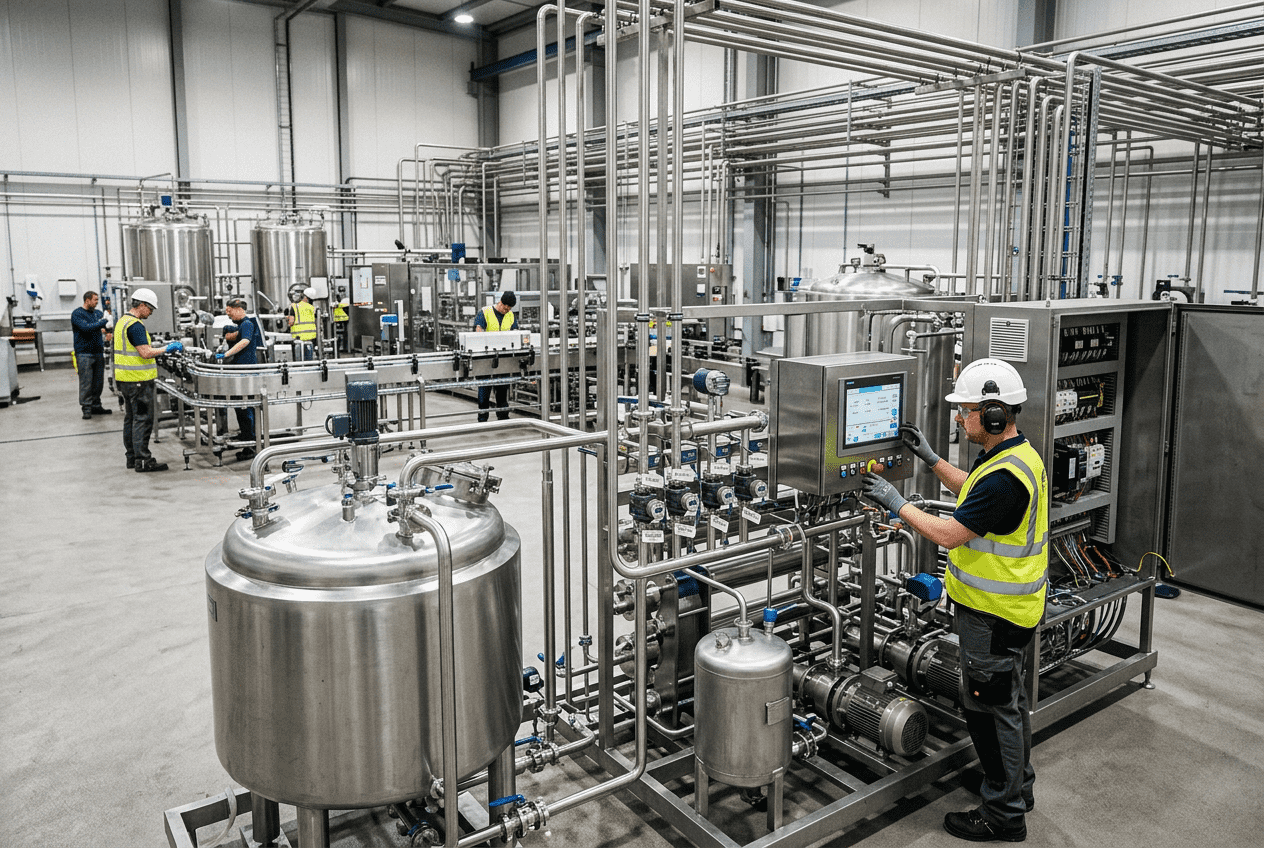
2026 Food Plant Maintenance Shop Design for Operational Efficiency
Designing a maintenance shop for a food or beverage plant is not a side project. It directly affects uptime, sanitation, labor efficiency, spare parts control, safety, audit readiness, and long-term operating cost. In the United States, where processors face labor shortages, aggressive production targets, and stricter expectations around food safety documentation, the maintenance shop has become a strategic asset rather than a back-room necessity. A poorly planned shop creates wasted motion, delayed repairs, contamination risk, and expensive emergency outsourcing. A well-planned shop reduces downtime, improves wrench time, protects product areas, and supports a stronger preventive maintenance culture. This guide explains how to plan a food plant maintenance shop for operational efficiency in 2026, with practical advice on location, size, workbench layout, parts inventory, fabrication areas, crane access, and digital integration. It also reflects the realities of U.S. manufacturing hubs such as Chicago, Dallas-Fort Worth, Fresno, Houston, Charlotte, Indianapolis, and the port-driven distribution corridors around Los Angeles/Long Beach and Savannah, where facilities often balance speed, compliance, and capital discipline at the same time. The best maintenance shop design for a U.S. food plant places the shop close enough to production for rapid response, but physically separated enough to prevent cross-contamination, noise transfer, and uncontrolled traffic. The shop should include clearly zoned areas for diagnostics, clean repairs, welding and fabrication, parts storage, kitting, staging, and heavy equipment movement. It should also connect to the plant’s CMMS so technicians can receive work orders, reserve parts, track labor, and document preventive maintenance without leaving the workspace. As a rule of thumb, efficient shops are built around five priorities: For many plants, the right maintenance shop is not the biggest one. It is the one that shortens response time, supports planned maintenance, reduces search time, and allows maintenance leadership to manage labor and spares with discipline. In protein processing, dairy, beverages, prepared foods, aseptic packaging, and co-packing operations, that often means separating sanitary rebuild work from fabrication work and designing the space around the plant’s actual failure modes. Buying advice for U.S. processors is straightforward: do not copy a generic industrial shop layout from a warehouse or machine shop. Food and beverage environments demand different zoning, washdown considerations, documentation standards, and traffic controls. A maintenance shop that works in a dry consumer goods factory may fail an audit or create sanitation risk in a USDA-inspected meat facility or a high-care dairy operation. The line chart above reflects the broader market direction: U.S. food and beverage manufacturers are steadily investing in maintenance modernization, especially where production lines are capital-intensive and downtime is measured in thousands of dollars per hour. Plants near large distribution and import corridors, including Houston, New Jersey, Southern California, and Georgia, are under particular pressure to keep throughput reliable because downstream logistics schedules leave little room for missed production windows. Location and size planning should begin with asset criticality, not empty floor area. The shop must support the equipment that fails most often, costs the most when down, and requires the most frequent planned intervention. In a beverage plant, that may mean fillers, blow molders, pasteurizers, labelers, and utility skids. In a protein plant, it may mean grinders, slicers, smokehouses, chill systems, packaging lines, and sanitation-critical conveyors. In dairy and aseptic facilities, pumps, valves, homogenizers, HTST systems, and CIP components may drive the layout. The maintenance shop should ideally sit on a circulation path that allows fast access to production lines, utility rooms, and spare parts receiving, while minimizing direct crossover into finished goods or high-hygiene spaces. In older U.S. plants, especially in legacy industrial markets like Milwaukee, St. Louis, or Philadelphia, maintenance shops are often placed wherever space was left over. In new facilities or major retrofits, the better approach is to treat the shop as a planned operating node tied to maintenance routes, not as a leftover room. The table shows that sizing should vary by process profile, hygiene risk, and downtime cost. The highest-value planning step is often a failure and workflow map: identify where technicians spend time, how far they travel, what parts are staged poorly, and which jobs require external lifting or fabrication support. That map will tell you more than generic square-foot benchmarks. For many U.S. plants, a practical location plan also includes access to receiving and shipping. If a site regularly brings in motors, reducers, stainless assemblies, or OEM service parts from regional hubs such as Chicago, Atlanta, Dallas, or the Inland Empire, the shop should support efficient inbound inspection and staging. Plants with frequent shutdown work may benefit from a secondary laydown zone near an exterior service door so contractors can unload materials without entering sensitive production corridors. When planning size, divide the shop into at least six zones: technician benches, clean rebuild area, dirty teardown area, fabrication/welding area, parts room, and staging/receiving. If the plant handles large pumps, heat exchangers, gearboxes, or vessel components, add a lifting and heavy repair bay. If the facility has multiple hygienic standards, such as raw and ready-to-eat operations, include separate containment and cleaning procedures for components moving back into higher-risk areas. Tool storage should reduce search time, improve accountability, and support repeatable repairs. The most effective food plant maintenance shops use a combination of shadow boards, lockable specialty cabinets, mobile carts, technician-specific kits, and digital check-out systems for higher-value tools. Workbench configuration should align with job type: electrical diagnostics, sanitary component rebuilds, precision mechanical assembly, and general repair should not all share the same surface and storage logic. In U.S. plants where labor efficiency is under constant pressure, the difference between a good and bad tool system is often measured in minutes per work order. Over a year, that becomes hundreds of labor hours. Organized shops also support training, especially for newer technicians who may not yet know the tribal habits of the department. The best workbench configuration usually separates four functions. First, a heavy bench for torqueing, mechanical disassembly, and vise work. Second, a clean stainless or coated bench for sanitary rebuilds and food-contact components. Third, an electrical bench with anti-static protection, testing power, and clear wire management. Fourth, a kitting or staging bench where jobs are prepared before technicians head to the line. Plants in humid or washdown-prone regions like the Gulf Coast often choose corrosion-resistant storage and sealed cabinet designs. Facilities in colder Midwestern markets may place more emphasis on mobile carts and service corridors that keep tool movement efficient during seasonal dock congestion or contractor-heavy shutdown periods. Regardless of geography, labels must be consistent. If a technician cannot identify where a seal kit, torque wrench, laser alignment tool, or VFD diagnostic meter belongs within seconds, the system is not yet lean enough. A useful buying guideline is to avoid buying shop furniture before workflow is defined. Too many projects start with catalogs instead of maintenance analysis. Bench depth, caster ratings, drawer sizing, power strip placement, and top material should all follow the actual repair mix. In food plants, stainless work surfaces often make sense for clean repair zones, but not every bench in the shop needs that premium cost. Parts inventory design is one of the strongest predictors of maintenance performance. Plants often spend heavily on critical spares but lose the value through poor storage discipline, weak min-max logic, and no kitting process. The maintenance shop should work closely with the storeroom, or include an integrated parts room, so technicians can move from work order to staged repair without scavenging through shelves. For U.S. manufacturers operating in volatile freight environments, parts strategy has become even more important. Lead times for motors, controls, sanitary valves, OEM change parts, and imported components can be affected by port traffic at Los Angeles/Long Beach, labor dynamics in East Coast logistics corridors, or supplier consolidation in major industrial clusters such as Chicago, Cincinnati, and Charlotte. A good shop layout supports this reality by clearly separating stocked inventory, quarantine items, repairable spares, and shutdown kits. This table highlights an important principle: the parts area is not just a storage room. It is a decision system. When the kitting bench is active and linked to preventive maintenance planning, technicians stop spending paid hours hunting for gaskets, bearings, sensors, and fasteners. That is one reason best-in-class plants often redesign staging and inventory flow before they expand headcount. Applications vary by industry. Beverage plants typically need stronger change-part management and frequent line-specific kits. Protein plants need rugged organization for wear items, knives, belts, and conveyors plus stricter contamination control. Dairy and aseptic plants require disciplined handling of sanitary rebuild kits, elastomers, instrumentation parts, and cleaned components ready for return to service. For supplier strategy, many U.S. sites use a blended approach: local industrial distributors for daily MRO needs, OEM direct channels for proprietary parts, regional stainless fabricators for custom brackets and guards, and national automation suppliers for controls hardware. Plants near industrial centers like Houston, Minneapolis, Indianapolis, or the Carolinas may have stronger local sourcing options than remote facilities, but every site still needs a critical-spares logic based on downtime impact, lead time, and failure probability. The comparison chart shows why many maintenance teams diversify sourcing. National automation suppliers may score well on system support and catalog depth, while local distributors often win on same-day service. Regional fabricators are especially valuable when a plant needs custom stainless modifications quickly during expansion or shutdown work. In food manufacturing, the maintenance shop cannot be designed as if it were outside the food safety system. Separation from production is essential not because maintenance is undesirable, but because maintenance activities generate metal filings, grease, dust, welding fumes, damaged parts, cardboard, pallets, and uncontrolled traffic. Without clear barriers and procedures, those elements can migrate toward product zones. The basic rule is simple: dirty work must stay away from hygienic exposure. That means dirty teardown, grinding, cutting, and fabrication should be enclosed or segregated from clean component rebuilds. Traffic from the shop into production should follow gowning, handwash, tool control, and component cleaning protocols appropriate to the product risk. This is especially important in ready-to-eat foods, dairy, aseptic operations, and facilities subject to USDA or stringent third-party audit scrutiny. The table makes clear that physical design and procedure must work together. A separate room for welding is useful, but it is not enough if technicians still place dirty parts on a sanitary rebuild bench. Likewise, a clean bench does not help if components travel through a pallet-laden receiving lane full of cardboard and debris. The highest-performing plants use color coding, pass-through carts, controlled cleaning points, and clearly marked floors to reinforce behavior. Future trends in 2026 include stronger zoning expectations in food safety plans, more emphasis on tool accountability, and increased use of stainless, cleanable finishes in maintenance areas adjacent to hygienic operations. Sustainability also plays a role. Better segregation reduces unnecessary re-cleaning, scrap, and product loss, which supports both cost control and environmental goals. Most food plants need some level of in-house welding and fabrication capability, but the scale depends on the production profile. A beverage plant with frequent support-frame changes and utility modifications may need a more active fabrication bay than an aseptic packaging site that outsources most hot work. Protein and prepared foods operations often benefit from robust repair capability for guards, stands, conveyor sections, brackets, and stainless touch-up work. The welding and fabrication setup should be physically separated, ventilated, and designed around safe material flow. At minimum, the area should include a welding table, fume extraction, fire-rated storage for gases and consumables, stainless-only tool controls where needed, grinding containment, and nearby access to scrap handling. If the plant regularly works with sanitary stainless, avoid letting carbon steel contamination migrate into those repair activities. For many U.S. processors, the business case for in-house fabrication is strongest when downtime is expensive and small modifications are frequent. Plants around major manufacturing centers often have access to local stainless shops, but relying entirely on outside support can still delay execution during shutdown season. The right answer is usually hybrid: keep core repair capability in house while outsourcing complex sanitary spool work, code vessels, or specialized high-load fabrication as needed. When buying equipment, think through power availability, ventilation paths, fire permitting, consumable storage, and maintenance skill level. A welder that looks ideal on paper may become underused if the space lacks proper isolation or if the facility policy restricts hot work to shutdown windows. Design must match actual operating governance. Heavy equipment access is often overlooked until a major motor, gearbox, pump skid, heat exchanger plate pack, or vessel agitator needs to move through the shop. At that point, every design mistake becomes visible. Efficient heavy repair requires clear floor lanes, adequate door widths, turning radii, staging space, and either overhead lifting or a practical alternative such as jib cranes, hoists, or forklift access. Plants with large processing assets should evaluate lifting needs early. If the facility handles large homogenizers, compressors, mixers, retort baskets, refrigeration components, or utility skids, the maintenance shop may need a dedicated heavy bay. This is common in larger beverage, dairy, and utility-intensive food plants across the United States, especially in expansion markets like Texas, the Carolinas, and California’s Central Valley where processing scale continues to grow. The explanation behind this table is simple: not every plant needs a full overhead crane, but every plant needs a deliberate heavy-movement strategy. If a facility skips that step, technicians improvise with forklifts, pallet jacks, and unsafe lifting practices. That raises risk and extends downtime. The bar chart indicates that protein, dairy, and beverage facilities tend to place the highest demand on heavy maintenance access because of the combination of large rotating equipment, packaging machinery, and utility systems. This is one reason why maintenance shop design should be tied to actual asset classes, not generic assumptions. An efficient maintenance shop in 2026 is both physical and digital. If the space is well organized but disconnected from the CMMS, planners still struggle, parts visibility stays weak, and technicians lose time updating records. The best shop design supports maintenance workflow from request to closeout: work orders arrive digitally, spare parts are linked to tasks, kitting is visible, labor hours are captured, and completed work flows into preventive and reliability analysis. CMMS integration should be visible inside the shop. That may include planner stations, tablets at benches, screens showing PM completion, parts shortages, critical equipment backlog, and technician dispatch boards. In many U.S. plants, especially multi-line sites with tight production commitments, this digital visibility helps shift the culture from reactive maintenance to planned execution. The explanation here is that digital systems only create value when the shop design supports them. If planners do not have space to stage kits, if technicians cannot access asset history at the bench, or if parts are not physically organized to match CMMS data, the software will underperform. Good maintenance execution depends on physical order and information order working together. The area chart shows the expected shift in maintenance strategy. As plants improve data quality and parts planning, reactive work generally declines while preventive, predictive, and coordinated outage work increase. That shift should influence shop design: more kitting, more planning space, better component history, and stronger repair documentation. If your facility is considering broader capital upgrades, digital maintenance planning should connect to engineering decisions early. Process modifications, utility expansions, automation upgrades, and equipment replacements affect shop needs, spare parts philosophy, and technician skill requirements. Companies looking for integrated support on design, installation, and system execution often benefit from a partner that understands both production engineering and maintenance realities. DPS describes its integrated delivery approach and broader project capabilities on its services page, which is useful context for processors evaluating capital improvements tied to maintenance reliability. Disruptive Process Solutions supports food and beverage manufacturers across the United States and Canada with a practical, execution-focused approach to engineering and capital project delivery. Rather than treating maintenance shop planning as a standalone room layout exercise, DPS looks at how the shop supports uptime, sanitation, utility reliability, future expansion, and the profitability of the full plant. From a technological capability standpoint, DPS works across structural, mechanical, plumbing, electrical, process, and controls engineering, including PLC programming, automation, and SCADA. That matters in maintenance shop design because reliability is shaped by more than benches and cabinets. Utility routing, power distribution, controls visibility, sanitary process requirements, and equipment access all affect how maintenance teams perform. For plants managing systems such as pasteurization, aseptic processing, blending, fermentation, carbonation, retort, refrigeration, CIP, or wastewater support, a maintenance space should reflect the complexity of those assets and their service demands. From a manufacturing capability perspective, DPS also brings experience with proprietary process equipment and custom fabrication-oriented solutions, including tanks, CIP systems, tumblers, and cooking vessels. That manufacturing perspective helps when planning shop layouts for plants that need in-house component handling, custom stainless modifications, or better staging for large process assemblies. You can review more about the company’s equipment-related capabilities on the equipment page. From a service capability perspective, DPS supports capital planning, feasibility studies, owner’s representation, project and program management, general contracting where licensed, equipment supply, installation, and integration. This is valuable for processors that need a maintenance shop redesign as part of a broader plant expansion, line relocation, utility upgrade, or greenfield project. Instead of handling shop design in isolation, the company can align the space with future production strategy, contractor management, and startup planning. To learn more about the firm’s background and operating philosophy, visit the about page. One of the strongest differentiators is the company’s focus on honest, profit-minded planning. In practice, that means evaluating whether the client truly needs more floor space, different programming, better spares logic, utility reconfiguration, or a larger capital solution. For food and beverage manufacturers trying to avoid wasteful spending, that mindset can be more valuable than a generic design package. Case-based learning is especially useful in maintenance planning. Processors evaluating shop changes alongside broader upgrades can explore selected project examples on the case studies page to understand how integrated execution affects long-term performance. What is the ideal size for a food plant maintenance shop?There is no single correct size. A practical range is often 1.5% to 3.2% of production support area, depending on asset complexity, repair strategy, and whether fabrication, clean rebuilds, and spare parts are housed inside the same footprint. Should a maintenance shop be inside or outside production?It should be near production for response speed, but separated from food-contact and high-hygiene zones. The right answer is usually adjacent access with controlled barriers, not direct open connection to processing areas. Do all food plants need a welding area?No, but many benefit from one. Smaller or highly regulated plants may outsource most hot work. Facilities with frequent stainless modifications, support-frame repairs, or conveyor work often gain value from a dedicated fabrication bay. How important is a clean rebuild area?Very important in dairy, beverage, aseptic, and ready-to-eat operations. Sanitary valves, pumps, seal kits, and food-contact components should be rebuilt in a separate clean zone rather than on a dirty general bench. What is the biggest mistake in shop design?Designing around leftover space instead of maintenance workflow. Poor location, mixed clean and dirty activities, weak parts staging, and no heavy-access planning are common causes of long-term inefficiency. How should spare parts be organized?Use clearly labeled zones for critical spares, consumables, kitted PM work, repairable assets, and quarantine items. The layout should match CMMS logic so physical storage and digital records support each other. Is an overhead crane necessary?Only if your asset mix justifies it. Many plants can use jib cranes, hoists, forklifts, and heavy carts instead. The key is to plan safe lifting and movement before a major repair forces improvisation. How does maintenance shop design support preventive maintenance?A well-designed shop improves PM execution by making kits, tools, work orders, and clean rebuild space easy to access. When technicians spend less time searching and more time performing planned work, schedule compliance improves. What 2026 trends should U.S. processors watch?Expect stronger CMMS integration, more digital tool and parts control, wider use of visual management, growing interest in light predictive maintenance, cleaner zoning for audit readiness, and more sustainability-driven waste reduction in repair practices. When should maintenance shop planning be included in a capital project?At the very beginning. If you wait until equipment is installed or floor space is nearly committed, the shop will likely be undersized, poorly located, or disconnected from production and utility realities. In summary, the highest-performing maintenance shops in U.S. food and beverage plants are intentionally located, cleanly zoned, digitally connected, and designed around actual repair work rather than assumptions. They support production uptime, reduce contamination risk, strengthen preventive maintenance, and make better use of skilled labor. Whether the facility is a dairy processor in Wisconsin, a co-packer in North Carolina, a beverage plant in Texas, or a protein operation serving the Midwest distribution corridor, the same principle holds true: maintenance space should be planned as an operational system, not treated as leftover square footage. -
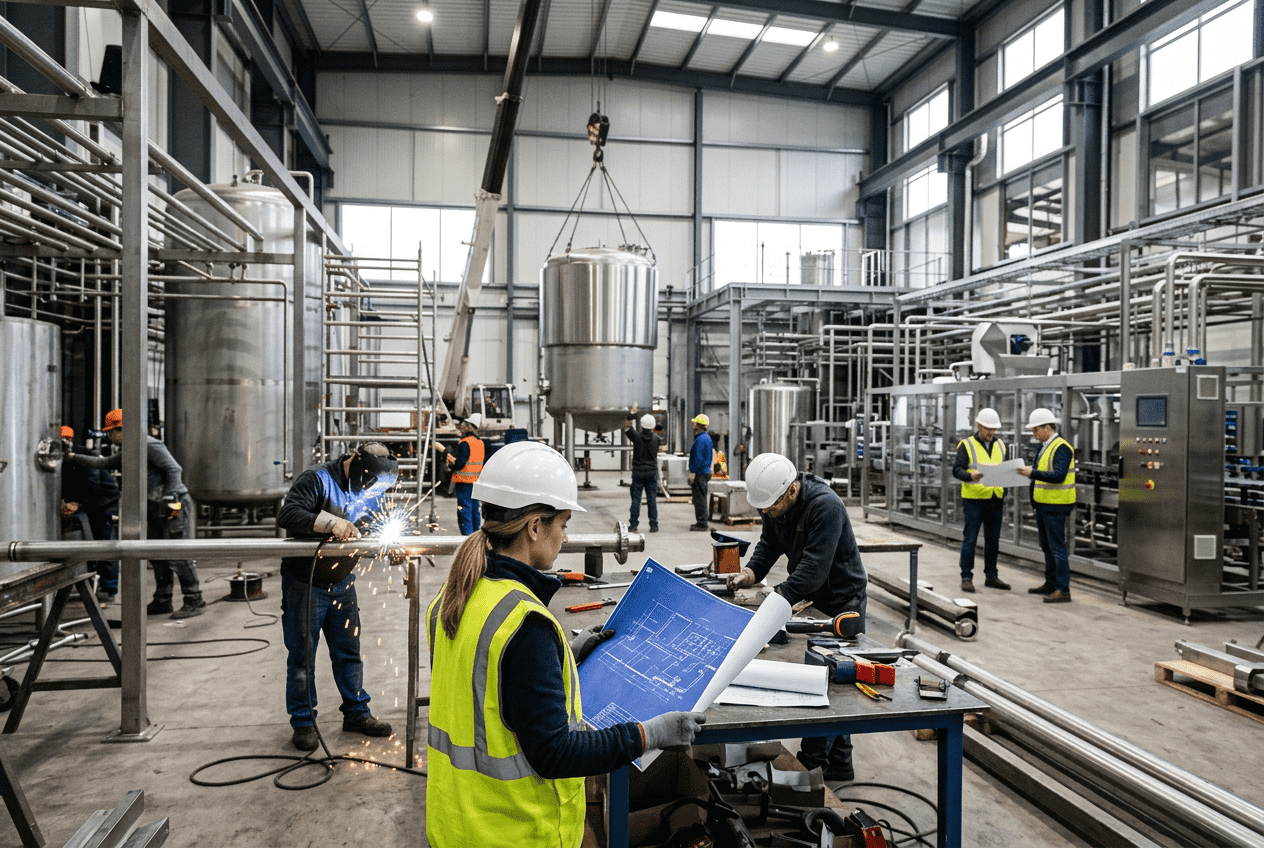
RTD Beverage Production Line Design
Ready-to-drink beverage producers in the United States need production lines that do more than simply fill cans or bottles. They need systems that connect formulation, blending, carbonation, sanitation, packaging, controls, and long-term capacity strategy into one reliable operating model. Whether the product is a canned cocktail, hard tea, functional beverage, sparkling water, dairy-based RTD, or non-carbonated wellness drink, the best line design starts with understanding product behavior, packaging goals, SKU complexity, utility demand, regulatory requirements, and future growth. Across major beverage corridors such as Chicago, Dallas, Los Angeles, Atlanta, Charlotte, and the New Jersey distribution hub, manufacturers are investing in flexible lines that can handle multiple package formats while keeping changeover time low. In port-driven regions such as Long Beach, Houston, Savannah, and Newark, supply chain resilience also matters: the choice of depalletizer, filler, seam inspection, labeler, date coder, case packer, and palletizing logic directly affects labor, uptime, and speed-to-market. For companies evaluating a new installation or expansion, the line should be designed around three realities: upstream process consistency, downstream packaging balance, and smart capital deployment. That means sizing tanks, pumps, fillers, conveyors, and controls based on both current sales and the next several years of expected growth, not just today’s forecast. A complete RTD production line in the United States typically includes raw ingredient receiving, water treatment if needed, batching and blending vessels, syrup or ingredient dosing, carbonation or deaeration depending on the product, buffer tanks, product feed systems, filling and closing equipment, inspection, coding, labeling, secondary packaging, palletizing, utilities, CIP, and plant-wide automation. The most effective designs match product characteristics and packaging format to target speed, sanitation requirements, SKU flexibility, and expansion plans. For multi-SKU operations, the strongest line designs minimize downtime between can sizes, bottle types, closures, label formats, and flavor changes. For high-acid, alcoholic, dairy, or sensitive functional products, process integration becomes even more important because fill temperature, dissolved oxygen, carbonation level, mix accuracy, hygienic design, and cleaning validation all influence shelf life and product quality. In practical terms, an RTD line should answer five questions before equipment is purchased: That is where a full-scope engineering partner matters. Disruptive Process Solutions works with beverage manufacturers across North America on profit-focused plant planning, line integration, and capital execution, helping teams avoid overspending on equipment that does not solve the real bottleneck. An RTD line is only as strong as its weakest link. Many facilities focus on the filler because it is visible and expensive, but overall performance depends on the full chain from blending through palletizing. A well-designed line balances hygienic processing, packaging efficiency, operator access, maintenance windows, and material staging. Typical upstream components include ingredient receiving stations, liquid sugar or sweetener systems, powder induction, batching tanks, in-line blending skids, heat treatment where required, carbonation systems, product surge tanks, sanitary pumps, and product feed loops. Midstream equipment includes rinsers where applicable, fillers, seamers or cappers, and inspection tools. Downstream systems generally include warmers or tunnel pasteurization if required by the product, drying, labelers, coding, cartoning or tray packing, shrink wrapping, case packing, palletizing, and finished goods conveyance. The table above shows why line design must be holistic. A plant may buy an excellent filler and still struggle if syrup batching is inconsistent, CIP turnaround is slow, or the packer cannot keep up. In the United States, this is especially common in converted warehouse facilities where electrical service, drain layout, floor slope, and compressed air distribution were not originally designed for beverage production. Market demand is also broadening. RTD categories now include cocktails, hard seltzers, hard coffee, energy drinks, hydration beverages, botanical infusions, protein beverages, and dairy-based products. Each category has different process and packaging sensitivities, so the equipment list should be product-led, not vendor-led. The growth trend above reflects a realistic pattern seen in U.S. RTD investment: more capacity is being added, but with stronger emphasis on flexibility, lower labor dependence, and plant data visibility. Many RTD plants are no longer single-product or single-format facilities. One shift may run 12-ounce sleek cans for a functional beverage, while the next runs 355 ml standard cans for a sparkling tea or PET bottles for a still product. Because of this, multi-SKU flexibility is often more important than peak nameplate speed. Effective changeover design begins with identifying which components are truly format-dependent. These usually include infeed timing screws, guide rails, starwheels, neck handling parts, fill valves, lid feed components, cap sorters, labeler setup, packer tooling, and pallet patterns. Plants that run both cans and bottles should also consider whether a shared downstream section is practical or whether separate pathways reduce cumulative downtime. In major co-packing regions such as Southern California, the Carolinas, and Texas, flexible format capability is often the deciding factor in winning new business. A line that changes quickly between SKUs can produce more billable hours than a faster line with long setup windows. The table shows that format flexibility is not just a machine feature; it is an operating strategy. Plants should evaluate changeover by elapsed time, labor required, skill required, first-good-package timing, and quality loss during ramp-up. In many cases, the most profitable investment is not a bigger filler but a better change-parts strategy combined with operator training and digital setup recipes. Facilities can also reduce disruptions by grouping similar package runs, designing mobile parts carts, color-coding tooling, and using barcode-based recipe confirmation. Those details matter when a plant is running six to twelve SKUs per week. Upstream integration determines whether the filler receives a stable, specification-ready product. If blend accuracy drifts, temperature rises, carbonation varies, or dissolved oxygen increases, packaging performance and shelf life will suffer. For alcoholic RTDs, tea-based drinks, juice blends, nutraceutical products, and dairy beverages, this section of the line is often where product quality is won or lost. Core design factors include batch size, ingredient sequencing, shear requirements, hold time, agitation profile, cleanability, thermal sensitivity, carbonation setpoint, and fill pressure matching. Some products benefit from batch blending for traceability and formulation control. Others are better served by in-line blending to improve speed and reduce tank footprint. DPS brings process engineering depth into this stage through capabilities that include blending and batching design, in-line Brix monitoring, carbonation and bright tank systems, water treatment, pasteurization options, and advanced controls integration. On projects where the process recipe and the packaging rate need to align tightly, this technical capability is critical because upstream variability often appears downstream as filler inefficiency. This table highlights why a universal upstream layout rarely works. In the United States, a producer serving retail chains in New York, Miami, Denver, and Seattle may have regional demand for entirely different product families. Designing a process room that can adapt to those categories improves asset utilization and reduces future retrofit cost. For example, the fill-preparation system should not be isolated from packaging controls. If the packaging line is running at 220 cans per minute but the carbonator and product feed system only support 190 cans per minute under real conditions, the plant will experience chronic starvation and low efficiency. Integration prevents that mismatch. Wild Goose filling systems and similar modern canning technologies are frequently considered by RTD producers looking for dependable can line performance, compact layouts, and scalable throughput. For many beverage brands and co-packers, canning remains the dominant package format because it supports convenience, strong shelf presence, shipping efficiency, and excellent compatibility with carbonated and alcoholic products. When evaluating canning technology, buyers should look beyond filler valve count and published maximum speed. Important factors include seam integrity monitoring, dissolved oxygen management, sanitation design, operator ergonomics, parts availability in the United States, remote support response time, lid handling reliability, and integration with depalletizers, conveyors, labelers, and case packers. DPS supports equipment integration and complete line development, not just machine placement. That includes evaluating the canning system as part of the full production environment: utilities, automation, packaging balance, changeover logic, and growth planning. For clients that also need fabricated process equipment, custom equipment capabilities can complement third-party line machinery with tanks, CIP skids, and supporting process assets. The comparison above shows that the right canning solution depends on business model. A craft-scale brand entering grocery distribution near Charlotte or Phoenix may prioritize footprint and startup affordability. A contract manufacturer near Dallas-Fort Worth or Inland Empire may instead prioritize fast SKU changeovers and service support. Equipment choice should reflect margin structure, labor availability, and customer commitments. The chart provides a realistic comparison profile for what U.S. buyers often value when benchmarking filler and canning line options. Quality assurance and service access usually rank near the top because downtime and packaging defects carry immediate commercial consequences. A beverage line should be engineered around sustained balanced throughput, not isolated machine speed. One of the most common mistakes in RTD line projects is buying a filler that outpaces the rest of the packaging system. If the filler can run 300 containers per minute but the labeler averages 240 and the case packer dips to 220 during normal operation, the practical line speed will settle near the slowest stable point. Line speed optimization uses machine data, accumulation modeling, package handling analysis, and real-world downtime assumptions to determine sustainable output. Small microstops across coding, labeling, orienting, pack formation, or discharge lanes can erase the benefits of a larger filler. DPS approaches this from a profitability standpoint. Through its engineering and project execution model, the goal is not simply to install equipment, but to make sure capital is aimed at the actual bottleneck. That aligns with its broader service capability in capital planning, owner representation, process engineering, project management, and turnkey system integration. Companies can review broader project experience through selected case studies. This table illustrates the concept of effective line speed. The filler may still be the most expensive machine, but it is not always the dominant limiter. Often, downstream packaging variations create the largest hidden losses. A layout with strategic accumulation can absorb short disturbances, but it cannot fix a chronically undersized packer. The bar chart shows relative project demand by RTD category. Alcoholic and functional beverages are driving significant investment, which is why flexible line balancing has become essential for co-packers and branded manufacturers alike. Frequent flavor rotation and multi-product scheduling make CIP design a major strategic issue in RTD manufacturing. A cleaning system that takes too long or uses excessive water, chemicals, and labor can materially reduce plant profitability. On the other hand, an undersized or poorly engineered CIP system can create hygiene risk, flavor carryover, and lost production time. For plants producing cocktails, juices, teas, dairy beverages, or sweetened functional drinks, the sanitation challenge is different in each case. Sugar residues, proteins, botanicals, colors, and flavor oils may require different cleaning sequences, temperatures, chemical strengths, and verification methods. DPS has strong capability in CIP engineering and supporting utilities, including custom CIP systems, process piping, controls, and integration with broader plant infrastructure. On the manufacturing side, the company also designs and supplies its own tanks and CIP-related process equipment, allowing sanitation strategy to be coordinated directly with process layout. The table emphasizes that CIP is both a sanitation system and a scheduling tool. When changeovers are frequent, CIP performance directly affects capacity. For example, a plant in the Midwest running six flavored SKUs plus one allergen-sensitive product may gain more annual output by improving clean-turnaround cycles than by increasing filler speed. Water and wastewater considerations are also growing in importance in 2026 planning, particularly in regions with tightening utility costs such as California, Arizona, Colorado, and parts of Texas. Sustainable CIP design increasingly includes conductivity-based recovery, optimized rinse volumes, heat recovery, and digital verification to reduce unnecessary cycles. Automation is no longer optional for competitive RTD plants in the United States. Even modest facilities benefit from integrated PLC controls, batch management, recipe handling, alarm tracking, OEE monitoring, and SCADA visualization. The reason is simple: labor is expensive, downtime is costly, and inconsistency multiplies across every shift. Plant-wide automation should connect upstream processing, filling, packaging, utilities, CIP, and production reporting. Recipe selection should flow from blend preparation to labeler setup, coding logic, and pallet patterns where practical. Operators should be able to see the status of tanks, pumps, filler conditions, seam checks, utility alarms, and CIP completion from a central interface. DPS has in-house controls engineering, PLC programming, automation, and SCADA capability as part of its technological service base. That matters because line automation should not be added after equipment arrives; it should be designed as part of the overall process, utility, and packaging architecture. For RTD producers managing customer specifications, automation can also support traceability. Lot records, ingredient usage, critical process values, temperature history, and sanitation completion records become easier to retrieve for audits and investigations. This is especially relevant for operations serving national retail, club stores, and regulated alcoholic beverage channels. The area chart shows the expected shift toward integrated plant controls. By 2026, more RTD facilities are expected to invest in connected automation not just for visibility, but for faster troubleshooting, easier compliance, and better labor utilization. Future trends are also shaping automation choices. Cybersecurity requirements are rising, especially for larger manufacturers. Sustainability reporting is becoming more data-driven, requiring meter integration for water, steam, compressed air, and electrical use. AI-assisted maintenance and predictive downtime alerts are also moving from pilot projects into practical operations, particularly in higher-volume co-packing plants. Capacity planning is where engineering meets business strategy. A line should not be sized only for launch volume, but it also should not be overbuilt so severely that capital efficiency suffers. The right answer usually depends on forecast credibility, SKU mix, customer concentration, seasonal peaks, and whether the facility will act as a branded plant, co-packer, or hybrid operation. In the United States, capacity planning often needs to reflect distribution geography. A plant shipping throughout the Southeast from North Carolina or Georgia may need different storage, staging, and line utilization assumptions than a West Coast producer serving California, Nevada, and the Pacific Northwest. Freight lanes, warehouse access, labor supply, and utility expansion options all influence sizing decisions. DPS is particularly relevant in this phase because its service model combines capital planning, feasibility, design-build execution, owner representation, and full project management. Instead of treating equipment as a stand-alone purchase, the company works from a broader operational and financial view, helping clients align process design, utilities, construction, and phased expansion with profitability goals. More on these services can be found at engineering and project services. The best equipment sizing plan is phased. Phase 1 should support current launch or contract demand. Phase 2 should be enabled in the layout, controls, utility headers, and floor space. Phase 3 should remain commercially justifiable but not fully purchased until market evidence supports it. A strong example is a beverage co-packing facility designed to ramp from early-year volume into much larger full-capacity output over time. That kind of strategy requires utility infrastructure, syrup or blending systems, and production layouts that can scale without tearing out recently installed assets. This is where practical engineering discipline prevents expensive rework. For buyers comparing suppliers, local presence and execution model matter as much as machine specifications. U.S. beverage plants often benefit from a partner that can manage process engineering, construction coordination, utilities, controls, and commissioning in one integrated framework rather than handing off responsibility between separate firms. That integrated approach is a defining part of DPS’s value. Its manufacturing capability includes custom tanks up to 12,000 gallons, CIP systems, and other process equipment. Its technological capability includes process, mechanical, electrical, structural, and controls engineering. Its service capability includes capital planning, general contracting where licensed, installation management, owner advocacy, commissioning, and turnkey integration. For beverage producers trying to reduce project risk, that combination helps keep decisions aligned from concept through startup. What is the most important factor in RTD production line design?The most important factor is alignment between product requirements, packaging format, and sustained throughput. A line that looks fast on paper but does not fit the product or changeover profile will underperform. Should a new RTD plant choose cans, bottles, or both?That depends on the product portfolio, retailer expectations, shipping economics, and capital budget. Cans dominate many RTD categories, but bottles remain important for still beverages, premium positioning, and certain closure needs. How much flexibility should be designed into a line?Enough to support the realistic 24- to 60-month SKU roadmap. Flexibility has value, but it should be targeted. The goal is not to prepare for every possible product, but to avoid costly retrofits for likely growth paths. Why is upstream process design so critical?Because blend accuracy, temperature control, carbonation consistency, and oxygen management determine what reaches the filler. Packaging performance depends heavily on stable upstream product preparation. How do I know if my filler is too large or too small?Compare the real sustained rate of the full line, not the filler nameplate alone. If the labeler, case packer, CIP turnaround, or product supply cannot support the filler, the extra speed may not create value. What should I ask equipment suppliers during evaluation?Ask about sustained speed, parts availability in the United States, sanitation design, changeover time, operator skill requirements, controls integration, and references for similar products and formats. How important is SCADA for an RTD plant?Very important, especially for plants with multiple SKUs, sanitation documentation needs, utility monitoring requirements, or co-packing customers demanding visibility and traceability. What are the major RTD line trends for 2026?Key trends include smarter changeover systems, wider use of SCADA and digital reporting, sustainability-driven CIP optimization, tighter utility metering, predictive maintenance, and stronger compliance around data, sanitation, and packaging quality. Can DPS support both process and packaging line integration?Yes. DPS supports engineering, installation, integration, project management, utilities, process systems, controls, and custom equipment as part of a broader design-build-manage model for food and beverage manufacturers across North America. Where should a U.S. manufacturer start if planning a new RTD line?Start with a feasibility and capacity study covering product mix, package formats, utility loads, sanitation requirements, line balance, labor model, and phased growth. That prevents capital from being spent in the wrong place. For RTD producers in the United States, the right line design is ultimately a business decision supported by engineering. When blending, carbonation, filling, sanitation, packaging, controls, and future capacity are planned together, the result is not just a functioning line, but a more profitable operation.


